
An official website of the United States government
An official website of the United States government
The .gov means it's official.
Federal government websites often end in .gov or .mil. Before sharing sensitive information,
make sure you're on a federal government site.
The site is secure.
The
https:// ensures that you are connecting to the official website and that any
information you provide is encrypted and transmitted securely.
Prepare cost estimates for product manufacturing, construction projects, or services to aid management in bidding on or determining price of product or service. May specialize according to particular service performed or type of product manufactured.
Employment estimate and mean wage estimates for Cost Estimators:
| Employment (1) | Employment RSE (3) |
Mean hourly wage |
Mean annual wage (2) |
Wage RSE (3) |
|---|---|---|---|---|
| 220,970 | 0.8 % | $ 38.23 | $ 79,520 | 0.5 % |
Percentile wage estimates for Cost Estimators:
| Percentile | 10% | 25% | 50% (Median) |
75% | 90% |
|---|---|---|---|---|---|
| Hourly Wage | $ 21.55 | $ 27.47 | $ 35.94 | $ 46.51 | $ 59.87 |
| Annual Wage (2) | $ 44,820 | $ 57,130 | $ 74,740 | $ 96,740 | $ 124,520 |
Industries with the highest published employment and wages for Cost Estimators are provided. For a list of all industries with employment in Cost Estimators, see the Create Customized Tables function.
Industries with the highest levels of employment in Cost Estimators:
| Industry | Employment (1) | Percent of industry employment | Hourly mean wage | Annual mean wage (2) |
|---|---|---|---|---|
| Building Equipment Contractors | 31,870 | 1.31 | $ 40.76 | $ 84,770 |
| Automotive Repair and Maintenance | 20,490 | 2.05 | $ 32.52 | $ 67,650 |
| Nonresidential Building Construction | 19,630 | 2.29 | $ 45.40 | $ 94,430 |
| Foundation, Structure, and Building Exterior Contractors | 18,470 | 1.89 | $ 37.49 | $ 77,990 |
| Building Finishing Contractors | 16,350 | 1.95 | $ 35.58 | $ 74,000 |
Industries with the highest concentration of employment in Cost Estimators:
| Industry | Employment (1) | Percent of industry employment | Hourly mean wage | Annual mean wage (2) |
|---|---|---|---|---|
| Nonresidential Building Construction | 19,630 | 2.29 | $ 45.40 | $ 94,430 |
| Automotive Repair and Maintenance | 20,490 | 2.05 | $ 32.52 | $ 67,650 |
| Building Finishing Contractors | 16,350 | 1.95 | $ 35.58 | $ 74,000 |
| Foundation, Structure, and Building Exterior Contractors | 18,470 | 1.89 | $ 37.49 | $ 77,990 |
| Residential Building Construction | 14,600 | 1.58 | $ 33.98 | $ 70,670 |
Top paying industries for Cost Estimators:
| Industry | Employment (1) | Percent of industry employment | Hourly mean wage | Annual mean wage (2) |
|---|---|---|---|---|
| Scientific Research and Development Services | 320 | 0.03 | $ 59.28 | $ 123,300 |
| Securities, Commodity Contracts, and Other Financial Investments and Related Activities | 90 | 0.01 | $ 55.83 | $ 116,130 |
| Employment Services | 2,030 | 0.05 | $ 55.35 | $ 115,130 |
| Rail Transportation | 30 | 0.02 | $ 52.49 | $ 109,190 |
| Electric Power Generation, Transmission and Distribution | 520 | 0.13 | $ 51.60 | $ 107,330 |
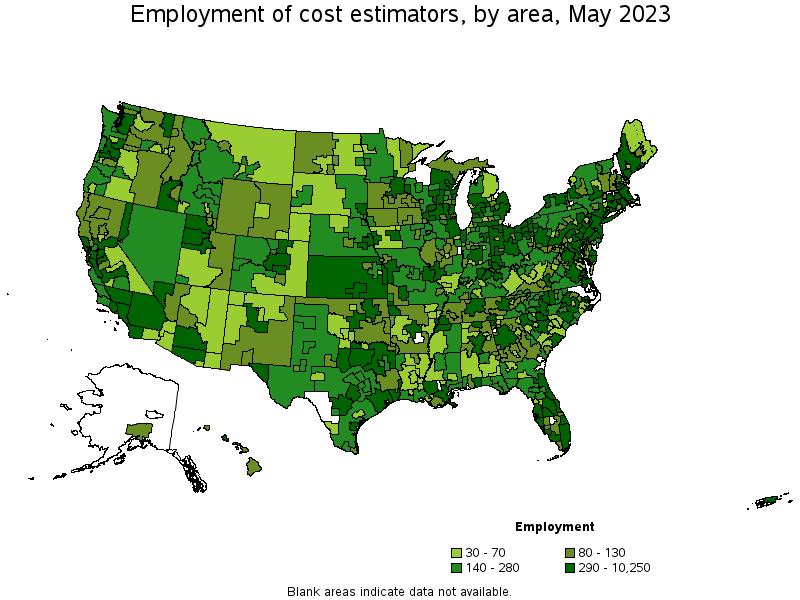
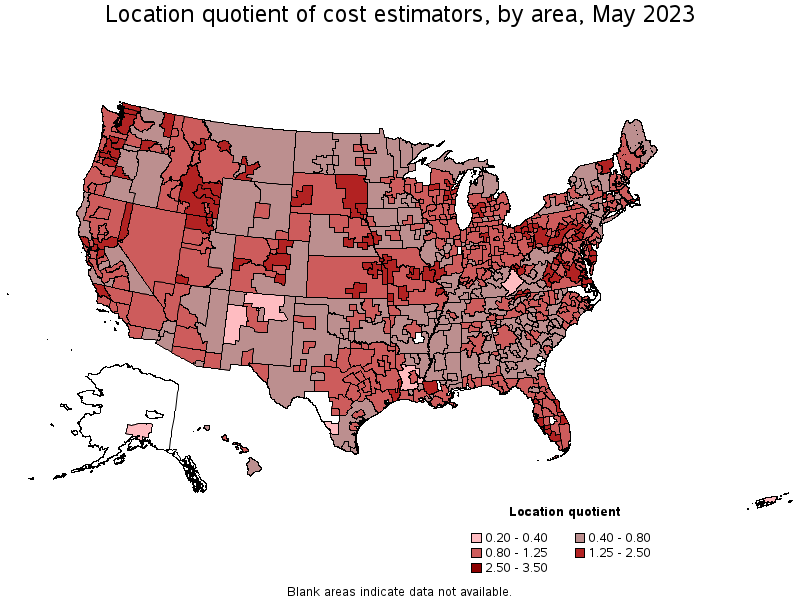
States and areas with the highest published employment, location quotients, and wages for Cost Estimators are provided. For a list of all areas with employment in Cost Estimators, see the Create Customized Tables function.
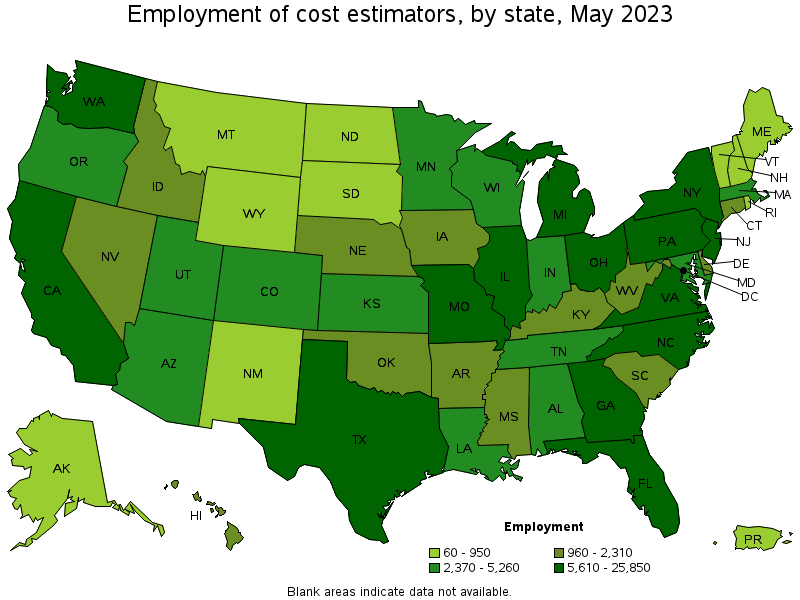
States with the highest employment level in Cost Estimators:
| State | Employment (1) | Employment per thousand jobs | Location quotient (9) | Hourly mean wage | Annual mean wage (2) |
|---|---|---|---|---|---|
| California | 25,850 | 1.44 | 0.99 | $ 43.93 | $ 91,360 |
| Texas | 20,240 | 1.49 | 1.03 | $ 36.70 | $ 76,340 |
| Florida | 14,150 | 1.48 | 1.02 | $ 35.00 | $ 72,800 |
| New York | 9,680 | 1.03 | 0.71 | $ 43.33 | $ 90,120 |
| Pennsylvania | 9,620 | 1.62 | 1.11 | $ 38.22 | $ 79,490 |
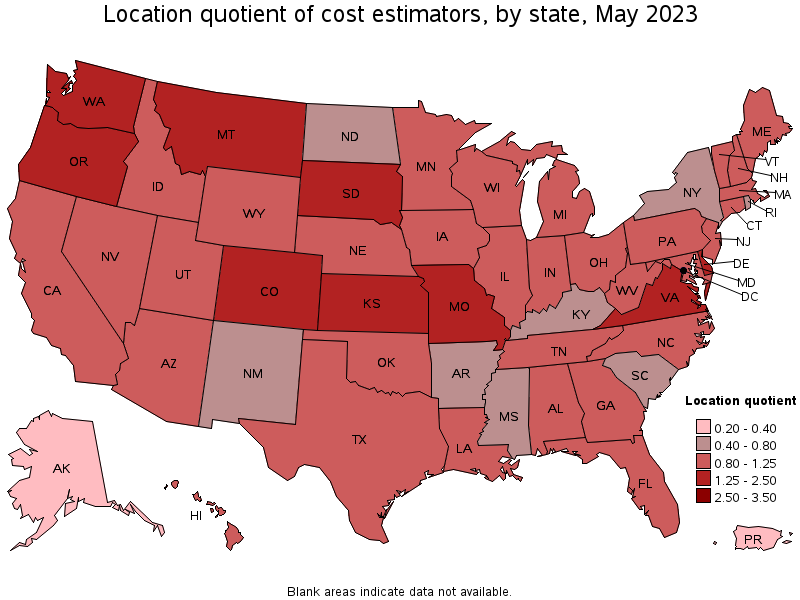
States with the highest concentration of jobs and location quotients in Cost Estimators:
| State | Employment (1) | Employment per thousand jobs | Location quotient (9) | Hourly mean wage | Annual mean wage (2) |
|---|---|---|---|---|---|
| Delaware | 1,170 | 2.48 | 1.71 | $ 35.40 | $ 73,640 |
| Missouri | 6,650 | 2.31 | 1.59 | $ 36.89 | $ 76,730 |
| South Dakota | 950 | 2.13 | 1.46 | $ 34.45 | $ 71,650 |
| Oregon | 3,970 | 2.05 | 1.41 | $ 38.28 | $ 79,610 |
| Washington | 6,980 | 2.00 | 1.37 | $ 42.80 | $ 89,020 |
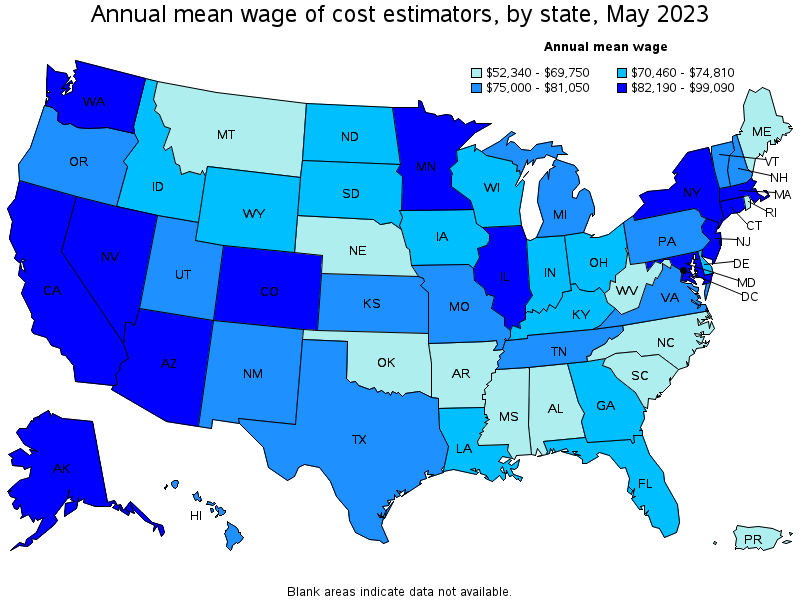
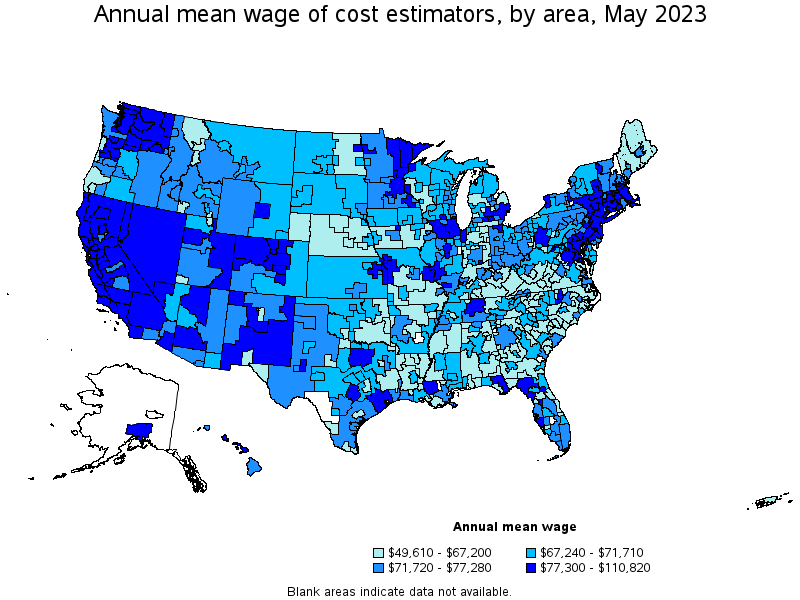
Top paying states for Cost Estimators:
| State | Employment (1) | Employment per thousand jobs | Location quotient (9) | Hourly mean wage | Annual mean wage (2) |
|---|---|---|---|---|---|
| Massachusetts | 4,630 | 1.27 | 0.87 | $ 47.64 | $ 99,090 |
| District of Columbia | 380 | 0.54 | 0.37 | $ 45.88 | $ 95,420 |
| California | 25,850 | 1.44 | 0.99 | $ 43.93 | $ 91,360 |
| New York | 9,680 | 1.03 | 0.71 | $ 43.33 | $ 90,120 |
| Washington | 6,980 | 2.00 | 1.37 | $ 42.80 | $ 89,020 |
Metropolitan areas with the highest employment level in Cost Estimators:
| Metropolitan area | Employment (1) | Employment per thousand jobs | Location quotient (9) | Hourly mean wage | Annual mean wage (2) |
|---|---|---|---|---|---|
| New York-Newark-Jersey City, NY-NJ-PA | 10,250 | 1.08 | 0.74 | $ 44.53 | $ 92,620 |
| Los Angeles-Long Beach-Anaheim, CA | 7,200 | 1.16 | 0.80 | $ 42.22 | $ 87,810 |
| Dallas-Fort Worth-Arlington, TX | 6,520 | 1.64 | 1.13 | $ 37.31 | $ 77,600 |
| Chicago-Naperville-Elgin, IL-IN-WI | 5,520 | 1.22 | 0.84 | $ 40.37 | $ 83,970 |
| Houston-The Woodlands-Sugar Land, TX | 5,260 | 1.65 | 1.14 | $ 38.25 | $ 79,570 |
| Philadelphia-Camden-Wilmington, PA-NJ-DE-MD | 4,410 | 1.56 | 1.07 | $ 40.38 | $ 84,000 |
| Washington-Arlington-Alexandria, DC-VA-MD-WV | 4,380 | 1.42 | 0.97 | $ 42.06 | $ 87,480 |
| Seattle-Tacoma-Bellevue, WA | 4,250 | 2.05 | 1.41 | $ 44.68 | $ 92,930 |
| Atlanta-Sandy Springs-Roswell, GA | 3,950 | 1.40 | 0.96 | $ 36.19 | $ 75,280 |
| Phoenix-Mesa-Scottsdale, AZ | 3,780 | 1.65 | 1.14 | $ 44.13 | $ 91,790 |
Metropolitan areas with the highest concentration of jobs and location quotients in Cost Estimators:
| Metropolitan area | Employment (1) | Employment per thousand jobs | Location quotient (9) | Hourly mean wage | Annual mean wage (2) |
|---|---|---|---|---|---|
| Danbury, CT | 250 | 3.28 | 2.25 | $ 35.33 | $ 73,480 |
| Greeley, CO | 350 | 3.12 | 2.15 | $ 38.22 | $ 79,500 |
| Manhattan, KS | 120 | 2.94 | 2.02 | $ 33.87 | $ 70,450 |
| Lancaster, PA | 690 | 2.78 | 1.91 | $ 37.55 | $ 78,110 |
| Santa Rosa, CA | 570 | 2.75 | 1.89 | $ 45.65 | $ 94,950 |
| Jefferson City, MO | 200 | 2.68 | 1.84 | $ 34.80 | $ 72,380 |
| Virginia Beach-Norfolk-Newport News, VA-NC | 1,950 | 2.64 | 1.82 | $ 35.22 | $ 73,260 |
| Sioux Falls, SD | 420 | 2.52 | 1.73 | $ 35.60 | $ 74,050 |
| Mount Vernon-Anacortes, WA | 130 | 2.50 | 1.72 | $ 40.16 | $ 83,540 |
| Naples-Immokalee-Marco Island, FL | 410 | 2.50 | 1.72 | $ 37.15 | $ 77,280 |
Top paying metropolitan areas for Cost Estimators:
| Metropolitan area | Employment (1) | Employment per thousand jobs | Location quotient (9) | Hourly mean wage | Annual mean wage (2) |
|---|---|---|---|---|---|
| San Francisco-Oakland-Hayward, CA | 3,650 | 1.51 | 1.04 | $ 53.28 | $ 110,820 |
| San Jose-Sunnyvale-Santa Clara, CA | 1,800 | 1.57 | 1.08 | $ 49.87 | $ 103,720 |
| Santa Cruz-Watsonville, CA | 230 | 2.39 | 1.64 | $ 49.69 | $ 103,360 |
| Boston-Cambridge-Nashua, MA-NH | 3,250 | 1.18 | 0.81 | $ 49.30 | $ 102,540 |
| Santa Rosa, CA | 570 | 2.75 | 1.89 | $ 45.65 | $ 94,950 |
| Vallejo-Fairfield, CA | 260 | 1.86 | 1.28 | $ 45.22 | $ 94,060 |
| California-Lexington Park, MD | 80 | 1.74 | 1.19 | $ 44.98 | $ 93,560 |
| Worcester, MA-CT | 330 | 1.16 | 0.79 | $ 44.74 | $ 93,060 |
| Seattle-Tacoma-Bellevue, WA | 4,250 | 2.05 | 1.41 | $ 44.68 | $ 92,930 |
| New York-Newark-Jersey City, NY-NJ-PA | 10,250 | 1.08 | 0.74 | $ 44.53 | $ 92,620 |
Nonmetropolitan areas with the highest employment in Cost Estimators:
| Nonmetropolitan area | Employment (1) | Employment per thousand jobs | Location quotient (9) | Hourly mean wage | Annual mean wage (2) |
|---|---|---|---|---|---|
| North Northeastern Ohio nonmetropolitan area (noncontiguous) | 590 | 1.80 | 1.24 | $ 34.36 | $ 71,470 |
| Kansas nonmetropolitan area | 540 | 1.39 | 0.95 | $ 33.81 | $ 70,330 |
| Southeast Coastal North Carolina nonmetropolitan area | 390 | 1.57 | 1.08 | $ 24.52 | $ 51,010 |
| West Northwestern Ohio nonmetropolitan area | 380 | 1.52 | 1.04 | $ 34.53 | $ 71,810 |
| North Texas Region of Texas nonmetropolitan area | 370 | 1.32 | 0.90 | $ 32.40 | $ 67,380 |
Nonmetropolitan areas with the highest concentration of jobs and location quotients in Cost Estimators:
| Nonmetropolitan area | Employment (1) | Employment per thousand jobs | Location quotient (9) | Hourly mean wage | Annual mean wage (2) |
|---|---|---|---|---|---|
| Northern Vermont nonmetropolitan area | 150 | 2.09 | 1.44 | $ 34.99 | $ 72,780 |
| Southeast-Central Idaho nonmetropolitan area | 200 | 2.09 | 1.44 | $ 34.71 | $ 72,200 |
| East South Dakota nonmetropolitan area | 270 | 2.07 | 1.42 | $ 33.45 | $ 69,580 |
| Northwest Virginia nonmetropolitan area | 130 | 2.03 | 1.40 | $ 29.69 | $ 61,760 |
| Southern Pennsylvania nonmetropolitan area | 360 | 1.93 | 1.33 | $ 34.14 | $ 71,000 |
Top paying nonmetropolitan areas for Cost Estimators:
| Nonmetropolitan area | Employment (1) | Employment per thousand jobs | Location quotient (9) | Hourly mean wage | Annual mean wage (2) |
|---|---|---|---|---|---|
| North Coast Region of California nonmetropolitan area | 100 | 0.91 | 0.63 | $ 44.08 | $ 91,690 |
| Northwest Illinois nonmetropolitan area | 180 | 1.39 | 0.95 | $ 41.40 | $ 86,120 |
| Connecticut nonmetropolitan area | 50 | 1.46 | 1.01 | $ 41.05 | $ 85,370 |
| Eastern Washington nonmetropolitan area | 100 | 0.99 | 0.68 | $ 40.96 | $ 85,190 |
| Massachusetts nonmetropolitan area | (8) | (8) | (8) | $ 40.22 | $ 83,660 |
These estimates are calculated with data collected from employers in all industry sectors, all metropolitan and nonmetropolitan areas, and all states and the District of Columbia. The top employment and wage figures are provided above. The complete list is available in the downloadable XLS files.
The percentile wage estimate is the value of a wage below which a certain percent of workers fall. The median wage is the 50th percentile wage estimate—50 percent of workers earn less than the median and 50 percent of workers earn more than the median. More about percentile wages.
(1) Estimates for detailed occupations do not sum to the totals because the totals include occupations not shown separately. Estimates do not include self-employed workers.
(2) Annual wages have been calculated by multiplying the hourly mean wage by a "year-round, full-time" hours figure of 2,080 hours; for those occupations where there is not an hourly wage published, the annual wage has been directly calculated from the reported survey data.
(3) The relative standard error (RSE) is a measure of the reliability of a survey statistic. The smaller the relative standard error, the more precise the estimate.
(8) Estimate not released.
(9) The location quotient is the ratio of the area concentration of occupational employment to the national average concentration. A location quotient greater than one indicates the occupation has a higher share of employment than average, and a location quotient less than one indicates the occupation is less prevalent in the area than average.
Other OEWS estimates and related information:
May 2023 National Occupational Employment and Wage Estimates
May 2023 State Occupational Employment and Wage Estimates
May 2023 Metropolitan and Nonmetropolitan Area Occupational Employment and Wage Estimates
May 2023 National Industry-Specific Occupational Employment and Wage Estimates
Last Modified Date: April 3, 2024