
An official website of the United States government
An official website of the United States government
The .gov means it's official.
Federal government websites often end in .gov or .mil. Before sharing sensitive information,
make sure you're on a federal government site.
The site is secure.
The
https:// ensures that you are connecting to the official website and that any
information you provide is encrypted and transmitted securely.
All engineers not listed separately. Excludes �Sales Engineers� (41-9031), �Locomotive Engineers� (53-4011), and �Ship Engineers� (53-5031).
Employment estimate and mean wage estimates for Engineers, All Other:
| Employment (1) | Employment RSE (3) |
Mean hourly wage |
Mean annual wage (2) |
Wage RSE (3) |
|---|---|---|---|---|
| 150,990 | 1.3 % | $ 56.90 | $ 118,350 | 0.5 % |
Percentile wage estimates for Engineers, All Other:
| Percentile | 10% | 25% | 50% (Median) |
75% | 90% |
|---|---|---|---|---|---|
| Hourly Wage | $ 29.87 | $ 40.03 | $ 53.83 | $ 70.22 | $ 85.10 |
| Annual Wage (2) | $ 62,130 | $ 83,250 | $ 111,970 | $ 146,060 | $ 177,020 |
Industries with the highest published employment and wages for Engineers, All Other are provided. For a list of all industries with employment in Engineers, All Other, see the Create Customized Tables function.
Industries with the highest levels of employment in Engineers, All Other:
| Industry | Employment (1) | Percent of industry employment | Hourly mean wage | Annual mean wage (2) |
|---|---|---|---|---|
| Federal, State, and Local Government, excluding State and Local Government Schools and Hospitals and the U.S. Postal Service (OEWS Designation) | 33,530 | 1.57 | $ 64.35 | $ 133,850 |
| Architectural, Engineering, and Related Services | 17,010 | 1.03 | $ 51.62 | $ 107,360 |
| Scientific Research and Development Services | 9,480 | 1.03 | $ 64.45 | $ 134,050 |
| Aerospace Product and Parts Manufacturing | 6,890 | 1.35 | $ 57.14 | $ 118,860 |
| Management of Companies and Enterprises | 6,030 | 0.22 | $ 56.33 | $ 117,160 |
Industries with the highest concentration of employment in Engineers, All Other:
| Industry | Employment (1) | Percent of industry employment | Hourly mean wage | Annual mean wage (2) |
|---|---|---|---|---|
| Federal, State, and Local Government, excluding State and Local Government Schools and Hospitals and the U.S. Postal Service (OEWS Designation) | 33,530 | 1.57 | $ 64.35 | $ 133,850 |
| Aerospace Product and Parts Manufacturing | 6,890 | 1.35 | $ 57.14 | $ 118,860 |
| Commercial and Service Industry Machinery Manufacturing | 1,090 | 1.21 | $ 52.08 | $ 108,330 |
| Navigational, Measuring, Electromedical, and Control Instruments Manufacturing | 4,780 | 1.13 | $ 61.09 | $ 127,070 |
| Communications Equipment Manufacturing | 880 | 1.05 | $ 58.11 | $ 120,860 |
Top paying industries for Engineers, All Other:
| Industry | Employment (1) | Percent of industry employment | Hourly mean wage | Annual mean wage (2) |
|---|---|---|---|---|
| Web Search Portals, Libraries, Archives, and Other Information Services | 550 | 0.30 | $ 94.16 | $ 195,860 |
| Software Publishers | 720 | 0.11 | $ 80.59 | $ 167,640 |
| Scheduled Air Transportation | 30 | 0.01 | $ 69.34 | $ 144,220 |
| Manufacturing and Reproducing Magnetic and Optical Media | 30 | 0.29 | $ 68.25 | $ 141,960 |
| Water, Sewage and Other Systems | 40 | 0.07 | $ 65.14 | $ 135,500 |
States and areas with the highest published employment, location quotients, and wages for Engineers, All Other are provided. For a list of all areas with employment in Engineers, All Other, see the Create Customized Tables function.
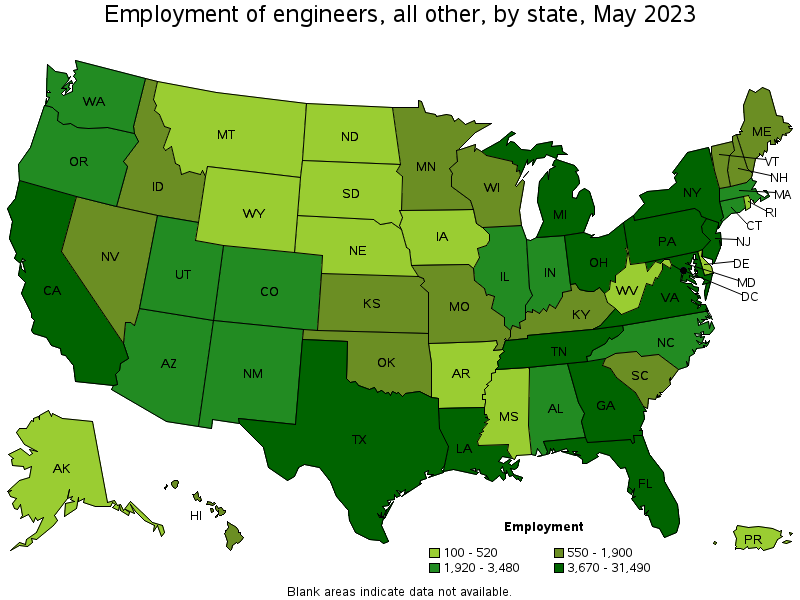
States with the highest employment level in Engineers, All Other:
| State | Employment (1) | Employment per thousand jobs | Location quotient (9) | Hourly mean wage | Annual mean wage (2) |
|---|---|---|---|---|---|
| California | 31,490 | 1.75 | 1.77 | $ 65.40 | $ 136,040 |
| Texas | 8,200 | 0.61 | 0.61 | $ 56.13 | $ 116,750 |
| Florida | 8,080 | 0.84 | 0.85 | $ 49.28 | $ 102,500 |
| Louisiana | 6,950 | 3.75 | 3.77 | $ 49.48 | $ 102,920 |
| Ohio | 6,530 | 1.19 | 1.20 | $ 54.86 | $ 114,110 |
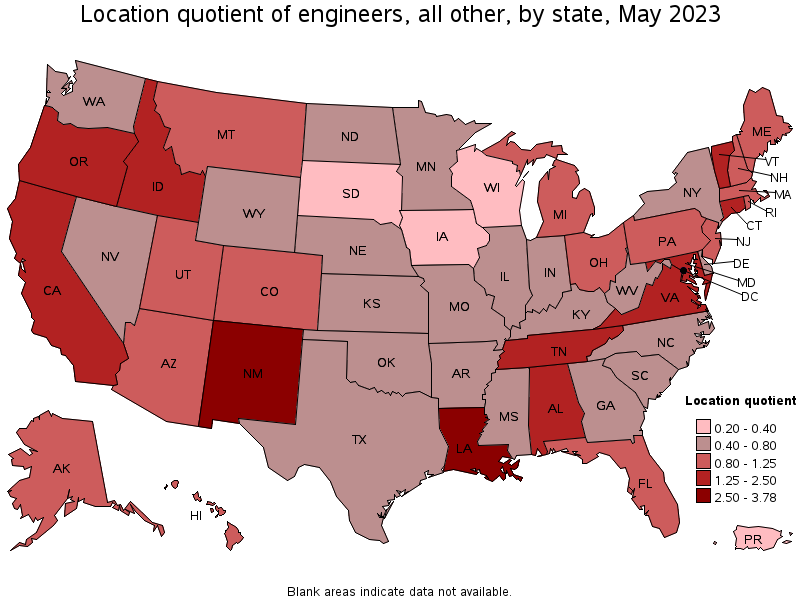
States with the highest concentration of jobs and location quotients in Engineers, All Other:
| State | Employment (1) | Employment per thousand jobs | Location quotient (9) | Hourly mean wage | Annual mean wage (2) |
|---|---|---|---|---|---|
| District of Columbia | 2,640 | 3.76 | 3.78 | $ 72.74 | $ 151,300 |
| Louisiana | 6,950 | 3.75 | 3.77 | $ 49.48 | $ 102,920 |
| New Mexico | 2,180 | 2.58 | 2.59 | $ 64.49 | $ 134,140 |
| Maryland | 6,240 | 2.33 | 2.34 | $ 59.82 | $ 124,420 |
| Vermont | 550 | 1.81 | 1.83 | $ 53.65 | $ 111,590 |
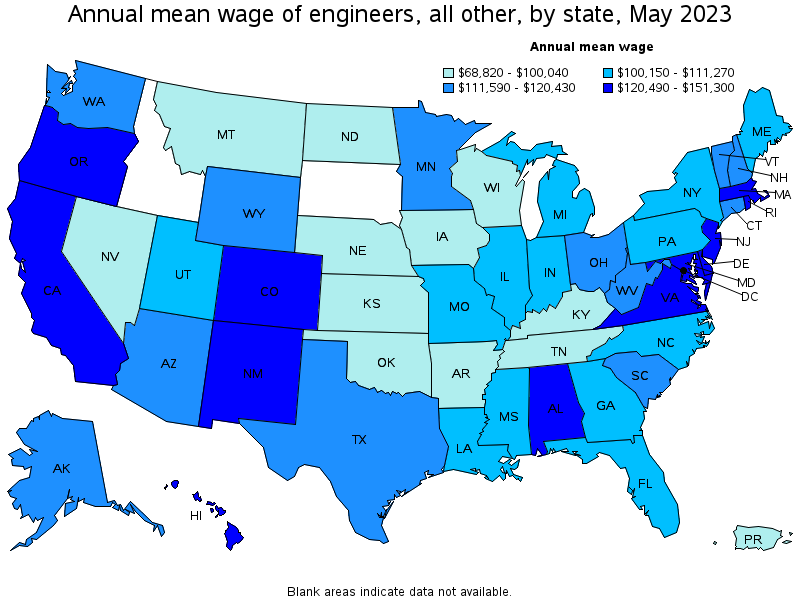
Top paying states for Engineers, All Other:
| State | Employment (1) | Employment per thousand jobs | Location quotient (9) | Hourly mean wage | Annual mean wage (2) |
|---|---|---|---|---|---|
| District of Columbia | 2,640 | 3.76 | 3.78 | $ 72.74 | $ 151,300 |
| Alabama | 3,480 | 1.70 | 1.71 | $ 65.55 | $ 136,340 |
| California | 31,490 | 1.75 | 1.77 | $ 65.40 | $ 136,040 |
| New Mexico | 2,180 | 2.58 | 2.59 | $ 64.49 | $ 134,140 |
| Rhode Island | 480 | 0.98 | 0.98 | $ 64.39 | $ 133,920 |
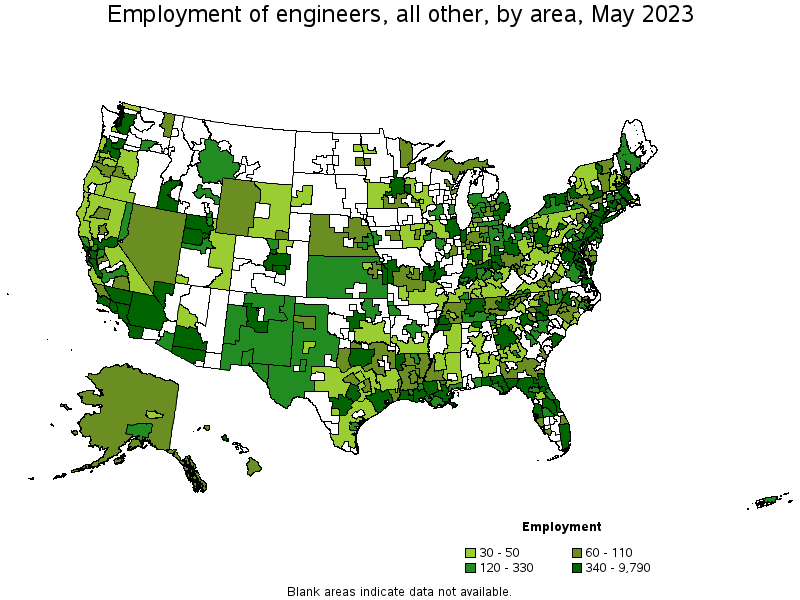
Metropolitan areas with the highest employment level in Engineers, All Other:
| Metropolitan area | Employment (1) | Employment per thousand jobs | Location quotient (9) | Hourly mean wage | Annual mean wage (2) |
|---|---|---|---|---|---|
| Los Angeles-Long Beach-Anaheim, CA | 9,790 | 1.58 | 1.59 | $ 60.21 | $ 125,240 |
| Washington-Arlington-Alexandria, DC-VA-MD-WV | 8,190 | 2.65 | 2.66 | $ 69.19 | $ 143,910 |
| San Francisco-Oakland-Hayward, CA | 6,410 | 2.65 | 2.66 | $ 81.17 | $ 168,830 |
| New York-Newark-Jersey City, NY-NJ-PA | 5,460 | 0.58 | 0.58 | $ 56.68 | $ 117,880 |
| San Jose-Sunnyvale-Santa Clara, CA | 4,520 | 3.95 | 3.98 | $ 73.81 | $ 153,530 |
| San Diego-Carlsbad, CA | 3,810 | 2.50 | 2.52 | $ 59.73 | $ 124,230 |
| Detroit-Warren-Dearborn, MI | 3,210 | 1.69 | 1.70 | $ 50.18 | $ 104,380 |
| Huntsville, AL | 3,190 | 12.72 | 12.80 | $ 66.62 | $ 138,570 |
| Boston-Cambridge-Nashua, MA-NH | 2,960 | 1.07 | 1.08 | $ 60.40 | $ 125,630 |
| Houston-The Woodlands-Sugar Land, TX | 2,750 | 0.86 | 0.87 | $ 60.96 | $ 126,800 |
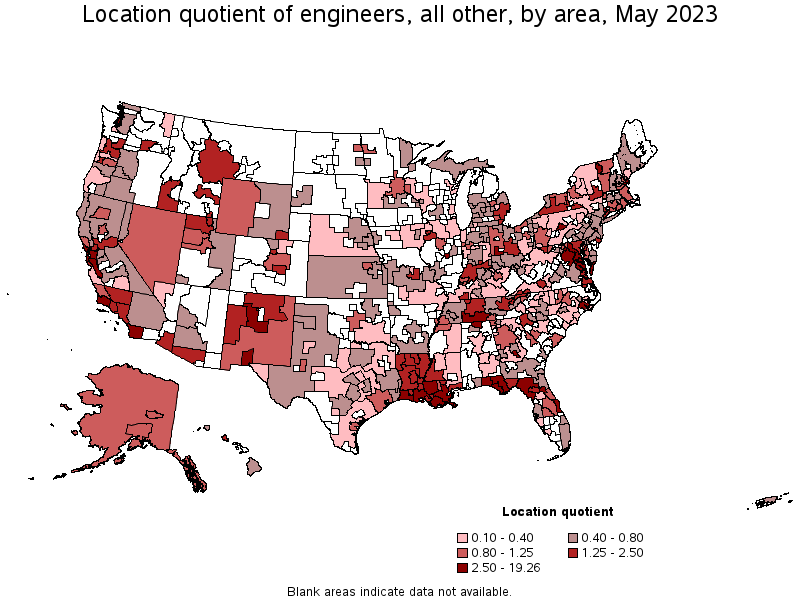
Metropolitan areas with the highest concentration of jobs and location quotients in Engineers, All Other:
| Metropolitan area | Employment (1) | Employment per thousand jobs | Location quotient (9) | Hourly mean wage | Annual mean wage (2) |
|---|---|---|---|---|---|
| California-Lexington Park, MD | 900 | 19.15 | 19.26 | $ 66.12 | $ 137,530 |
| Lake Charles, LA | 1,210 | 13.28 | 13.35 | $ 50.61 | $ 105,270 |
| Huntsville, AL | 3,190 | 12.72 | 12.80 | $ 66.62 | $ 138,570 |
| State College, PA | 770 | 11.36 | 11.43 | $ 48.91 | $ 101,740 |
| Crestview-Fort Walton Beach-Destin, FL | 810 | 6.64 | 6.68 | $ 61.56 | $ 128,040 |
| Portsmouth, NH-ME | 470 | 5.06 | 5.09 | $ 53.70 | $ 111,700 |
| Dayton, OH | 1,710 | 4.66 | 4.68 | $ 60.93 | $ 126,740 |
| Baton Rouge, LA | 1,790 | 4.62 | 4.65 | $ 50.34 | $ 104,710 |
| Decatur, IL | 210 | 4.59 | 4.62 | $ 53.70 | $ 111,690 |
| Palm Bay-Melbourne-Titusville, FL | 1,070 | 4.53 | 4.55 | $ 61.24 | $ 127,380 |
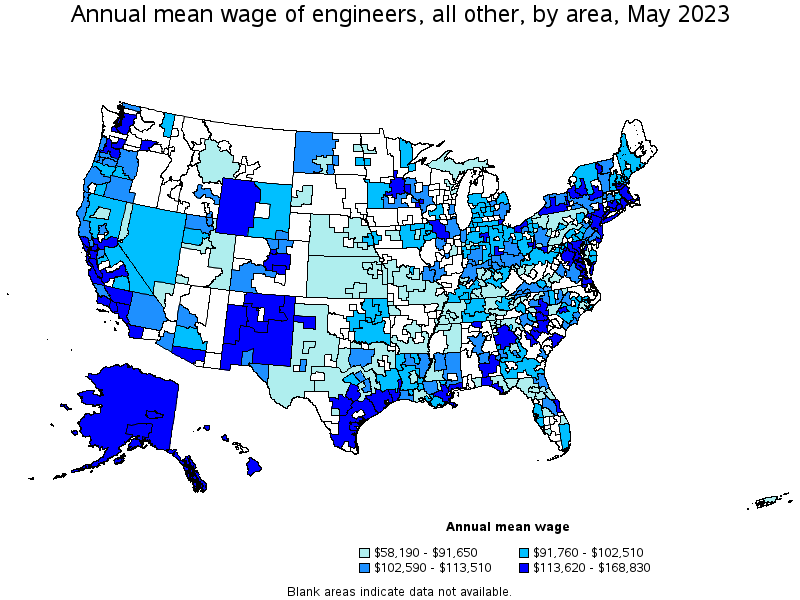
Top paying metropolitan areas for Engineers, All Other:
| Metropolitan area | Employment (1) | Employment per thousand jobs | Location quotient (9) | Hourly mean wage | Annual mean wage (2) |
|---|---|---|---|---|---|
| San Francisco-Oakland-Hayward, CA | 6,410 | 2.65 | 2.66 | $ 81.17 | $ 168,830 |
| San Jose-Sunnyvale-Santa Clara, CA | 4,520 | 3.95 | 3.98 | $ 73.81 | $ 153,530 |
| Corpus Christi, TX | 150 | 0.81 | 0.82 | $ 69.64 | $ 144,860 |
| Washington-Arlington-Alexandria, DC-VA-MD-WV | 8,190 | 2.65 | 2.66 | $ 69.19 | $ 143,910 |
| Huntsville, AL | 3,190 | 12.72 | 12.80 | $ 66.62 | $ 138,570 |
| Santa Maria-Santa Barbara, CA | 580 | 2.86 | 2.88 | $ 66.22 | $ 137,730 |
| California-Lexington Park, MD | 900 | 19.15 | 19.26 | $ 66.12 | $ 137,530 |
| Albuquerque, NM | 1,500 | 3.79 | 3.81 | $ 65.15 | $ 135,510 |
| Manchester, NH | 60 | 0.53 | 0.54 | $ 64.90 | $ 134,980 |
| Santa Cruz-Watsonville, CA | 160 | 1.67 | 1.68 | $ 64.71 | $ 134,600 |
Nonmetropolitan areas with the highest employment in Engineers, All Other:
| Nonmetropolitan area | Employment (1) | Employment per thousand jobs | Location quotient (9) | Hourly mean wage | Annual mean wage (2) |
|---|---|---|---|---|---|
| Northeast Virginia nonmetropolitan area | 750 | 14.98 | 15.06 | $ 64.56 | $ 134,280 |
| Southern Indiana nonmetropolitan area | 400 | 2.16 | 2.17 | $ 54.46 | $ 113,280 |
| North Florida nonmetropolitan area | 360 | 2.96 | 2.97 | $ 31.44 | $ 65,400 |
| South Central Tennessee nonmetropolitan area | 330 | 2.95 | 2.97 | $ 46.89 | $ 97,530 |
| West Northwestern Ohio nonmetropolitan area | 260 | 1.04 | 1.05 | $ 45.63 | $ 94,900 |
Nonmetropolitan areas with the highest concentration of jobs and location quotients in Engineers, All Other:
| Nonmetropolitan area | Employment (1) | Employment per thousand jobs | Location quotient (9) | Hourly mean wage | Annual mean wage (2) |
|---|---|---|---|---|---|
| Northeast Virginia nonmetropolitan area | 750 | 14.98 | 15.06 | $ 64.56 | $ 134,280 |
| North Florida nonmetropolitan area | 360 | 2.96 | 2.97 | $ 31.44 | $ 65,400 |
| South Central Tennessee nonmetropolitan area | 330 | 2.95 | 2.97 | $ 46.89 | $ 97,530 |
| Southwest Louisiana nonmetropolitan area | 150 | 2.20 | 2.22 | $ 46.26 | $ 96,220 |
| Southern Indiana nonmetropolitan area | 400 | 2.16 | 2.17 | $ 54.46 | $ 113,280 |
Top paying nonmetropolitan areas for Engineers, All Other:
| Nonmetropolitan area | Employment (1) | Employment per thousand jobs | Location quotient (9) | Hourly mean wage | Annual mean wage (2) |
|---|---|---|---|---|---|
| Northern New Mexico nonmetropolitan area | 140 | 1.71 | 1.72 | $ 72.39 | $ 150,560 |
| Hawaii / Kauai nonmetropolitan area | 60 | 0.60 | 0.61 | $ 67.32 | $ 140,020 |
| Coastal Plains Region of Texas nonmetropolitan area | 40 | 0.26 | 0.26 | $ 66.31 | $ 137,930 |
| Northeast Virginia nonmetropolitan area | 750 | 14.98 | 15.06 | $ 64.56 | $ 134,280 |
| Western Wyoming nonmetropolitan area | 90 | 0.94 | 0.94 | $ 62.14 | $ 129,240 |
These estimates are calculated with data collected from employers in all industry sectors, all metropolitan and nonmetropolitan areas, and all states and the District of Columbia. The top employment and wage figures are provided above. The complete list is available in the downloadable XLS files.
The percentile wage estimate is the value of a wage below which a certain percent of workers fall. The median wage is the 50th percentile wage estimate—50 percent of workers earn less than the median and 50 percent of workers earn more than the median. More about percentile wages.
(1) Estimates for detailed occupations do not sum to the totals because the totals include occupations not shown separately. Estimates do not include self-employed workers.
(2) Annual wages have been calculated by multiplying the hourly mean wage by a "year-round, full-time" hours figure of 2,080 hours; for those occupations where there is not an hourly wage published, the annual wage has been directly calculated from the reported survey data.
(3) The relative standard error (RSE) is a measure of the reliability of a survey statistic. The smaller the relative standard error, the more precise the estimate.
(9) The location quotient is the ratio of the area concentration of occupational employment to the national average concentration. A location quotient greater than one indicates the occupation has a higher share of employment than average, and a location quotient less than one indicates the occupation is less prevalent in the area than average.
Other OEWS estimates and related information:
May 2023 National Occupational Employment and Wage Estimates
May 2023 State Occupational Employment and Wage Estimates
May 2023 Metropolitan and Nonmetropolitan Area Occupational Employment and Wage Estimates
May 2023 National Industry-Specific Occupational Employment and Wage Estimates
Last Modified Date: April 3, 2024