
An official website of the United States government
An official website of the United States government
The .gov means it's official.
Federal government websites often end in .gov or .mil. Before sharing sensitive information,
make sure you're on a federal government site.
The site is secure.
The
https:// ensures that you are connecting to the official website and that any
information you provide is encrypted and transmitted securely.
Collect, identify, classify, and analyze physical evidence related to criminal investigations. Perform tests on weapons or substances, such as fiber, hair, and tissue to determine significance to investigation. May testify as expert witnesses on evidence or crime laboratory techniques. May serve as specialists in area of expertise, such as ballistics, fingerprinting, handwriting, or biochemistry.
Employment estimate and mean wage estimates for Forensic Science Technicians:
| Employment (1) | Employment RSE (3) |
Mean hourly wage |
Mean annual wage (2) |
Wage RSE (3) |
|---|---|---|---|---|
| 17,520 | 1.6 % | $ 34.40 | $ 71,540 | 0.6 % |
Percentile wage estimates for Forensic Science Technicians:
| Percentile | 10% | 25% | 50% (Median) |
75% | 90% |
|---|---|---|---|---|---|
| Hourly Wage | $ 19.91 | $ 24.27 | $ 31.22 | $ 40.73 | $ 51.68 |
| Annual Wage (2) | $ 41,410 | $ 50,480 | $ 64,940 | $ 84,720 | $ 107,490 |
Industries with the highest published employment and wages for Forensic Science Technicians are provided. For a list of all industries with employment in Forensic Science Technicians, see the Create Customized Tables function.
Industries with the highest levels of employment in Forensic Science Technicians:
| Industry | Employment (1) | Percent of industry employment | Hourly mean wage | Annual mean wage (2) |
|---|---|---|---|---|
| Local Government, excluding Schools and Hospitals (OEWS Designation) | 10,770 | 0.20 | $ 35.51 | $ 73,860 |
| State Government, excluding Schools and Hospitals (OEWS Designation) | 4,610 | 0.22 | $ 33.43 | $ 69,540 |
| Architectural, Engineering, and Related Services | 630 | 0.04 | $ 30.85 | $ 64,160 |
| Colleges, Universities, and Professional Schools | 490 | 0.02 | $ 26.15 | $ 54,380 |
| Medical and Diagnostic Laboratories | 300 | 0.09 | $ 23.78 | $ 49,460 |
Industries with the highest concentration of employment in Forensic Science Technicians:
| Industry | Employment (1) | Percent of industry employment | Hourly mean wage | Annual mean wage (2) |
|---|---|---|---|---|
| State Government, excluding Schools and Hospitals (OEWS Designation) | 4,610 | 0.22 | $ 33.43 | $ 69,540 |
| Local Government, excluding Schools and Hospitals (OEWS Designation) | 10,770 | 0.20 | $ 35.51 | $ 73,860 |
| Medical and Diagnostic Laboratories | 300 | 0.09 | $ 23.78 | $ 49,460 |
| Architectural, Engineering, and Related Services | 630 | 0.04 | $ 30.85 | $ 64,160 |
| Colleges, Universities, and Professional Schools | 490 | 0.02 | $ 26.15 | $ 54,380 |
Top paying industries for Forensic Science Technicians:
| Industry | Employment (1) | Percent of industry employment | Hourly mean wage | Annual mean wage (2) |
|---|---|---|---|---|
| Federal, State, and Local Government, excluding State and Local Government Schools and Hospitals and the U.S. Postal Service (OEWS Designation) | 110 | 0.01 | $ 57.52 | $ 119,630 |
| Management, Scientific, and Technical Consulting Services | (8) | (8) | $ 46.65 | $ 97,040 |
| Agencies, Brokerages, and Other Insurance Related Activities | 130 | 0.01 | $ 36.75 | $ 76,440 |
| Local Government, excluding Schools and Hospitals (OEWS Designation) | 10,770 | 0.20 | $ 35.51 | $ 73,860 |
| State Government, excluding Schools and Hospitals (OEWS Designation) | 4,610 | 0.22 | $ 33.43 | $ 69,540 |
States and areas with the highest published employment, location quotients, and wages for Forensic Science Technicians are provided. For a list of all areas with employment in Forensic Science Technicians, see the Create Customized Tables function.
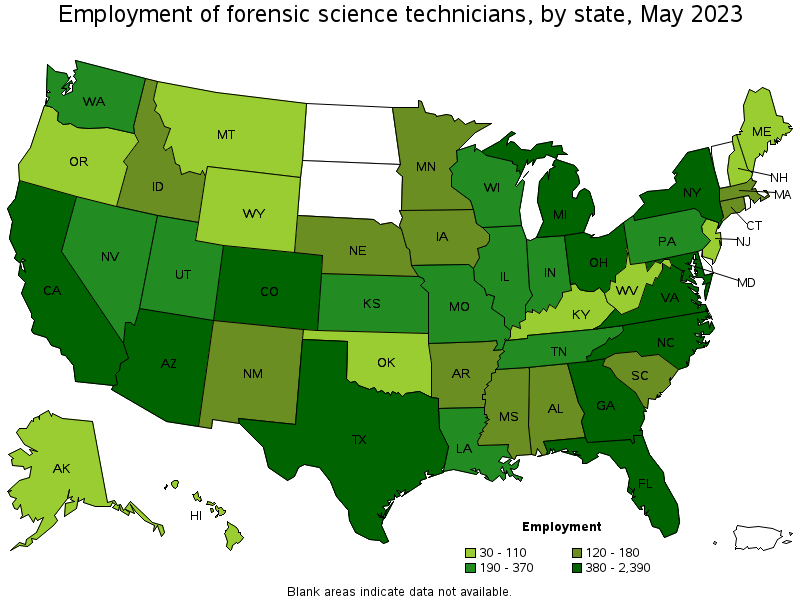
States with the highest employment level in Forensic Science Technicians:
| State | Employment (1) | Employment per thousand jobs | Location quotient (9) | Hourly mean wage | Annual mean wage (2) |
|---|---|---|---|---|---|
| California | 2,390 | 0.13 | 1.15 | $ 47.31 | $ 98,400 |
| Texas | 2,220 | 0.16 | 1.42 | $ 28.76 | $ 59,830 |
| Florida | 2,030 | 0.21 | 1.84 | $ 29.60 | $ 61,570 |
| Arizona | 860 | 0.28 | 2.39 | $ 33.49 | $ 69,660 |
| Virginia | 700 | 0.17 | 1.52 | $ 34.84 | $ 72,460 |
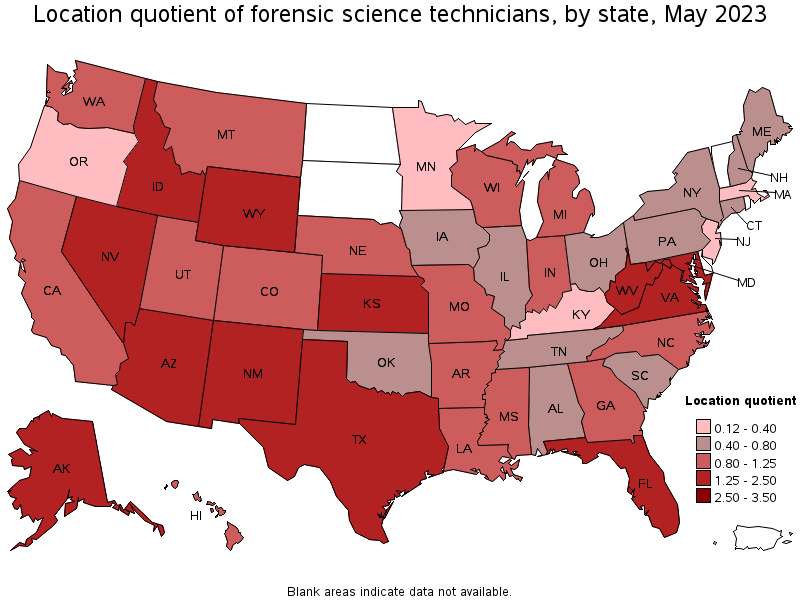
States with the highest concentration of jobs and location quotients in Forensic Science Technicians:
| State | Employment (1) | Employment per thousand jobs | Location quotient (9) | Hourly mean wage | Annual mean wage (2) |
|---|---|---|---|---|---|
| Arizona | 860 | 0.28 | 2.39 | $ 33.49 | $ 69,660 |
| Nevada | 330 | 0.22 | 1.90 | $ 37.11 | $ 77,180 |
| New Mexico | 180 | 0.22 | 1.87 | $ 28.39 | $ 59,040 |
| Florida | 2,030 | 0.21 | 1.84 | $ 29.60 | $ 61,570 |
| Wyoming | 50 | 0.18 | 1.56 | $ 29.82 | $ 62,030 |
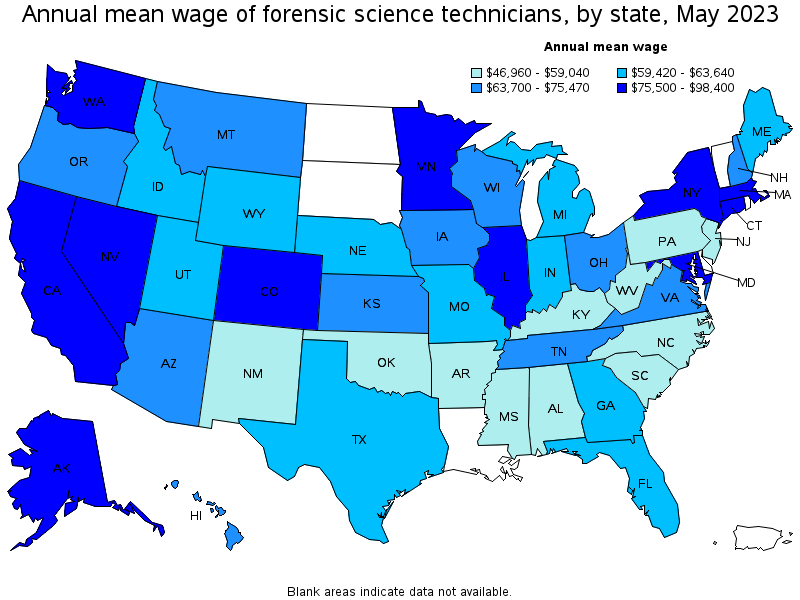
Top paying states for Forensic Science Technicians:
| State | Employment (1) | Employment per thousand jobs | Location quotient (9) | Hourly mean wage | Annual mean wage (2) |
|---|---|---|---|---|---|
| California | 2,390 | 0.13 | 1.15 | $ 47.31 | $ 98,400 |
| Illinois | 370 | 0.06 | 0.54 | $ 46.04 | $ 95,750 |
| Connecticut | 130 | 0.08 | 0.65 | $ 39.72 | $ 82,620 |
| New York | 590 | 0.06 | 0.55 | $ 39.72 | $ 82,610 |
| Massachusetts | 120 | 0.03 | 0.28 | $ 39.68 | $ 82,520 |
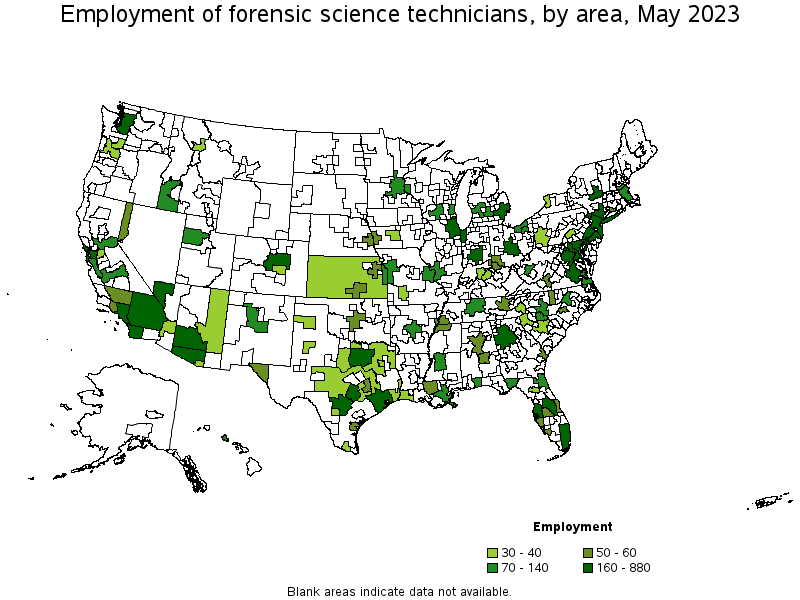
Metropolitan areas with the highest employment level in Forensic Science Technicians:
| Metropolitan area | Employment (1) | Employment per thousand jobs | Location quotient (9) | Hourly mean wage | Annual mean wage (2) |
|---|---|---|---|---|---|
| Los Angeles-Long Beach-Anaheim, CA | 880 | 0.14 | 1.23 | $ 52.40 | $ 109,000 |
| Houston-The Woodlands-Sugar Land, TX | 610 | 0.19 | 1.67 | $ 32.66 | $ 67,940 |
| Phoenix-Mesa-Scottsdale, AZ | 600 | 0.26 | 2.28 | $ 35.22 | $ 73,250 |
| Washington-Arlington-Alexandria, DC-VA-MD-WV | 580 | 0.19 | 1.64 | $ 41.31 | $ 85,930 |
| Miami-Fort Lauderdale-West Palm Beach, FL | 510 | 0.19 | 1.62 | $ 39.22 | $ 81,570 |
| Dallas-Fort Worth-Arlington, TX | 500 | 0.13 | 1.10 | $ 29.88 | $ 62,140 |
| Tampa-St. Petersburg-Clearwater, FL | 490 | 0.35 | 3.02 | $ 28.35 | $ 58,970 |
| Atlanta-Sandy Springs-Roswell, GA | 370 | 0.13 | 1.15 | $ 29.66 | $ 61,700 |
| New York-Newark-Jersey City, NY-NJ-PA | 350 | 0.04 | 0.32 | $ 41.31 | $ 85,920 |
| Austin-Round Rock, TX | 330 | 0.27 | 2.30 | $ 28.41 | $ 59,100 |
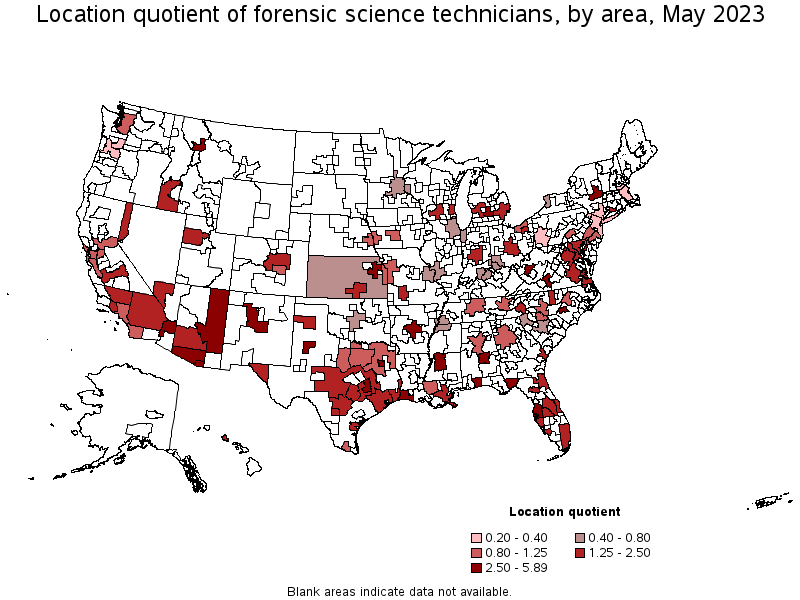
Metropolitan areas with the highest concentration of jobs and location quotients in Forensic Science Technicians:
| Metropolitan area | Employment (1) | Employment per thousand jobs | Location quotient (9) | Hourly mean wage | Annual mean wage (2) |
|---|---|---|---|---|---|
| Charleston, WV | 70 | 0.68 | 5.89 | $ 28.30 | $ 58,870 |
| Tallahassee, FL | 110 | 0.63 | 5.46 | $ 24.98 | $ 51,950 |
| Missoula, MT | 40 | 0.56 | 4.85 | $ 36.04 | $ 74,970 |
| Topeka, KS | 50 | 0.48 | 4.12 | $ 36.73 | $ 76,400 |
| Pensacola-Ferry Pass-Brent, FL | 80 | 0.46 | 3.97 | $ 25.37 | $ 52,760 |
| Lansing-East Lansing, MI | 100 | 0.46 | 3.96 | $ 36.45 | $ 75,810 |
| College Station-Bryan, TX | 60 | 0.43 | 3.72 | $ 27.34 | $ 56,870 |
| Tucson, AZ | 160 | 0.41 | 3.51 | $ 30.64 | $ 63,740 |
| Albany-Schenectady-Troy, NY | 170 | 0.38 | 3.32 | $ 37.85 | $ 78,740 |
| Little Rock-North Little Rock-Conway, AR | 130 | 0.38 | 3.26 | $ 22.76 | $ 47,330 |
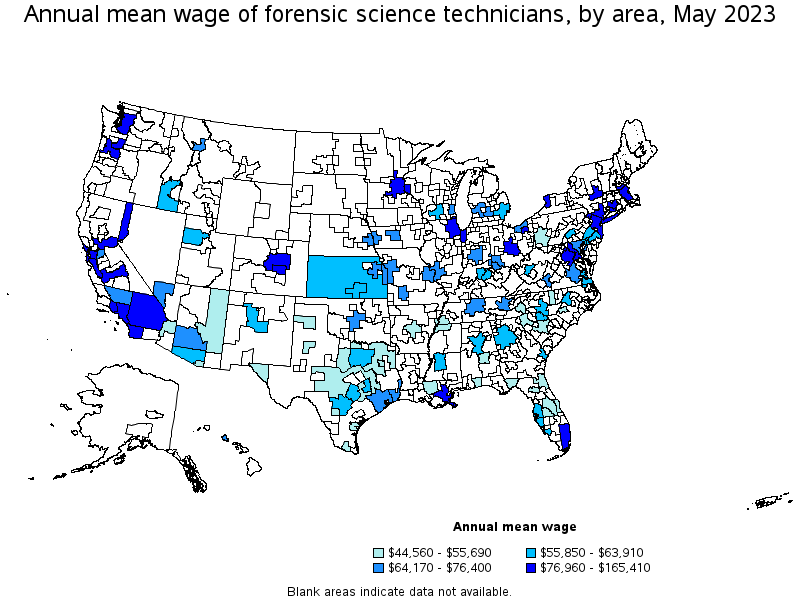
Top paying metropolitan areas for Forensic Science Technicians:
| Metropolitan area | Employment (1) | Employment per thousand jobs | Location quotient (9) | Hourly mean wage | Annual mean wage (2) |
|---|---|---|---|---|---|
| New Orleans-Metairie, LA | 90 | 0.18 | 1.58 | $ 79.52 | $ 165,410 |
| San Jose-Sunnyvale-Santa Clara, CA | 130 | 0.11 | 0.97 | $ 57.44 | $ 119,460 |
| Los Angeles-Long Beach-Anaheim, CA | 880 | 0.14 | 1.23 | $ 52.40 | $ 109,000 |
| San Francisco-Oakland-Hayward, CA | 320 | 0.13 | 1.13 | $ 49.38 | $ 102,710 |
| Oxnard-Thousand Oaks-Ventura, CA | 50 | 0.16 | 1.37 | $ 48.73 | $ 101,350 |
| Sacramento--Roseville--Arden-Arcade, CA | 140 | 0.13 | 1.16 | $ 47.19 | $ 98,150 |
| San Diego-Carlsbad, CA | 210 | 0.13 | 1.17 | $ 45.78 | $ 95,230 |
| Reno, NV | 60 | 0.23 | 1.99 | $ 45.08 | $ 93,760 |
| Chicago-Naperville-Elgin, IL-IN-WI | 270 | 0.06 | 0.51 | $ 43.80 | $ 91,110 |
| New Haven, CT | 60 | 0.22 | 1.94 | $ 42.67 | $ 88,740 |
Nonmetropolitan areas with the highest employment in Forensic Science Technicians:
| Nonmetropolitan area | Employment (1) | Employment per thousand jobs | Location quotient (9) | Hourly mean wage | Annual mean wage (2) |
|---|---|---|---|---|---|
| Arizona nonmetropolitan area | 30 | 0.36 | 3.12 | $ 23.83 | $ 49,570 |
| North Texas Region of Texas nonmetropolitan area | 30 | 0.11 | 0.99 | $ 21.42 | $ 44,560 |
| Kansas nonmetropolitan area | 30 | 0.08 | 0.70 | $ 27.03 | $ 56,230 |
| Hill Country Region of Texas nonmetropolitan area | 30 | 0.15 | 1.34 | $ 22.15 | $ 46,060 |
Nonmetropolitan areas with the highest concentration of jobs and location quotients in Forensic Science Technicians:
| Nonmetropolitan area | Employment (1) | Employment per thousand jobs | Location quotient (9) | Hourly mean wage | Annual mean wage (2) |
|---|---|---|---|---|---|
| Arizona nonmetropolitan area | 30 | 0.36 | 3.12 | $ 23.83 | $ 49,570 |
| Hill Country Region of Texas nonmetropolitan area | 30 | 0.15 | 1.34 | $ 22.15 | $ 46,060 |
| North Texas Region of Texas nonmetropolitan area | 30 | 0.11 | 0.99 | $ 21.42 | $ 44,560 |
| Kansas nonmetropolitan area | 30 | 0.08 | 0.70 | $ 27.03 | $ 56,230 |
Top paying nonmetropolitan areas for Forensic Science Technicians:
| Nonmetropolitan area | Employment (1) | Employment per thousand jobs | Location quotient (9) | Hourly mean wage | Annual mean wage (2) |
|---|---|---|---|---|---|
| Kansas nonmetropolitan area | 30 | 0.08 | 0.70 | $ 27.03 | $ 56,230 |
| Arizona nonmetropolitan area | 30 | 0.36 | 3.12 | $ 23.83 | $ 49,570 |
| Hill Country Region of Texas nonmetropolitan area | 30 | 0.15 | 1.34 | $ 22.15 | $ 46,060 |
| North Texas Region of Texas nonmetropolitan area | 30 | 0.11 | 0.99 | $ 21.42 | $ 44,560 |
These estimates are calculated with data collected from employers in all industry sectors, all metropolitan and nonmetropolitan areas, and all states and the District of Columbia. The top employment and wage figures are provided above. The complete list is available in the downloadable XLS files.
The percentile wage estimate is the value of a wage below which a certain percent of workers fall. The median wage is the 50th percentile wage estimate—50 percent of workers earn less than the median and 50 percent of workers earn more than the median. More about percentile wages.
(1) Estimates for detailed occupations do not sum to the totals because the totals include occupations not shown separately. Estimates do not include self-employed workers.
(2) Annual wages have been calculated by multiplying the hourly mean wage by a "year-round, full-time" hours figure of 2,080 hours; for those occupations where there is not an hourly wage published, the annual wage has been directly calculated from the reported survey data.
(3) The relative standard error (RSE) is a measure of the reliability of a survey statistic. The smaller the relative standard error, the more precise the estimate.
(8) Estimate not released.
(9) The location quotient is the ratio of the area concentration of occupational employment to the national average concentration. A location quotient greater than one indicates the occupation has a higher share of employment than average, and a location quotient less than one indicates the occupation is less prevalent in the area than average.
Other OEWS estimates and related information:
May 2023 National Occupational Employment and Wage Estimates
May 2023 State Occupational Employment and Wage Estimates
May 2023 Metropolitan and Nonmetropolitan Area Occupational Employment and Wage Estimates
May 2023 National Industry-Specific Occupational Employment and Wage Estimates
Last Modified Date: April 3, 2024