
An official website of the United States government
An official website of the United States government
The .gov means it's official.
Federal government websites often end in .gov or .mil. Before sharing sensitive information,
make sure you're on a federal government site.
The site is secure.
The
https:// ensures that you are connecting to the official website and that any
information you provide is encrypted and transmitted securely.
Design or create graphics to meet specific commercial or promotional needs, such as packaging, displays, or logos. May use a variety of mediums to achieve artistic or decorative effects. Excludes �Web and Digital Interface Designers� (15-1255).
Employment estimate and mean wage estimates for Graphic Designers:
| Employment (1) | Employment RSE (3) |
Mean hourly wage |
Mean annual wage (2) |
Wage RSE (3) |
|---|---|---|---|---|
| 212,720 | 0.7 % | $ 31.11 | $ 64,700 | 0.9 % |
Percentile wage estimates for Graphic Designers:
| Percentile | 10% | 25% | 50% (Median) |
75% | 90% |
|---|---|---|---|---|---|
| Hourly Wage | $ 17.51 | $ 21.90 | $ 28.32 | $ 37.30 | $ 48.29 |
| Annual Wage (2) | $ 36,420 | $ 45,560 | $ 58,910 | $ 77,570 | $ 100,450 |
Industries with the highest published employment and wages for Graphic Designers are provided. For a list of all industries with employment in Graphic Designers, see the Create Customized Tables function.
Industries with the highest levels of employment in Graphic Designers:
| Industry | Employment (1) | Percent of industry employment | Hourly mean wage | Annual mean wage (2) |
|---|---|---|---|---|
| Specialized Design Services | 24,500 | 15.81 | $ 32.75 | $ 68,110 |
| Advertising, Public Relations, and Related Services | 23,530 | 4.70 | $ 30.42 | $ 63,270 |
| Printing and Related Support Activities | 16,420 | 4.34 | $ 22.25 | $ 46,290 |
| Newspaper, Periodical, Book, and Directory Publishers | 11,100 | 3.80 | $ 25.82 | $ 53,700 |
| Management, Scientific, and Technical Consulting Services | 11,050 | 0.60 | $ 33.13 | $ 68,920 |
Industries with the highest concentration of employment in Graphic Designers:
| Industry | Employment (1) | Percent of industry employment | Hourly mean wage | Annual mean wage (2) |
|---|---|---|---|---|
| Specialized Design Services | 24,500 | 15.81 | $ 32.75 | $ 68,110 |
| Advertising, Public Relations, and Related Services | 23,530 | 4.70 | $ 30.42 | $ 63,270 |
| Printing and Related Support Activities | 16,420 | 4.34 | $ 22.25 | $ 46,290 |
| Newspaper, Periodical, Book, and Directory Publishers | 11,100 | 3.80 | $ 25.82 | $ 53,700 |
| Other Miscellaneous Manufacturing | 9,200 | 3.14 | $ 24.08 | $ 50,080 |
Top paying industries for Graphic Designers:
| Industry | Employment (1) | Percent of industry employment | Hourly mean wage | Annual mean wage (2) |
|---|---|---|---|---|
| Motion Picture and Video Industries | 3,350 | 0.83 | $ 49.17 | $ 102,260 |
| Child Care Services | 40 | (7) | $ 48.05 | $ 99,940 |
| Federal, State, and Local Government, excluding State and Local Government Schools and Hospitals and the U.S. Postal Service (OEWS Designation) | 1,520 | 0.07 | $ 46.17 | $ 96,030 |
| Aerospace Product and Parts Manufacturing | 180 | 0.04 | $ 45.09 | $ 93,800 |
| Facilities Support Services | 80 | 0.04 | $ 44.11 | $ 91,750 |
States and areas with the highest published employment, location quotients, and wages for Graphic Designers are provided. For a list of all areas with employment in Graphic Designers, see the Create Customized Tables function.
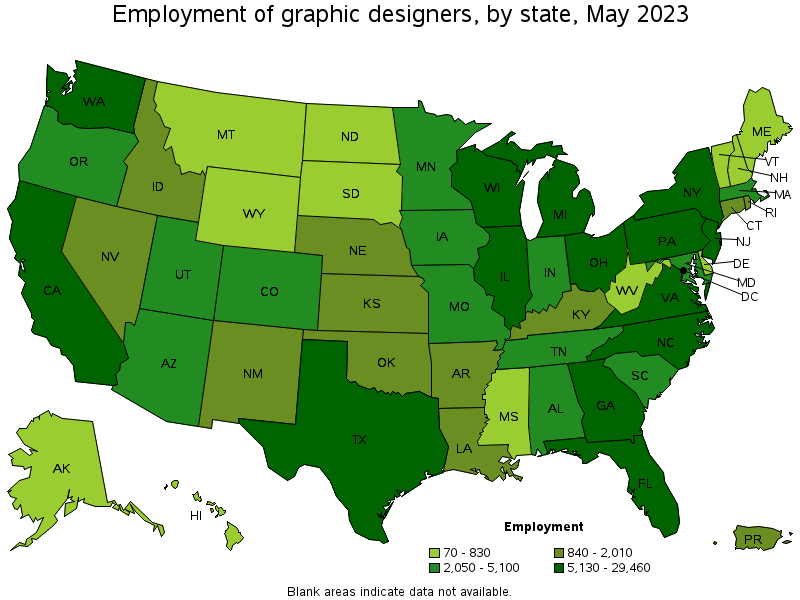
States with the highest employment level in Graphic Designers:
| State | Employment (1) | Employment per thousand jobs | Location quotient (9) | Hourly mean wage | Annual mean wage (2) |
|---|---|---|---|---|---|
| California | 29,460 | 1.64 | 1.17 | $ 38.39 | $ 79,850 |
| New York | 18,320 | 1.95 | 1.39 | $ 38.65 | $ 80,390 |
| Texas | 13,760 | 1.01 | 0.72 | $ 27.80 | $ 57,830 |
| Florida | 13,260 | 1.39 | 0.99 | $ 28.32 | $ 58,910 |
| Illinois | 9,550 | 1.59 | 1.13 | $ 28.99 | $ 60,300 |
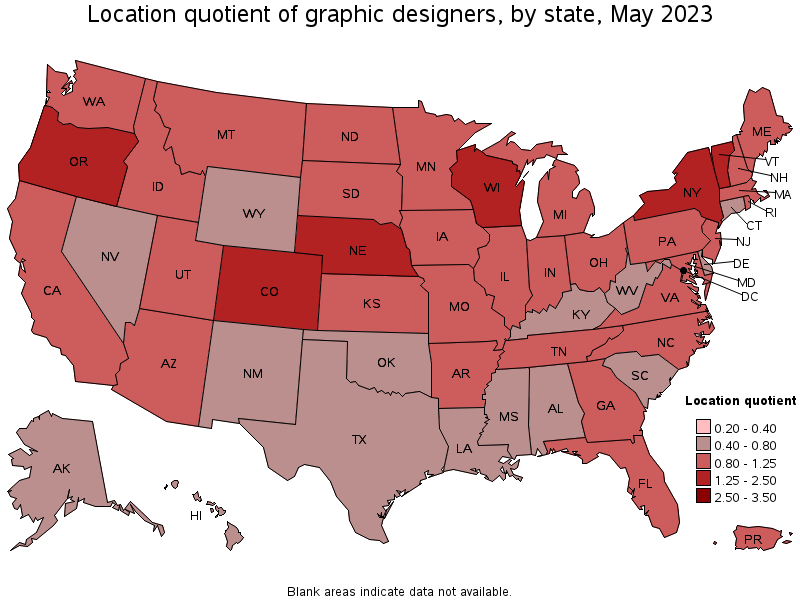
States with the highest concentration of jobs and location quotients in Graphic Designers:
| State | Employment (1) | Employment per thousand jobs | Location quotient (9) | Hourly mean wage | Annual mean wage (2) |
|---|---|---|---|---|---|
| District of Columbia | 1,600 | 2.28 | 1.63 | $ 44.74 | $ 93,050 |
| Oregon | 4,300 | 2.21 | 1.58 | $ 31.20 | $ 64,900 |
| Vermont | 650 | 2.16 | 1.54 | $ 31.79 | $ 66,110 |
| Nebraska | 2,010 | 2.00 | 1.43 | $ 25.43 | $ 52,890 |
| New York | 18,320 | 1.95 | 1.39 | $ 38.65 | $ 80,390 |
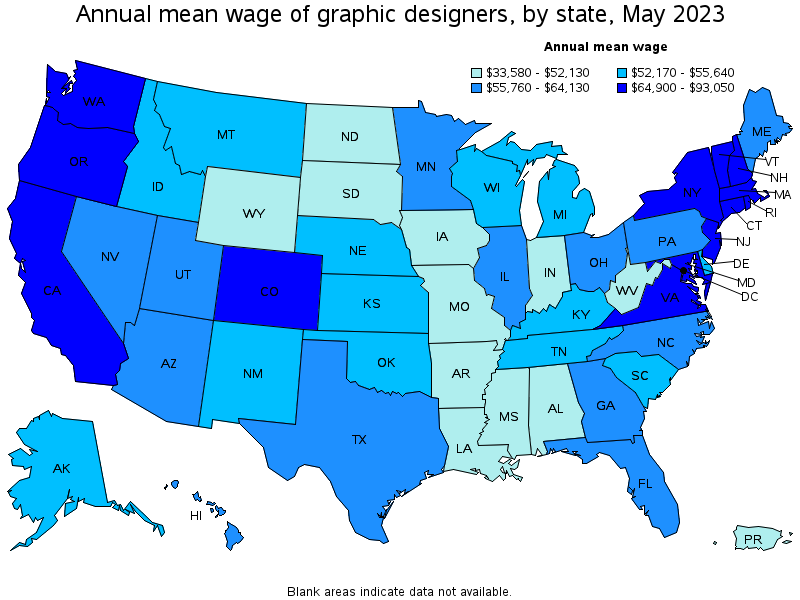
Top paying states for Graphic Designers:
| State | Employment (1) | Employment per thousand jobs | Location quotient (9) | Hourly mean wage | Annual mean wage (2) |
|---|---|---|---|---|---|
| District of Columbia | 1,600 | 2.28 | 1.63 | $ 44.74 | $ 93,050 |
| New York | 18,320 | 1.95 | 1.39 | $ 38.65 | $ 80,390 |
| California | 29,460 | 1.64 | 1.17 | $ 38.39 | $ 79,850 |
| Washington | 5,130 | 1.47 | 1.05 | $ 36.39 | $ 75,680 |
| Massachusetts | 4,930 | 1.35 | 0.97 | $ 35.81 | $ 74,490 |
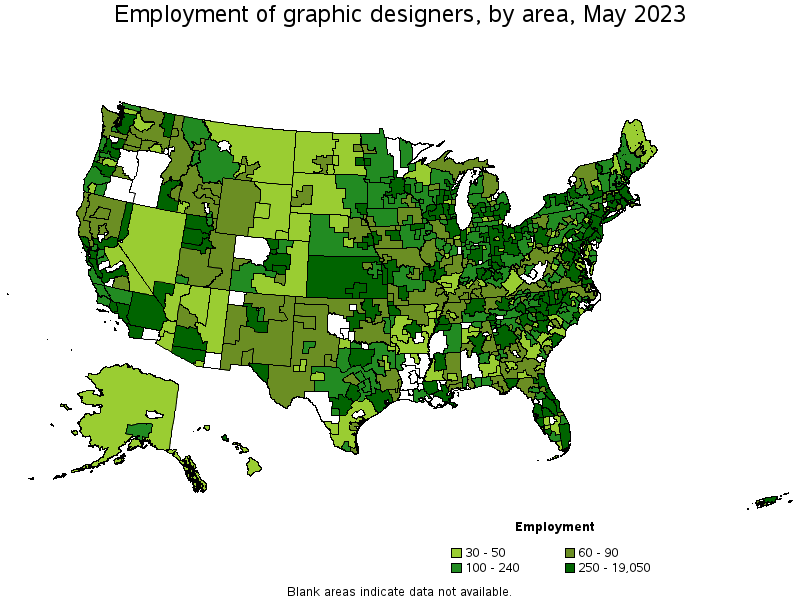
Metropolitan areas with the highest employment level in Graphic Designers:
| Metropolitan area | Employment (1) | Employment per thousand jobs | Location quotient (9) | Hourly mean wage | Annual mean wage (2) |
|---|---|---|---|---|---|
| New York-Newark-Jersey City, NY-NJ-PA | 19,050 | 2.01 | 1.43 | $ 39.28 | $ 81,710 |
| Los Angeles-Long Beach-Anaheim, CA | 14,140 | 2.29 | 1.63 | $ 37.67 | $ 78,360 |
| Chicago-Naperville-Elgin, IL-IN-WI | 7,350 | 1.63 | 1.16 | $ 30.27 | $ 62,970 |
| Washington-Arlington-Alexandria, DC-VA-MD-WV | 5,470 | 1.77 | 1.26 | $ 40.49 | $ 84,210 |
| Dallas-Fort Worth-Arlington, TX | 5,020 | 1.27 | 0.90 | $ 29.19 | $ 60,700 |
| San Francisco-Oakland-Hayward, CA | 4,840 | 2.00 | 1.43 | $ 45.87 | $ 95,410 |
| Miami-Fort Lauderdale-West Palm Beach, FL | 4,180 | 1.54 | 1.10 | $ 29.91 | $ 62,210 |
| Boston-Cambridge-Nashua, MA-NH | 3,900 | 1.41 | 1.01 | $ 36.62 | $ 76,180 |
| Atlanta-Sandy Springs-Roswell, GA | 3,760 | 1.34 | 0.95 | $ 31.52 | $ 65,560 |
| Seattle-Tacoma-Bellevue, WA | 3,730 | 1.79 | 1.28 | $ 38.88 | $ 80,870 |
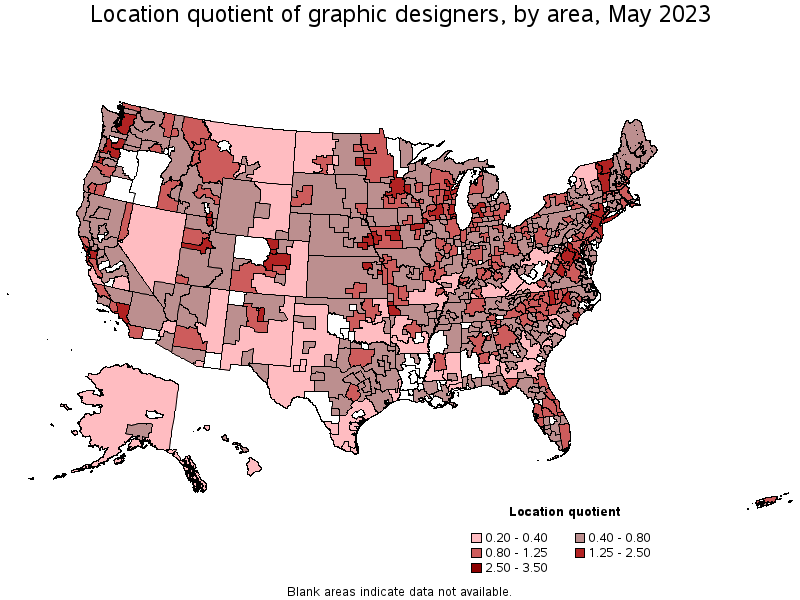
Metropolitan areas with the highest concentration of jobs and location quotients in Graphic Designers:
| Metropolitan area | Employment (1) | Employment per thousand jobs | Location quotient (9) | Hourly mean wage | Annual mean wage (2) |
|---|---|---|---|---|---|
| Boulder, CO | 630 | 3.23 | 2.30 | $ 31.95 | $ 66,450 |
| Lawrence, KS | 160 | 3.13 | 2.23 | $ 24.08 | $ 50,080 |
| Oshkosh-Neenah, WI | 280 | 2.97 | 2.12 | $ 25.60 | $ 53,250 |
| Portland-Vancouver-Hillsboro, OR-WA | 3,530 | 2.93 | 2.09 | $ 32.38 | $ 67,360 |
| Provo-Orem, UT | 710 | 2.41 | 1.72 | $ 26.82 | $ 55,790 |
| Dubuque, IA | 140 | 2.37 | 1.69 | $ 24.76 | $ 51,490 |
| Fort Collins, CO | 400 | 2.34 | 1.67 | $ 30.06 | $ 62,520 |
| Los Angeles-Long Beach-Anaheim, CA | 14,140 | 2.29 | 1.63 | $ 37.67 | $ 78,360 |
| Burlington-South Burlington, VT | 270 | 2.26 | 1.61 | $ 33.34 | $ 69,350 |
| Des Moines-West Des Moines, IA | 860 | 2.24 | 1.60 | $ 24.31 | $ 50,560 |
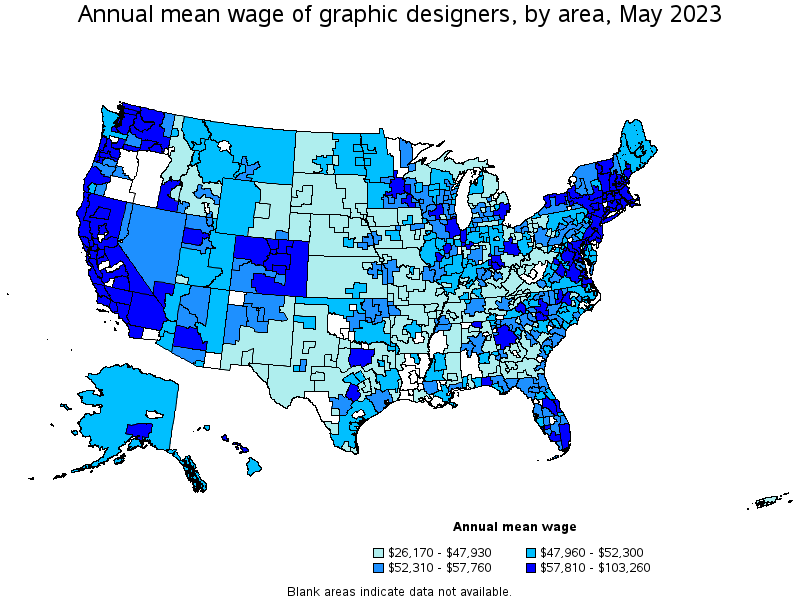
Top paying metropolitan areas for Graphic Designers:
| Metropolitan area | Employment (1) | Employment per thousand jobs | Location quotient (9) | Hourly mean wage | Annual mean wage (2) |
|---|---|---|---|---|---|
| San Jose-Sunnyvale-Santa Clara, CA | 1,330 | 1.17 | 0.83 | $ 49.65 | $ 103,260 |
| San Francisco-Oakland-Hayward, CA | 4,840 | 2.00 | 1.43 | $ 45.87 | $ 95,410 |
| Washington-Arlington-Alexandria, DC-VA-MD-WV | 5,470 | 1.77 | 1.26 | $ 40.49 | $ 84,210 |
| New York-Newark-Jersey City, NY-NJ-PA | 19,050 | 2.01 | 1.43 | $ 39.28 | $ 81,710 |
| Seattle-Tacoma-Bellevue, WA | 3,730 | 1.79 | 1.28 | $ 38.88 | $ 80,870 |
| Los Angeles-Long Beach-Anaheim, CA | 14,140 | 2.29 | 1.63 | $ 37.67 | $ 78,360 |
| Modesto, CA | 170 | 0.88 | 0.63 | $ 37.08 | $ 77,120 |
| Santa Maria-Santa Barbara, CA | 210 | 1.03 | 0.74 | $ 37.08 | $ 77,120 |
| Boston-Cambridge-Nashua, MA-NH | 3,900 | 1.41 | 1.01 | $ 36.62 | $ 76,180 |
| Portsmouth, NH-ME | 160 | 1.70 | 1.22 | $ 35.59 | $ 74,020 |
Nonmetropolitan areas with the highest employment in Graphic Designers:
| Nonmetropolitan area | Employment (1) | Employment per thousand jobs | Location quotient (9) | Hourly mean wage | Annual mean wage (2) |
|---|---|---|---|---|---|
| North Northeastern Ohio nonmetropolitan area (noncontiguous) | 350 | 1.08 | 0.77 | $ 22.52 | $ 46,840 |
| Piedmont North Carolina nonmetropolitan area | 330 | 1.28 | 0.92 | $ 25.78 | $ 53,620 |
| South Central Wisconsin nonmetropolitan area | 310 | 1.49 | 1.06 | $ 25.66 | $ 53,370 |
| Kansas nonmetropolitan area | 280 | 0.71 | 0.51 | $ 21.57 | $ 44,870 |
| West Northwestern Ohio nonmetropolitan area | 260 | 1.05 | 0.75 | $ 23.26 | $ 48,370 |
Nonmetropolitan areas with the highest concentration of jobs and location quotients in Graphic Designers:
| Nonmetropolitan area | Employment (1) | Employment per thousand jobs | Location quotient (9) | Hourly mean wage | Annual mean wage (2) |
|---|---|---|---|---|---|
| Southern Vermont nonmetropolitan area | 220 | 2.20 | 1.57 | $ 29.98 | $ 62,360 |
| Northern Vermont nonmetropolitan area | 120 | 1.77 | 1.26 | $ 30.12 | $ 62,640 |
| Mountain North Carolina nonmetropolitan area | 210 | 1.61 | 1.15 | $ 24.85 | $ 51,680 |
| Northwest Lower Peninsula of Michigan nonmetropolitan area | 190 | 1.55 | 1.11 | $ 23.07 | $ 47,980 |
| West Montana nonmetropolitan area | 120 | 1.51 | 1.07 | $ 23.81 | $ 49,530 |
Top paying nonmetropolitan areas for Graphic Designers:
| Nonmetropolitan area | Employment (1) | Employment per thousand jobs | Location quotient (9) | Hourly mean wage | Annual mean wage (2) |
|---|---|---|---|---|---|
| Northwest Colorado nonmetropolitan area | (8) | (8) | (8) | $ 34.54 | $ 71,840 |
| Massachusetts nonmetropolitan area | 70 | 1.15 | 0.82 | $ 30.60 | $ 63,660 |
| North Valley-Northern Mountains Region of California nonmetropolitan area | 80 | 0.83 | 0.59 | $ 30.57 | $ 63,590 |
| Central East New York nonmetropolitan area | 150 | 0.96 | 0.68 | $ 30.18 | $ 62,770 |
| Northern Vermont nonmetropolitan area | 120 | 1.77 | 1.26 | $ 30.12 | $ 62,640 |
These estimates are calculated with data collected from employers in all industry sectors, all metropolitan and nonmetropolitan areas, and all states and the District of Columbia. The top employment and wage figures are provided above. The complete list is available in the downloadable XLS files.
The percentile wage estimate is the value of a wage below which a certain percent of workers fall. The median wage is the 50th percentile wage estimate—50 percent of workers earn less than the median and 50 percent of workers earn more than the median. More about percentile wages.
(1) Estimates for detailed occupations do not sum to the totals because the totals include occupations not shown separately. Estimates do not include self-employed workers.
(2) Annual wages have been calculated by multiplying the hourly mean wage by a "year-round, full-time" hours figure of 2,080 hours; for those occupations where there is not an hourly wage published, the annual wage has been directly calculated from the reported survey data.
(3) The relative standard error (RSE) is a measure of the reliability of a survey statistic. The smaller the relative standard error, the more precise the estimate.
(7) The value is less than .005 percent of industry employment.
(8) Estimate not released.
(9) The location quotient is the ratio of the area concentration of occupational employment to the national average concentration. A location quotient greater than one indicates the occupation has a higher share of employment than average, and a location quotient less than one indicates the occupation is less prevalent in the area than average.
Other OEWS estimates and related information:
May 2023 National Occupational Employment and Wage Estimates
May 2023 State Occupational Employment and Wage Estimates
May 2023 Metropolitan and Nonmetropolitan Area Occupational Employment and Wage Estimates
May 2023 National Industry-Specific Occupational Employment and Wage Estimates
Last Modified Date: April 3, 2024