
An official website of the United States government
An official website of the United States government
The .gov means it's official.
Federal government websites often end in .gov or .mil. Before sharing sensitive information,
make sure you're on a federal government site.
The site is secure.
The
https:// ensures that you are connecting to the official website and that any
information you provide is encrypted and transmitted securely.
Assist in the provision of food service and nutritional programs, under the supervision of a dietitian. May plan and produce meals based on established guidelines, teach principles of food and nutrition, or counsel individuals.
Employment estimate and mean wage estimates for Dietetic Technicians:
| Employment (1) | Employment RSE (3) |
Mean hourly wage |
Mean annual wage (2) |
Wage RSE (3) |
|---|---|---|---|---|
| 24,240 | 2.9 % | $ 18.48 | $ 38,440 | 0.7 % |
Percentile wage estimates for Dietetic Technicians:
| Percentile | 10% | 25% | 50% (Median) |
75% | 90% |
|---|---|---|---|---|---|
| Hourly Wage | $ 13.30 | $ 15.11 | $ 17.56 | $ 20.71 | $ 24.42 |
| Annual Wage (2) | $ 27,670 | $ 31,420 | $ 36,520 | $ 43,090 | $ 50,790 |
Industries with the highest published employment and wages for Dietetic Technicians are provided. For a list of all industries with employment in Dietetic Technicians, see the Create Customized Tables function.
Industries with the highest levels of employment in Dietetic Technicians:
| Industry | Employment (1) | Percent of industry employment | Hourly mean wage | Annual mean wage (2) |
|---|---|---|---|---|
| General Medical and Surgical Hospitals | 9,940 | 0.17 | $ 19.77 | $ 41,130 |
| Nursing Care Facilities (Skilled Nursing Facilities) | 5,800 | 0.42 | $ 16.02 | $ 33,330 |
| Continuing Care Retirement Communities and Assisted Living Facilities for the Elderly | 1,950 | 0.21 | $ 16.12 | $ 33,540 |
| Local Government, excluding Schools and Hospitals (OEWS Designation) | 1,410 | 0.03 | $ 19.83 | $ 41,240 |
| Individual and Family Services | 960 | 0.03 | $ 21.25 | $ 44,200 |
Industries with the highest concentration of employment in Dietetic Technicians:
| Industry | Employment (1) | Percent of industry employment | Hourly mean wage | Annual mean wage (2) |
|---|---|---|---|---|
| Nursing Care Facilities (Skilled Nursing Facilities) | 5,800 | 0.42 | $ 16.02 | $ 33,330 |
| Specialty (except Psychiatric and Substance Abuse) Hospitals | 870 | 0.30 | $ 18.34 | $ 38,140 |
| Continuing Care Retirement Communities and Assisted Living Facilities for the Elderly | 1,950 | 0.21 | $ 16.12 | $ 33,540 |
| General Medical and Surgical Hospitals | 9,940 | 0.17 | $ 19.77 | $ 41,130 |
| Psychiatric and Substance Abuse Hospitals | 270 | 0.11 | $ 17.49 | $ 36,370 |
Top paying industries for Dietetic Technicians:
| Industry | Employment (1) | Percent of industry employment | Hourly mean wage | Annual mean wage (2) |
|---|---|---|---|---|
| Offices of Other Health Practitioners | 210 | 0.02 | $ 22.61 | $ 47,020 |
| Outpatient Care Centers | 290 | 0.03 | $ 22.50 | $ 46,800 |
| Colleges, Universities, and Professional Schools | 70 | (7) | $ 22.26 | $ 46,290 |
| Individual and Family Services | 960 | 0.03 | $ 21.25 | $ 44,200 |
| Elementary and Secondary Schools | 250 | (7) | $ 21.01 | $ 43,700 |
States and areas with the highest published employment, location quotients, and wages for Dietetic Technicians are provided. For a list of all areas with employment in Dietetic Technicians, see the Create Customized Tables function.
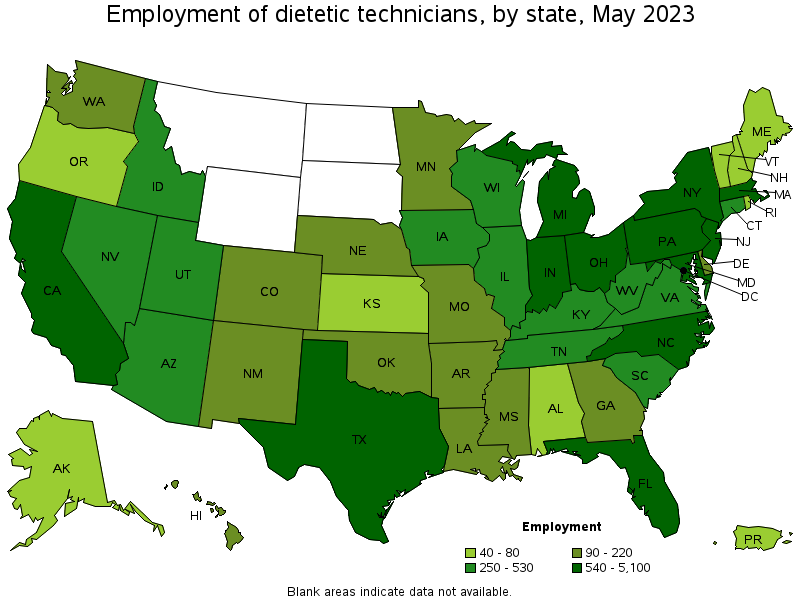
States with the highest employment level in Dietetic Technicians:
| State | Employment (1) | Employment per thousand jobs | Location quotient (9) | Hourly mean wage | Annual mean wage (2) |
|---|---|---|---|---|---|
| California | 5,100 | 0.28 | 1.78 | $ 21.59 | $ 44,900 |
| Michigan | 2,070 | 0.48 | 2.99 | $ 16.57 | $ 34,470 |
| Texas | 1,640 | 0.12 | 0.76 | $ 14.76 | $ 30,700 |
| Pennsylvania | 1,570 | 0.26 | 1.66 | $ 16.92 | $ 35,200 |
| New York | 1,310 | 0.14 | 0.88 | $ 22.94 | $ 47,710 |
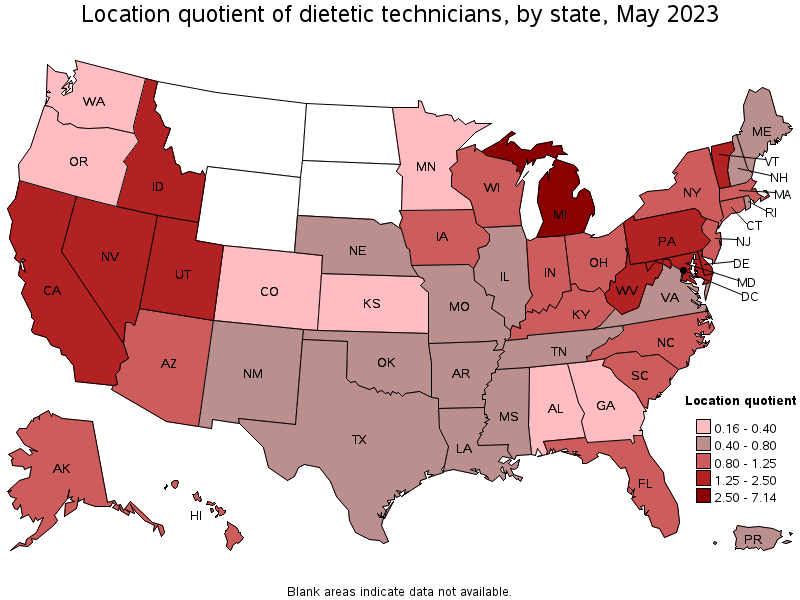
States with the highest concentration of jobs and location quotients in Dietetic Technicians:
| State | Employment (1) | Employment per thousand jobs | Location quotient (9) | Hourly mean wage | Annual mean wage (2) |
|---|---|---|---|---|---|
| Michigan | 2,070 | 0.48 | 2.99 | $ 16.57 | $ 34,470 |
| West Virginia | 260 | 0.37 | 2.32 | $ 15.77 | $ 32,790 |
| Idaho | 260 | 0.31 | 1.94 | $ 15.45 | $ 32,130 |
| California | 5,100 | 0.28 | 1.78 | $ 21.59 | $ 44,900 |
| Utah | 450 | 0.27 | 1.67 | $ 18.10 | $ 37,650 |
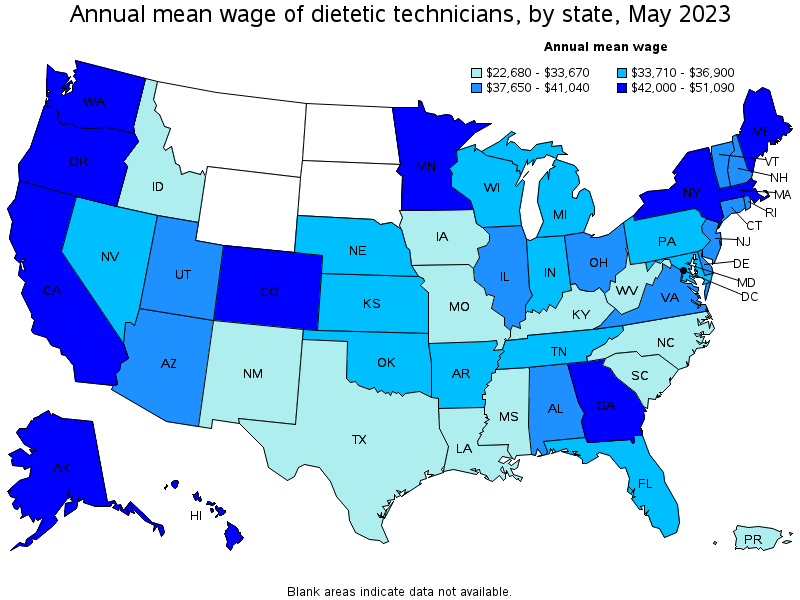
Top paying states for Dietetic Technicians:
| State | Employment (1) | Employment per thousand jobs | Location quotient (9) | Hourly mean wage | Annual mean wage (2) |
|---|---|---|---|---|---|
| Oregon | 80 | 0.04 | 0.25 | $ 24.56 | $ 51,090 |
| Washington | 140 | 0.04 | 0.25 | $ 24.54 | $ 51,050 |
| Colorado | 180 | 0.06 | 0.39 | $ 23.10 | $ 48,040 |
| New York | 1,310 | 0.14 | 0.88 | $ 22.94 | $ 47,710 |
| District of Columbia | 50 | 0.07 | 0.44 | $ 22.65 | $ 47,110 |
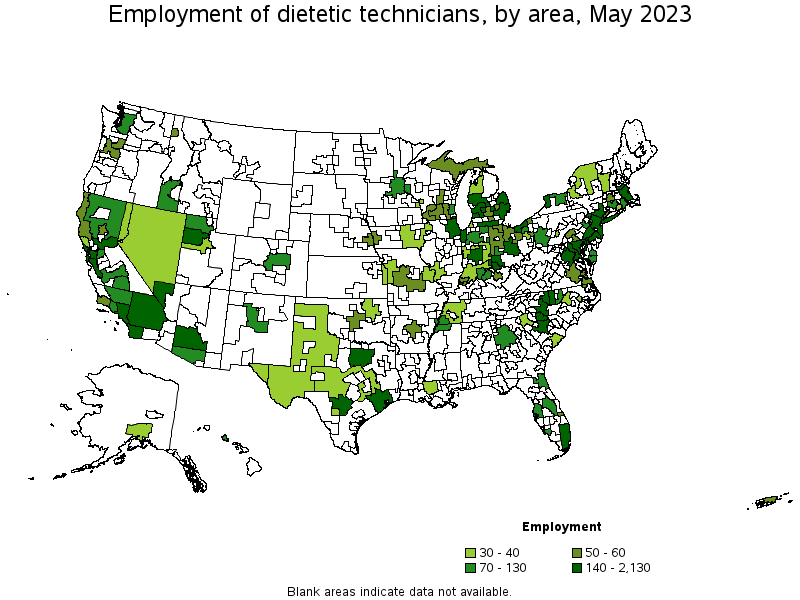
Metropolitan areas with the highest employment level in Dietetic Technicians:
| Metropolitan area | Employment (1) | Employment per thousand jobs | Location quotient (9) | Hourly mean wage | Annual mean wage (2) |
|---|---|---|---|---|---|
| Los Angeles-Long Beach-Anaheim, CA | 2,130 | 0.35 | 2.16 | $ 21.25 | $ 44,200 |
| New York-Newark-Jersey City, NY-NJ-PA | 1,360 | 0.14 | 0.89 | $ 22.23 | $ 46,230 |
| Philadelphia-Camden-Wilmington, PA-NJ-DE-MD | 1,050 | 0.37 | 2.34 | $ 17.47 | $ 36,340 |
| Detroit-Warren-Dearborn, MI | 770 | 0.40 | 2.54 | $ 16.60 | $ 34,530 |
| Grand Rapids-Wyoming, MI | 600 | 1.11 | 6.96 | $ 16.78 | $ 34,900 |
| Boston-Cambridge-Nashua, MA-NH | 540 | 0.20 | 1.24 | $ 20.39 | $ 42,420 |
| San Francisco-Oakland-Hayward, CA | 540 | 0.22 | 1.41 | $ 24.48 | $ 50,920 |
| San Diego-Carlsbad, CA | 480 | 0.31 | 1.96 | $ 19.63 | $ 40,830 |
| Dallas-Fort Worth-Arlington, TX | 470 | 0.12 | 0.74 | $ 15.19 | $ 31,600 |
| Chicago-Naperville-Elgin, IL-IN-WI | 430 | 0.10 | 0.60 | $ 19.39 | $ 40,320 |
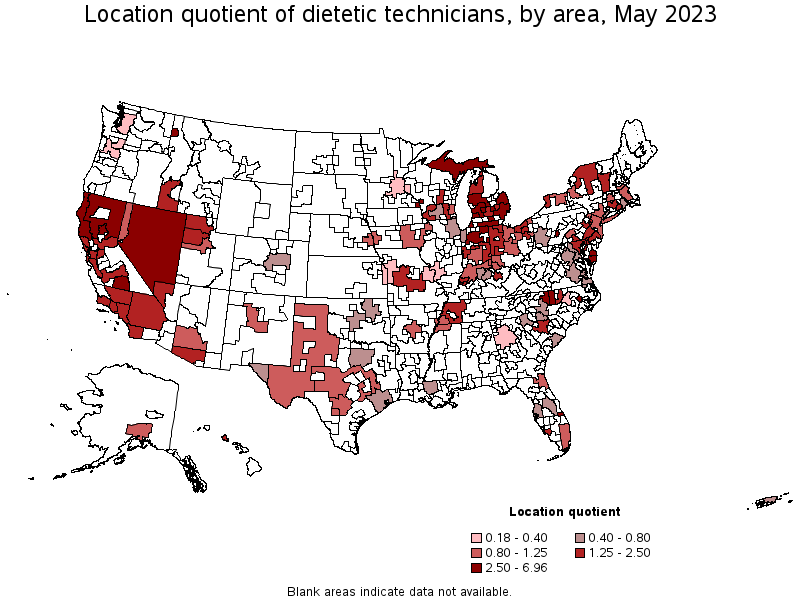
Metropolitan areas with the highest concentration of jobs and location quotients in Dietetic Technicians:
| Metropolitan area | Employment (1) | Employment per thousand jobs | Location quotient (9) | Hourly mean wage | Annual mean wage (2) |
|---|---|---|---|---|---|
| Grand Rapids-Wyoming, MI | 600 | 1.11 | 6.96 | $ 16.78 | $ 34,900 |
| Jackson, MI | 60 | 1.07 | 6.67 | $ 17.24 | $ 35,850 |
| Sebastian-Vero Beach, FL | 50 | 0.82 | 5.14 | $ 15.39 | $ 32,020 |
| Chico, CA | 60 | 0.76 | 4.78 | $ 18.41 | $ 38,290 |
| Niles-Benton Harbor, MI | 40 | 0.68 | 4.28 | $ 16.46 | $ 34,230 |
| Coeur d'Alene, ID | 50 | 0.68 | 4.24 | $ 15.00 | $ 31,200 |
| Altoona, PA | 40 | 0.62 | 3.87 | $ 16.18 | $ 33,660 |
| Greensboro-High Point, NC | 210 | 0.58 | 3.65 | $ 12.25 | $ 25,480 |
| La Crosse-Onalaska, WI-MN | 40 | 0.56 | 3.52 | $ 15.78 | $ 32,810 |
| Winston-Salem, NC | 140 | 0.52 | 3.27 | $ 15.06 | $ 31,330 |
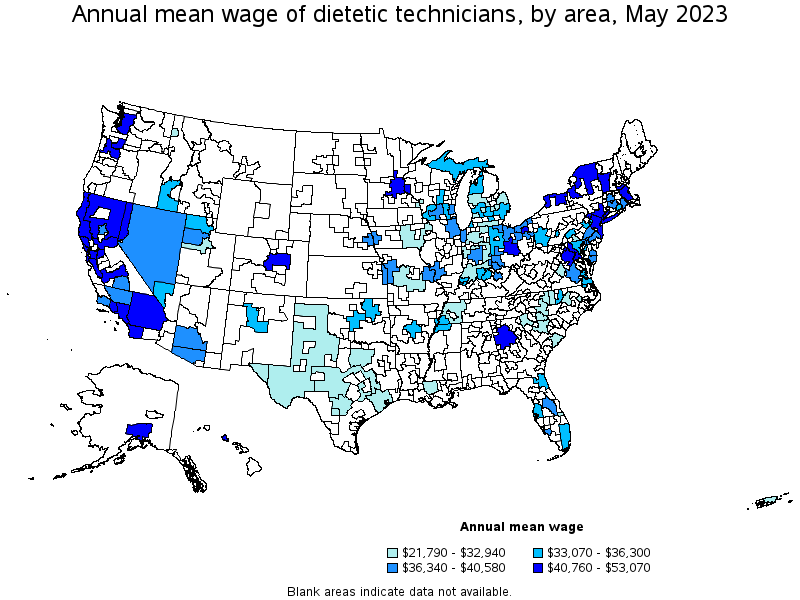
Top paying metropolitan areas for Dietetic Technicians:
| Metropolitan area | Employment (1) | Employment per thousand jobs | Location quotient (9) | Hourly mean wage | Annual mean wage (2) |
|---|---|---|---|---|---|
| San Jose-Sunnyvale-Santa Clara, CA | 310 | 0.27 | 1.72 | $ 25.52 | $ 53,070 |
| Portland-Vancouver-Hillsboro, OR-WA | 50 | 0.04 | 0.26 | $ 25.46 | $ 52,950 |
| Denver-Aurora-Lakewood, CO | 120 | 0.08 | 0.47 | $ 25.03 | $ 52,050 |
| Seattle-Tacoma-Bellevue, WA | 100 | 0.05 | 0.30 | $ 24.61 | $ 51,190 |
| San Francisco-Oakland-Hayward, CA | 540 | 0.22 | 1.41 | $ 24.48 | $ 50,920 |
| Oxnard-Thousand Oaks-Ventura, CA | 100 | 0.31 | 1.92 | $ 24.45 | $ 50,860 |
| Atlanta-Sandy Springs-Roswell, GA | 110 | 0.04 | 0.25 | $ 23.81 | $ 49,530 |
| Anchorage, AK | 30 | 0.18 | 1.12 | $ 23.41 | $ 48,690 |
| Minneapolis-St. Paul-Bloomington, MN-WI | 90 | 0.05 | 0.31 | $ 22.56 | $ 46,920 |
| New York-Newark-Jersey City, NY-NJ-PA | 1,360 | 0.14 | 0.89 | $ 22.23 | $ 46,230 |
Nonmetropolitan areas with the highest employment in Dietetic Technicians:
| Nonmetropolitan area | Employment (1) | Employment per thousand jobs | Location quotient (9) | Hourly mean wage | Annual mean wage (2) |
|---|---|---|---|---|---|
| Balance of Lower Peninsula of Michigan nonmetropolitan area | 140 | 0.54 | 3.36 | $ 15.59 | $ 32,440 |
| Northern Indiana nonmetropolitan area | 90 | 0.43 | 2.67 | $ 15.38 | $ 31,990 |
| North Valley-Northern Mountains Region of California nonmetropolitan area | 70 | 0.67 | 4.17 | $ 20.02 | $ 41,650 |
| West Northwestern Ohio nonmetropolitan area | 60 | 0.25 | 1.57 | $ 17.09 | $ 35,550 |
| Upper Peninsula of Michigan nonmetropolitan area | 60 | 0.56 | 3.49 | $ 16.05 | $ 33,390 |
Nonmetropolitan areas with the highest concentration of jobs and location quotients in Dietetic Technicians:
| Nonmetropolitan area | Employment (1) | Employment per thousand jobs | Location quotient (9) | Hourly mean wage | Annual mean wage (2) |
|---|---|---|---|---|---|
| North Valley-Northern Mountains Region of California nonmetropolitan area | 70 | 0.67 | 4.17 | $ 20.02 | $ 41,650 |
| Upper Peninsula of Michigan nonmetropolitan area | 60 | 0.56 | 3.49 | $ 16.05 | $ 33,390 |
| North Coast Region of California nonmetropolitan area | 60 | 0.55 | 3.44 | $ 20.09 | $ 41,790 |
| Balance of Lower Peninsula of Michigan nonmetropolitan area | 140 | 0.54 | 3.36 | $ 15.59 | $ 32,440 |
| Northern Indiana nonmetropolitan area | 90 | 0.43 | 2.67 | $ 15.38 | $ 31,990 |
Top paying nonmetropolitan areas for Dietetic Technicians:
| Nonmetropolitan area | Employment (1) | Employment per thousand jobs | Location quotient (9) | Hourly mean wage | Annual mean wage (2) |
|---|---|---|---|---|---|
| Capital/Northern New York nonmetropolitan area | 30 | 0.24 | 1.49 | $ 22.94 | $ 47,710 |
| North Coast Region of California nonmetropolitan area | 60 | 0.55 | 3.44 | $ 20.09 | $ 41,790 |
| North Valley-Northern Mountains Region of California nonmetropolitan area | 70 | 0.67 | 4.17 | $ 20.02 | $ 41,650 |
| Southern Vermont nonmetropolitan area | 30 | 0.33 | 2.05 | $ 19.60 | $ 40,760 |
| North Northeastern Ohio nonmetropolitan area (noncontiguous) | 50 | 0.14 | 0.89 | $ 18.18 | $ 37,800 |
These estimates are calculated with data collected from employers in all industry sectors, all metropolitan and nonmetropolitan areas, and all states and the District of Columbia. The top employment and wage figures are provided above. The complete list is available in the downloadable XLS files.
The percentile wage estimate is the value of a wage below which a certain percent of workers fall. The median wage is the 50th percentile wage estimate—50 percent of workers earn less than the median and 50 percent of workers earn more than the median. More about percentile wages.
(1) Estimates for detailed occupations do not sum to the totals because the totals include occupations not shown separately. Estimates do not include self-employed workers.
(2) Annual wages have been calculated by multiplying the hourly mean wage by a "year-round, full-time" hours figure of 2,080 hours; for those occupations where there is not an hourly wage published, the annual wage has been directly calculated from the reported survey data.
(3) The relative standard error (RSE) is a measure of the reliability of a survey statistic. The smaller the relative standard error, the more precise the estimate.
(7) The value is less than .005 percent of industry employment.
(9) The location quotient is the ratio of the area concentration of occupational employment to the national average concentration. A location quotient greater than one indicates the occupation has a higher share of employment than average, and a location quotient less than one indicates the occupation is less prevalent in the area than average.
Other OEWS estimates and related information:
May 2023 National Occupational Employment and Wage Estimates
May 2023 State Occupational Employment and Wage Estimates
May 2023 Metropolitan and Nonmetropolitan Area Occupational Employment and Wage Estimates
May 2023 National Industry-Specific Occupational Employment and Wage Estimates
Last Modified Date: April 3, 2024