
An official website of the United States government
An official website of the United States government
The .gov means it's official.
Federal government websites often end in .gov or .mil. Before sharing sensitive information,
make sure you're on a federal government site.
The site is secure.
The
https:// ensures that you are connecting to the official website and that any
information you provide is encrypted and transmitted securely.
Select and fit hearing aids for customers. Administer and interpret tests of hearing. Assess hearing instrument efficacy. Take ear impressions and prepare, design, and modify ear molds. Excludes �Audiologists� (29-1181).
Employment estimate and mean wage estimates for Hearing Aid Specialists:
| Employment (1) | Employment RSE (3) |
Mean hourly wage |
Mean annual wage (2) |
Wage RSE (3) |
|---|---|---|---|---|
| 10,250 | 8.0 % | $ 29.59 | $ 61,550 | 3.2 % |
Percentile wage estimates for Hearing Aid Specialists:
| Percentile | 10% | 25% | 50% (Median) |
75% | 90% |
|---|---|---|---|---|---|
| Hourly Wage | $ 16.58 | $ 20.44 | $ 28.21 | $ 36.01 | $ 41.28 |
| Annual Wage (2) | $ 34,480 | $ 42,520 | $ 58,670 | $ 74,900 | $ 85,870 |
Industries with the highest published employment and wages for Hearing Aid Specialists are provided. For a list of all industries with employment in Hearing Aid Specialists, see the Create Customized Tables function.
Industries with the highest levels of employment in Hearing Aid Specialists:
| Industry | Employment (1) | Percent of industry employment | Hourly mean wage | Annual mean wage (2) |
|---|---|---|---|---|
| Health and Personal Care Retailers | 3,690 | 0.33 | $ 29.89 | $ 62,160 |
| Other Ambulatory Health Care Services | 490 | 0.14 | $ 25.45 | $ 52,930 |
| Offices of Physicians | 470 | 0.02 | $ 21.55 | $ 44,820 |
| General Medical and Surgical Hospitals | 260 | 0.00 | $ 21.84 | $ 45,430 |
| Professional and Commercial Equipment and Supplies Merchant Wholesalers | 160 | 0.02 | $ 34.01 | $ 70,740 |
Industries with the highest concentration of employment in Hearing Aid Specialists:
| Industry | Employment (1) | Percent of industry employment | Hourly mean wage | Annual mean wage (2) |
|---|---|---|---|---|
| Health and Personal Care Retailers | 3,690 | 0.33 | $ 29.89 | $ 62,160 |
| Other Ambulatory Health Care Services | 490 | 0.14 | $ 25.45 | $ 52,930 |
| Professional and Commercial Equipment and Supplies Merchant Wholesalers | 160 | 0.02 | $ 34.01 | $ 70,740 |
| Offices of Physicians | 470 | 0.02 | $ 21.55 | $ 44,820 |
| Specialty (except Psychiatric and Substance Abuse) Hospitals | 40 | 0.01 | $ 20.82 | $ 43,310 |
Top paying industries for Hearing Aid Specialists:
| Industry | Employment (1) | Percent of industry employment | Hourly mean wage | Annual mean wage (2) |
|---|---|---|---|---|
| Professional and Commercial Equipment and Supplies Merchant Wholesalers | 160 | 0.02 | $ 34.01 | $ 70,740 |
| Health and Personal Care Retailers | 3,690 | 0.33 | $ 29.89 | $ 62,160 |
| Offices of Other Health Practitioners | (8) | (8) | $ 27.43 | $ 57,050 |
| Other Ambulatory Health Care Services | 490 | 0.14 | $ 25.45 | $ 52,930 |
| Local Government, excluding Schools and Hospitals (OEWS Designation) | 80 | (7) | $ 23.95 | $ 49,810 |
States and areas with the highest published employment, location quotients, and wages for Hearing Aid Specialists are provided. For a list of all areas with employment in Hearing Aid Specialists, see the Create Customized Tables function.
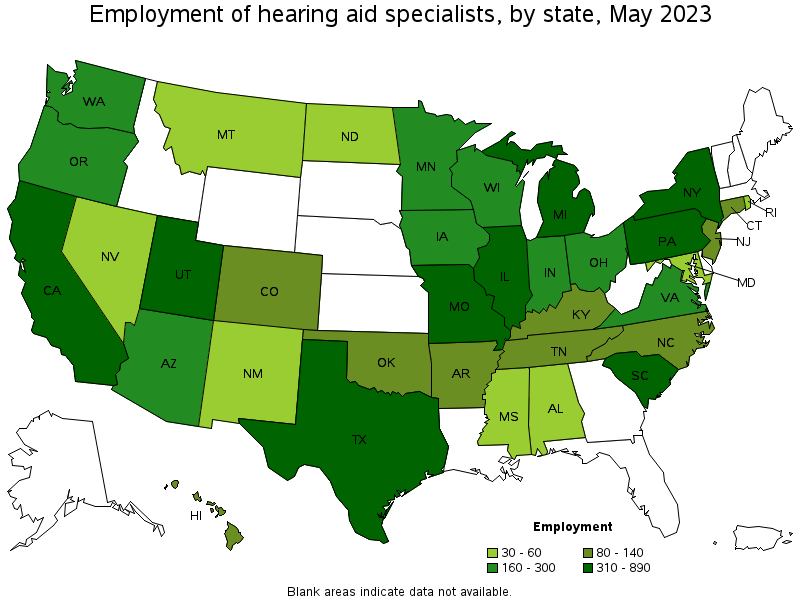
States with the highest employment level in Hearing Aid Specialists:
| State | Employment (1) | Employment per thousand jobs | Location quotient (9) | Hourly mean wage | Annual mean wage (2) |
|---|---|---|---|---|---|
| California | 890 | 0.05 | 0.74 | $ 33.90 | $ 70,510 |
| Illinois | 720 | 0.12 | 1.77 | $ 26.35 | $ 54,810 |
| Michigan | 710 | 0.16 | 2.43 | $ 25.91 | $ 53,890 |
| Pennsylvania | 550 | 0.09 | 1.36 | $ 28.48 | $ 59,230 |
| Texas | 520 | 0.04 | 0.57 | $ 31.07 | $ 64,630 |
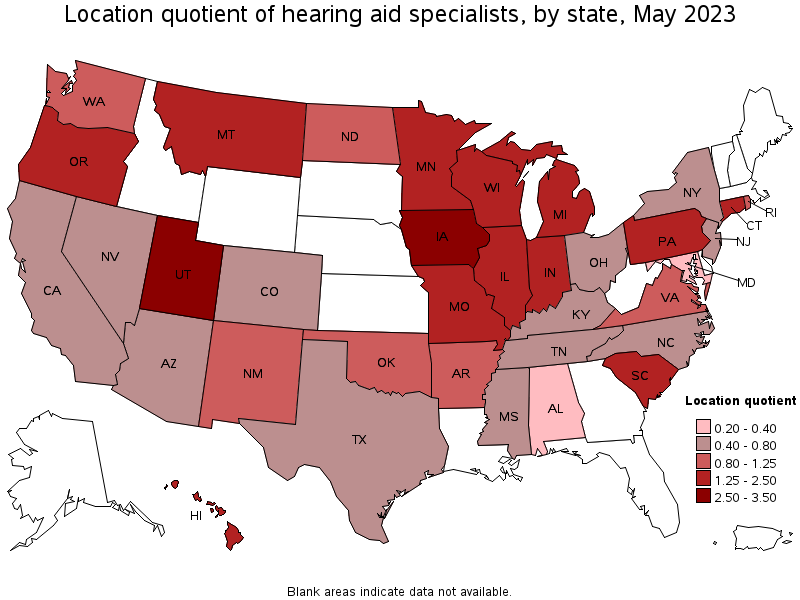
States with the highest concentration of jobs and location quotients in Hearing Aid Specialists:
| State | Employment (1) | Employment per thousand jobs | Location quotient (9) | Hourly mean wage | Annual mean wage (2) |
|---|---|---|---|---|---|
| Utah | 310 | 0.19 | 2.77 | $ 23.93 | $ 49,770 |
| Iowa | 270 | 0.18 | 2.61 | $ 33.87 | $ 70,450 |
| Michigan | 710 | 0.16 | 2.43 | $ 25.91 | $ 53,890 |
| Hawaii | 100 | 0.16 | 2.36 | $ 37.97 | $ 78,970 |
| South Carolina | 340 | 0.15 | 2.24 | $ 23.94 | $ 49,790 |
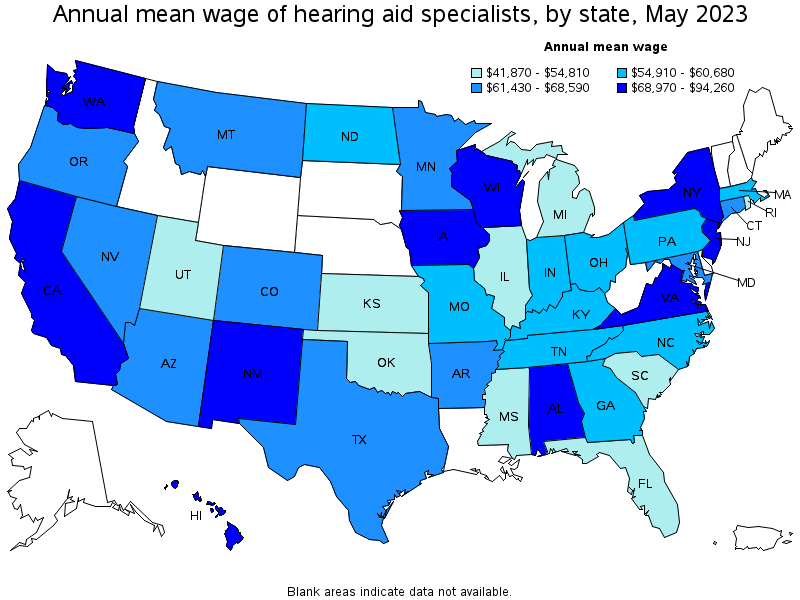
Top paying states for Hearing Aid Specialists:
| State | Employment (1) | Employment per thousand jobs | Location quotient (9) | Hourly mean wage | Annual mean wage (2) |
|---|---|---|---|---|---|
| New York | 380 | 0.04 | 0.60 | $ 45.32 | $ 94,260 |
| New Mexico | 60 | 0.07 | 1.02 | $ 38.27 | $ 79,600 |
| Hawaii | 100 | 0.16 | 2.36 | $ 37.97 | $ 78,970 |
| Virginia | 210 | 0.05 | 0.80 | $ 36.51 | $ 75,940 |
| Alabama | 50 | 0.02 | 0.34 | $ 36.17 | $ 75,230 |
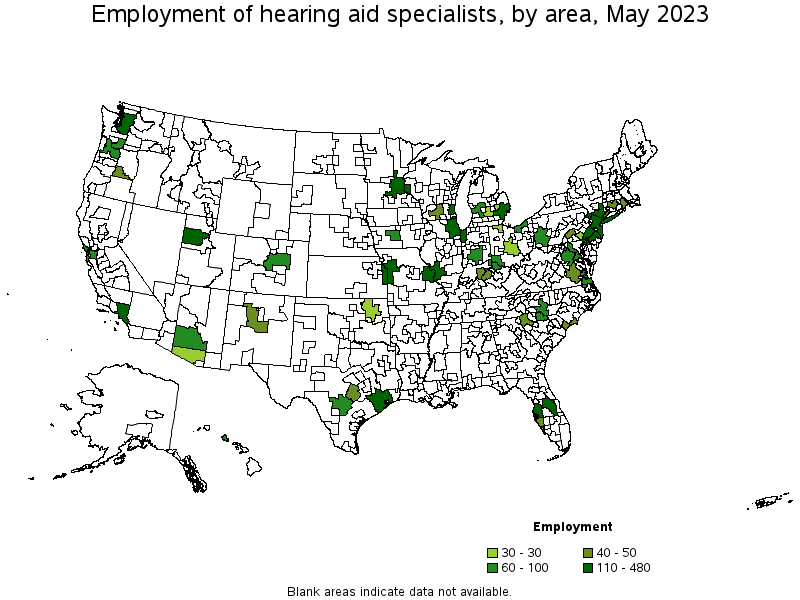
Metropolitan areas with the highest employment level in Hearing Aid Specialists:
| Metropolitan area | Employment (1) | Employment per thousand jobs | Location quotient (9) | Hourly mean wage | Annual mean wage (2) |
|---|---|---|---|---|---|
| Chicago-Naperville-Elgin, IL-IN-WI | 480 | 0.11 | 1.58 | $ 27.07 | $ 56,300 |
| Detroit-Warren-Dearborn, MI | 400 | 0.21 | 3.08 | $ 27.08 | $ 56,320 |
| New York-Newark-Jersey City, NY-NJ-PA | 340 | 0.04 | 0.52 | $ 43.92 | $ 91,360 |
| Los Angeles-Long Beach-Anaheim, CA | 280 | 0.05 | 0.68 | $ 26.79 | $ 55,720 |
| Minneapolis-St. Paul-Bloomington, MN-WI | 240 | 0.13 | 1.90 | $ 29.87 | $ 62,140 |
| Salt Lake City, UT | 240 | 0.30 | 4.49 | $ 22.50 | $ 46,800 |
| Philadelphia-Camden-Wilmington, PA-NJ-DE-MD | 200 | 0.07 | 1.04 | $ 28.30 | $ 58,860 |
| Orlando-Kissimmee-Sanford, FL | 160 | 0.12 | 1.76 | $ 26.32 | $ 54,740 |
| St. Louis, MO-IL | 140 | 0.11 | 1.59 | $ 26.68 | $ 55,500 |
| Houston-The Woodlands-Sugar Land, TX | 120 | 0.04 | 0.56 | $ 32.40 | $ 67,390 |
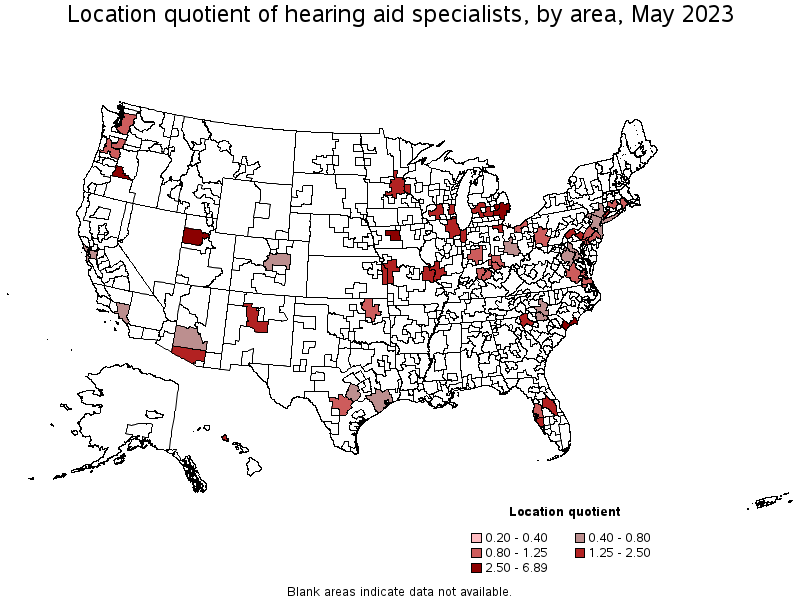
Metropolitan areas with the highest concentration of jobs and location quotients in Hearing Aid Specialists:
| Metropolitan area | Employment (1) | Employment per thousand jobs | Location quotient (9) | Hourly mean wage | Annual mean wage (2) |
|---|---|---|---|---|---|
| Bend-Redmond, OR | 40 | 0.47 | 6.89 | $ 36.20 | $ 75,300 |
| Salt Lake City, UT | 240 | 0.30 | 4.49 | $ 22.50 | $ 46,800 |
| Myrtle Beach-Conway-North Myrtle Beach, SC-NC | 50 | 0.26 | 3.79 | $ 27.94 | $ 58,120 |
| Flint, MI | 30 | 0.24 | 3.49 | $ 21.88 | $ 45,500 |
| Des Moines-West Des Moines, IA | 90 | 0.23 | 3.37 | $ 33.52 | $ 69,720 |
| Detroit-Warren-Dearborn, MI | 400 | 0.21 | 3.08 | $ 27.08 | $ 56,320 |
| Urban Honolulu, HI | 70 | 0.16 | 2.44 | $ 39.66 | $ 82,490 |
| Lansing-East Lansing, MI | 30 | 0.16 | 2.30 | $ 25.48 | $ 53,000 |
| North Port-Sarasota-Bradenton, FL | 50 | 0.15 | 2.21 | $ 28.84 | $ 59,980 |
| Milwaukee-Waukesha-West Allis, WI | 120 | 0.14 | 2.11 | $ 34.06 | $ 70,850 |
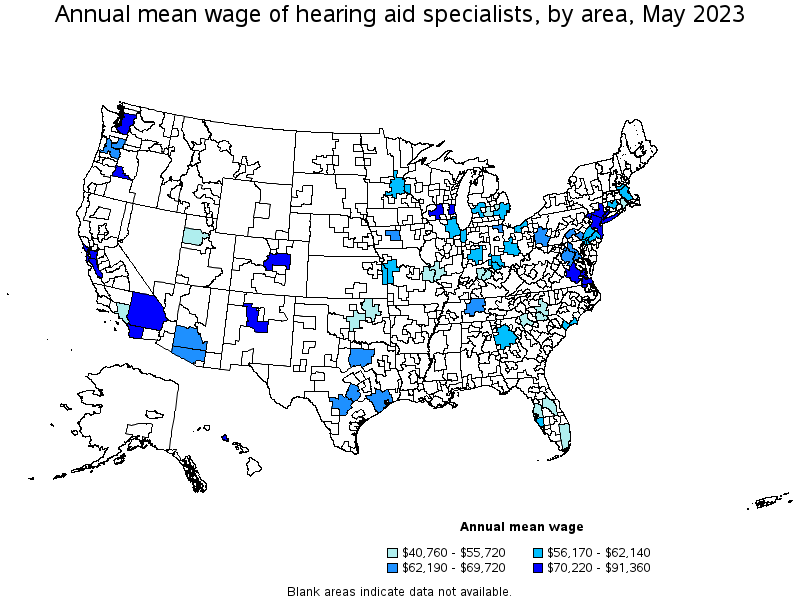
Top paying metropolitan areas for Hearing Aid Specialists:
| Metropolitan area | Employment (1) | Employment per thousand jobs | Location quotient (9) | Hourly mean wage | Annual mean wage (2) |
|---|---|---|---|---|---|
| New York-Newark-Jersey City, NY-NJ-PA | 340 | 0.04 | 0.52 | $ 43.92 | $ 91,360 |
| San Francisco-Oakland-Hayward, CA | 100 | 0.04 | 0.64 | $ 40.19 | $ 83,580 |
| San Jose-Sunnyvale-Santa Clara, CA | (8) | (8) | (8) | $ 39.78 | $ 82,740 |
| Urban Honolulu, HI | 70 | 0.16 | 2.44 | $ 39.66 | $ 82,490 |
| Richmond, VA | 50 | 0.07 | 1.07 | $ 38.70 | $ 80,490 |
| Albuquerque, NM | 40 | 0.09 | 1.39 | $ 38.62 | $ 80,340 |
| Virginia Beach-Norfolk-Newport News, VA-NC | 60 | 0.08 | 1.14 | $ 38.56 | $ 80,210 |
| San Diego-Carlsbad, CA | (8) | (8) | (8) | $ 37.69 | $ 78,400 |
| Riverside-San Bernardino-Ontario, CA | (8) | (8) | (8) | $ 36.34 | $ 75,580 |
| Bend-Redmond, OR | 40 | 0.47 | 6.89 | $ 36.20 | $ 75,300 |
These estimates are calculated with data collected from employers in all industry sectors, all metropolitan and nonmetropolitan areas, and all states and the District of Columbia. The top employment and wage figures are provided above. The complete list is available in the downloadable XLS files.
The percentile wage estimate is the value of a wage below which a certain percent of workers fall. The median wage is the 50th percentile wage estimate—50 percent of workers earn less than the median and 50 percent of workers earn more than the median. More about percentile wages.
(1) Estimates for detailed occupations do not sum to the totals because the totals include occupations not shown separately. Estimates do not include self-employed workers.
(2) Annual wages have been calculated by multiplying the hourly mean wage by a "year-round, full-time" hours figure of 2,080 hours; for those occupations where there is not an hourly wage published, the annual wage has been directly calculated from the reported survey data.
(3) The relative standard error (RSE) is a measure of the reliability of a survey statistic. The smaller the relative standard error, the more precise the estimate.
(7) The value is less than .005 percent of industry employment.
(8) Estimate not released.
(9) The location quotient is the ratio of the area concentration of occupational employment to the national average concentration. A location quotient greater than one indicates the occupation has a higher share of employment than average, and a location quotient less than one indicates the occupation is less prevalent in the area than average.
Other OEWS estimates and related information:
May 2023 National Occupational Employment and Wage Estimates
May 2023 State Occupational Employment and Wage Estimates
May 2023 Metropolitan and Nonmetropolitan Area Occupational Employment and Wage Estimates
May 2023 National Industry-Specific Occupational Employment and Wage Estimates
Last Modified Date: April 3, 2024