
An official website of the United States government
An official website of the United States government
The .gov means it's official.
Federal government websites often end in .gov or .mil. Before sharing sensitive information,
make sure you're on a federal government site.
The site is secure.
The
https:// ensures that you are connecting to the official website and that any
information you provide is encrypted and transmitted securely.
Observe gambling operation for irregular activities such as cheating or theft by either employees or patrons. Investigate potential threats to gambling assets such as money, chips, and gambling equipment. Act as oversight and security agent for management and customers.
Employment estimate and mean wage estimates for Gambling Surveillance Officers and Gambling Investigators:
| Employment (1) | Employment RSE (3) |
Mean hourly wage |
Mean annual wage (2) |
Wage RSE (3) |
|---|---|---|---|---|
| 10,660 | 5.2 % | $ 20.41 | $ 42,460 | 0.8 % |
Percentile wage estimates for Gambling Surveillance Officers and Gambling Investigators:
| Percentile | 10% | 25% | 50% (Median) |
75% | 90% |
|---|---|---|---|---|---|
| Hourly Wage | $ 14.32 | $ 16.86 | $ 18.85 | $ 22.40 | $ 27.82 |
| Annual Wage (2) | $ 29,790 | $ 35,080 | $ 39,210 | $ 46,590 | $ 57,870 |
Industries with the highest published employment and wages for Gambling Surveillance Officers and Gambling Investigators are provided. For a list of all industries with employment in Gambling Surveillance Officers and Gambling Investigators, see the Create Customized Tables function.
Industries with the highest levels of employment in Gambling Surveillance Officers and Gambling Investigators:
| Industry | Employment (1) | Percent of industry employment | Hourly mean wage | Annual mean wage (2) |
|---|---|---|---|---|
| Gambling Industries | 4,790 | 2.21 | $ 19.13 | $ 39,790 |
| Traveler Accommodation | 2,700 | 0.15 | $ 20.57 | $ 42,780 |
| Local Government, excluding Schools and Hospitals (OEWS Designation) | 1,290 | 0.02 | $ 19.94 | $ 41,470 |
| State Government, excluding Schools and Hospitals (OEWS Designation) | 430 | 0.02 | $ 34.77 | $ 72,320 |
| Spectator Sports | 220 | 0.15 | $ 18.65 | $ 38,790 |
Industries with the highest concentration of employment in Gambling Surveillance Officers and Gambling Investigators:
| Industry | Employment (1) | Percent of industry employment | Hourly mean wage | Annual mean wage (2) |
|---|---|---|---|---|
| Gambling Industries | 4,790 | 2.21 | $ 19.13 | $ 39,790 |
| Spectator Sports | 220 | 0.15 | $ 18.65 | $ 38,790 |
| Traveler Accommodation | 2,700 | 0.15 | $ 20.57 | $ 42,780 |
| State Government, excluding Schools and Hospitals (OEWS Designation) | 430 | 0.02 | $ 34.77 | $ 72,320 |
| Local Government, excluding Schools and Hospitals (OEWS Designation) | 1,290 | 0.02 | $ 19.94 | $ 41,470 |
Top paying industries for Gambling Surveillance Officers and Gambling Investigators:
| Industry | Employment (1) | Percent of industry employment | Hourly mean wage | Annual mean wage (2) |
|---|---|---|---|---|
| State Government, excluding Schools and Hospitals (OEWS Designation) | 430 | 0.02 | $ 34.77 | $ 72,320 |
| Investigation and Security Services | 140 | 0.01 | $ 26.50 | $ 55,120 |
| Traveler Accommodation | 2,700 | 0.15 | $ 20.57 | $ 42,780 |
| Local Government, excluding Schools and Hospitals (OEWS Designation) | 1,290 | 0.02 | $ 19.94 | $ 41,470 |
| Other Support Services | (8) | (8) | $ 19.18 | $ 39,890 |
States and areas with the highest published employment, location quotients, and wages for Gambling Surveillance Officers and Gambling Investigators are provided. For a list of all areas with employment in Gambling Surveillance Officers and Gambling Investigators, see the Create Customized Tables function.
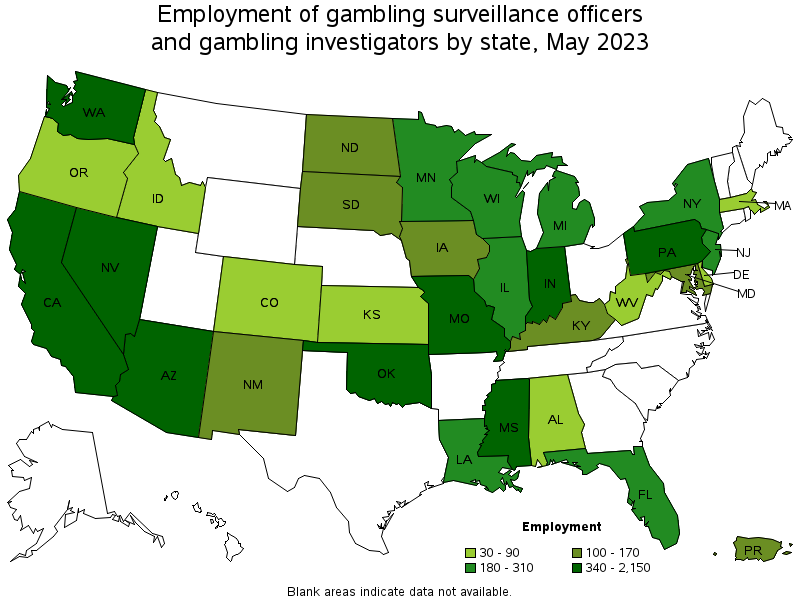
States with the highest employment level in Gambling Surveillance Officers and Gambling Investigators:
| State | Employment (1) | Employment per thousand jobs | Location quotient (9) | Hourly mean wage | Annual mean wage (2) |
|---|---|---|---|---|---|
| California | 2,150 | 0.12 | 1.71 | $ 20.34 | $ 42,310 |
| Oklahoma | 1,540 | 0.92 | 13.16 | $ 16.39 | $ 34,080 |
| Nevada | 720 | 0.49 | 6.96 | $ 22.21 | $ 46,200 |
| Washington | 520 | 0.15 | 2.12 | $ 20.88 | $ 43,440 |
| Pennsylvania | 420 | 0.07 | 1.01 | $ 23.78 | $ 49,470 |
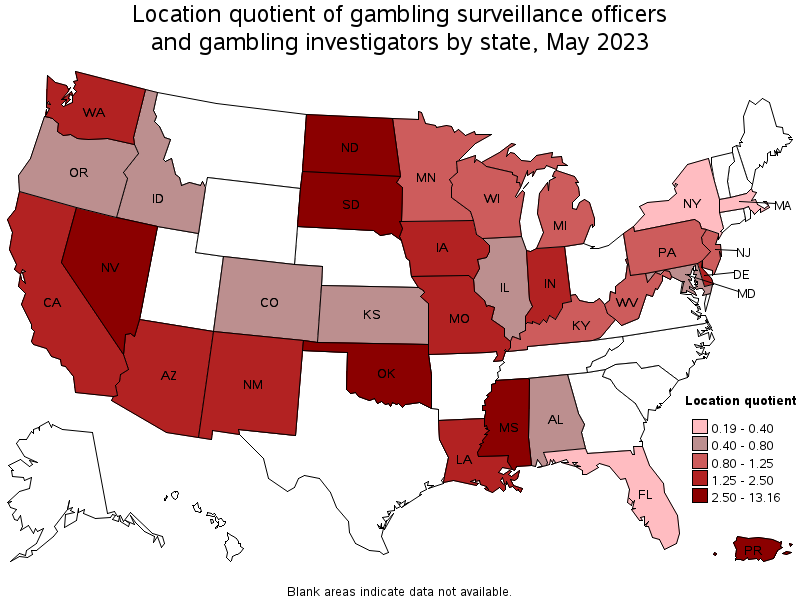
States with the highest concentration of jobs and location quotients in Gambling Surveillance Officers and Gambling Investigators:
| State | Employment (1) | Employment per thousand jobs | Location quotient (9) | Hourly mean wage | Annual mean wage (2) |
|---|---|---|---|---|---|
| Oklahoma | 1,540 | 0.92 | 13.16 | $ 16.39 | $ 34,080 |
| Nevada | 720 | 0.49 | 6.96 | $ 22.21 | $ 46,200 |
| Mississippi | 340 | 0.30 | 4.24 | $ 17.80 | $ 37,020 |
| South Dakota | 100 | 0.23 | 3.34 | $ 17.55 | $ 36,500 |
| North Dakota | 100 | 0.23 | 3.25 | $ 23.16 | $ 48,170 |
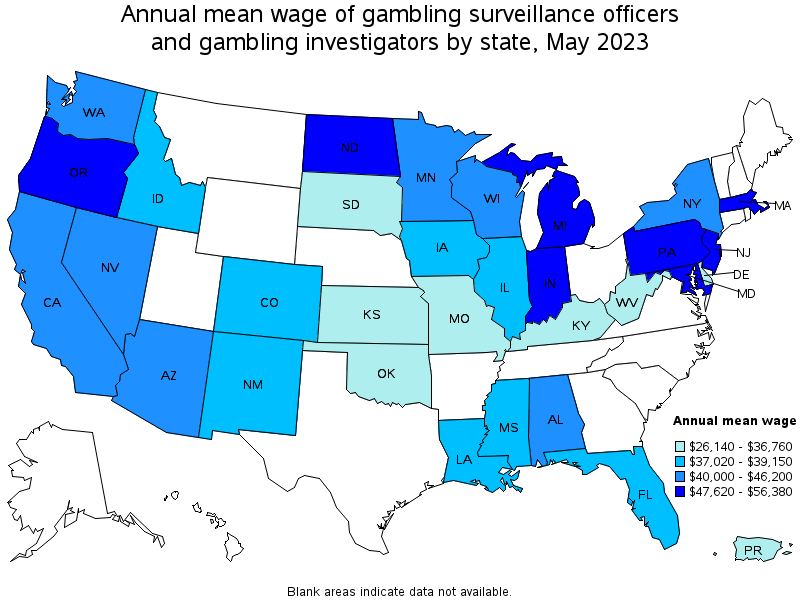
Top paying states for Gambling Surveillance Officers and Gambling Investigators:
| State | Employment (1) | Employment per thousand jobs | Location quotient (9) | Hourly mean wage | Annual mean wage (2) |
|---|---|---|---|---|---|
| Indiana | 340 | 0.11 | 1.54 | $ 27.11 | $ 56,380 |
| Massachusetts | 50 | 0.01 | 0.19 | $ 24.92 | $ 51,840 |
| Pennsylvania | 420 | 0.07 | 1.01 | $ 23.78 | $ 49,470 |
| New Jersey | 310 | 0.07 | 1.06 | $ 23.65 | $ 49,180 |
| Oregon | 70 | 0.04 | 0.53 | $ 23.29 | $ 48,430 |
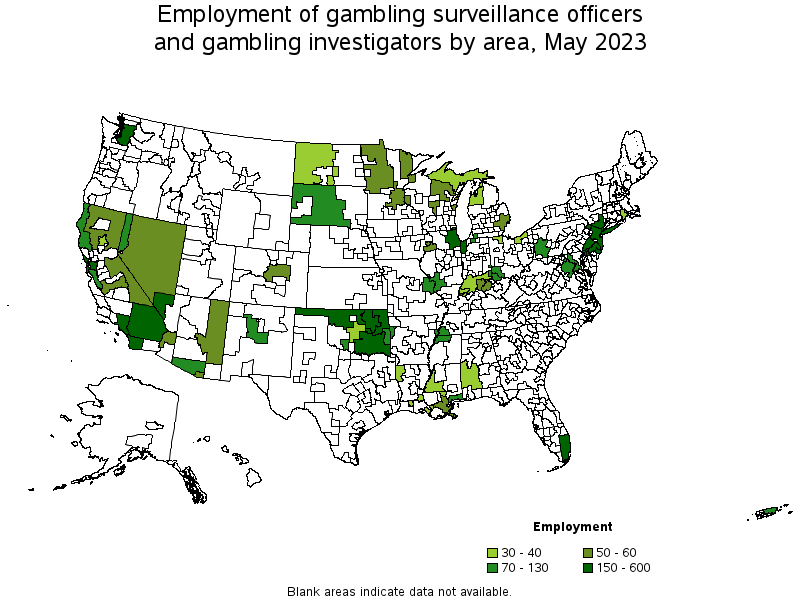
Metropolitan areas with the highest employment level in Gambling Surveillance Officers and Gambling Investigators:
| Metropolitan area | Employment (1) | Employment per thousand jobs | Location quotient (9) | Hourly mean wage | Annual mean wage (2) |
|---|---|---|---|---|---|
| Las Vegas-Henderson-Paradise, NV | 600 | 0.55 | 7.82 | $ 22.69 | $ 47,190 |
| Los Angeles-Long Beach-Anaheim, CA | 520 | 0.08 | 1.19 | $ 19.76 | $ 41,090 |
| Riverside-San Bernardino-Ontario, CA | 310 | 0.18 | 2.62 | $ 20.01 | $ 41,620 |
| Atlantic City-Hammonton, NJ | 260 | 2.05 | 29.20 | $ 22.37 | $ 46,520 |
| Seattle-Tacoma-Bellevue, WA | 250 | 0.12 | 1.73 | $ 21.83 | $ 45,400 |
| Chicago-Naperville-Elgin, IL-IN-WI | 210 | 0.05 | 0.67 | $ 22.87 | $ 47,560 |
| Philadelphia-Camden-Wilmington, PA-NJ-DE-MD | 200 | 0.07 | 1.03 | $ 23.34 | $ 48,550 |
| San Francisco-Oakland-Hayward, CA | 200 | 0.08 | 1.20 | $ 21.46 | $ 44,650 |
| Tulsa, OK | 200 | 0.44 | 6.34 | $ 17.21 | $ 35,800 |
| San Diego-Carlsbad, CA | 200 | 0.13 | 1.83 | $ 20.57 | $ 42,780 |
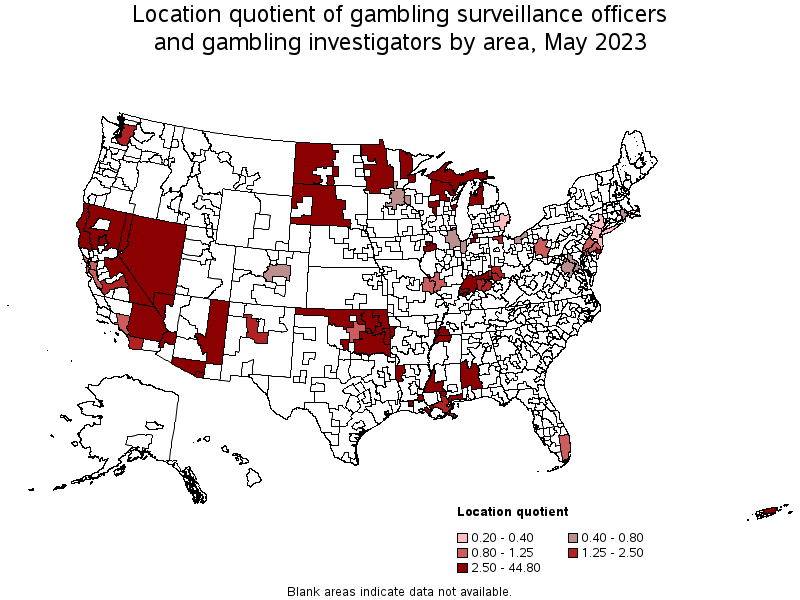
Metropolitan areas with the highest concentration of jobs and location quotients in Gambling Surveillance Officers and Gambling Investigators:
| Metropolitan area | Employment (1) | Employment per thousand jobs | Location quotient (9) | Hourly mean wage | Annual mean wage (2) |
|---|---|---|---|---|---|
| Lawton, OK | 110 | 2.55 | 36.31 | $ 15.57 | $ 32,380 |
| Atlantic City-Hammonton, NJ | 260 | 2.05 | 29.20 | $ 22.37 | $ 46,520 |
| Fort Smith, AR-OK | 110 | 1.05 | 14.92 | $ 17.38 | $ 36,160 |
| Gulfport-Biloxi-Pascagoula, MS | 130 | 0.86 | 12.19 | $ 18.83 | $ 39,160 |
| Las Vegas-Henderson-Paradise, NV | 600 | 0.55 | 7.82 | $ 22.69 | $ 47,190 |
| South Bend-Mishawaka, IN-MI | 70 | 0.53 | 7.55 | $ 24.48 | $ 50,910 |
| Chico, CA | 40 | 0.48 | 6.81 | $ 21.68 | $ 45,100 |
| Tulsa, OK | 200 | 0.44 | 6.34 | $ 17.21 | $ 35,800 |
| Duluth, MN-WI | 50 | 0.43 | 6.05 | $ 18.23 | $ 37,920 |
| Davenport-Moline-Rock Island, IA-IL | 50 | 0.30 | 4.26 | $ 15.56 | $ 32,360 |
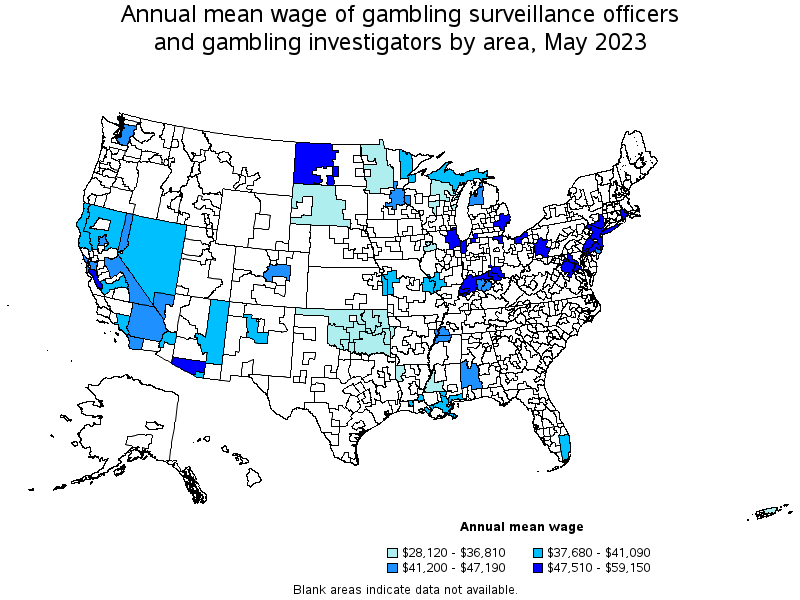
Top paying metropolitan areas for Gambling Surveillance Officers and Gambling Investigators:
| Metropolitan area | Employment (1) | Employment per thousand jobs | Location quotient (9) | Hourly mean wage | Annual mean wage (2) |
|---|---|---|---|---|---|
| Washington-Arlington-Alexandria, DC-VA-MD-WV | 90 | 0.03 | 0.43 | $ 28.44 | $ 59,150 |
| Toledo, OH | 30 | 0.10 | 1.47 | $ 26.79 | $ 55,720 |
| Cleveland-Elyria, OH | 40 | 0.04 | 0.59 | $ 26.35 | $ 54,800 |
| New York-Newark-Jersey City, NY-NJ-PA | 150 | 0.02 | 0.23 | $ 25.86 | $ 53,780 |
| Detroit-Warren-Dearborn, MI | 50 | 0.03 | 0.39 | $ 25.72 | $ 53,500 |
| South Bend-Mishawaka, IN-MI | 70 | 0.53 | 7.55 | $ 24.48 | $ 50,910 |
| Tucson, AZ | 100 | 0.27 | 3.85 | $ 24.03 | $ 49,970 |
| Cincinnati, OH-KY-IN | 110 | 0.11 | 1.50 | $ 23.78 | $ 49,470 |
| Pittsburgh, PA | 90 | 0.08 | 1.17 | $ 23.64 | $ 49,170 |
| Evansville, IN-KY | 30 | 0.22 | 3.12 | $ 23.54 | $ 48,970 |
Nonmetropolitan areas with the highest employment in Gambling Surveillance Officers and Gambling Investigators:
| Nonmetropolitan area | Employment (1) | Employment per thousand jobs | Location quotient (9) | Hourly mean wage | Annual mean wage (2) |
|---|---|---|---|---|---|
| Southeast Oklahoma nonmetropolitan area | 540 | 3.15 | 44.80 | $ 16.27 | $ 33,840 |
| Northeast Oklahoma nonmetropolitan area | 310 | 2.61 | 37.16 | $ 16.27 | $ 33,830 |
| Northwest Oklahoma nonmetropolitan area | 180 | 1.84 | 26.14 | $ 16.00 | $ 33,280 |
| West South Dakota nonmetropolitan area | 70 | 1.19 | 16.91 | $ 16.82 | $ 34,990 |
| North Coast Region of California nonmetropolitan area | 70 | 0.68 | 9.69 | $ 18.64 | $ 38,760 |
Nonmetropolitan areas with the highest concentration of jobs and location quotients in Gambling Surveillance Officers and Gambling Investigators:
| Nonmetropolitan area | Employment (1) | Employment per thousand jobs | Location quotient (9) | Hourly mean wage | Annual mean wage (2) |
|---|---|---|---|---|---|
| Southeast Oklahoma nonmetropolitan area | 540 | 3.15 | 44.80 | $ 16.27 | $ 33,840 |
| Northeast Oklahoma nonmetropolitan area | 310 | 2.61 | 37.16 | $ 16.27 | $ 33,830 |
| Northwest Oklahoma nonmetropolitan area | 180 | 1.84 | 26.14 | $ 16.00 | $ 33,280 |
| West South Dakota nonmetropolitan area | 70 | 1.19 | 16.91 | $ 16.82 | $ 34,990 |
| Eastern Sierra-Mother Lode Region of California nonmetropolitan area | 60 | 1.06 | 15.08 | $ 21.17 | $ 44,030 |
Top paying nonmetropolitan areas for Gambling Surveillance Officers and Gambling Investigators:
| Nonmetropolitan area | Employment (1) | Employment per thousand jobs | Location quotient (9) | Hourly mean wage | Annual mean wage (2) |
|---|---|---|---|---|---|
| Southern Indiana nonmetropolitan area | 40 | 0.24 | 3.40 | $ 24.83 | $ 51,650 |
| West North Dakota nonmetropolitan area | 30 | 0.28 | 4.03 | $ 24.22 | $ 50,370 |
| Northwest Lower Peninsula of Michigan nonmetropolitan area | 30 | 0.28 | 4.04 | $ 22.29 | $ 46,360 |
| Southwest Alabama nonmetropolitan area | 40 | 0.57 | 8.14 | $ 21.88 | $ 45,520 |
| Eastern Sierra-Mother Lode Region of California nonmetropolitan area | 60 | 1.06 | 15.08 | $ 21.17 | $ 44,030 |
These estimates are calculated with data collected from employers in all industry sectors, all metropolitan and nonmetropolitan areas, and all states and the District of Columbia. The top employment and wage figures are provided above. The complete list is available in the downloadable XLS files.
The percentile wage estimate is the value of a wage below which a certain percent of workers fall. The median wage is the 50th percentile wage estimate—50 percent of workers earn less than the median and 50 percent of workers earn more than the median. More about percentile wages.
(1) Estimates for detailed occupations do not sum to the totals because the totals include occupations not shown separately. Estimates do not include self-employed workers.
(2) Annual wages have been calculated by multiplying the hourly mean wage by a "year-round, full-time" hours figure of 2,080 hours; for those occupations where there is not an hourly wage published, the annual wage has been directly calculated from the reported survey data.
(3) The relative standard error (RSE) is a measure of the reliability of a survey statistic. The smaller the relative standard error, the more precise the estimate.
(8) Estimate not released.
(9) The location quotient is the ratio of the area concentration of occupational employment to the national average concentration. A location quotient greater than one indicates the occupation has a higher share of employment than average, and a location quotient less than one indicates the occupation is less prevalent in the area than average.
Other OEWS estimates and related information:
May 2023 National Occupational Employment and Wage Estimates
May 2023 State Occupational Employment and Wage Estimates
May 2023 Metropolitan and Nonmetropolitan Area Occupational Employment and Wage Estimates
May 2023 National Industry-Specific Occupational Employment and Wage Estimates
Last Modified Date: April 3, 2024