
An official website of the United States government
An official website of the United States government
The .gov means it's official.
Federal government websites often end in .gov or .mil. Before sharing sensitive information,
make sure you're on a federal government site.
The site is secure.
The
https:// ensures that you are connecting to the official website and that any
information you provide is encrypted and transmitted securely.
Guide or control vehicular or pedestrian traffic at such places as streets, schools, railroad crossings, or construction sites.
Employment estimate and mean wage estimates for Crossing Guards and Flaggers:
| Employment (1) | Employment RSE (3) |
Mean hourly wage |
Mean annual wage (2) |
Wage RSE (3) |
|---|---|---|---|---|
| 90,780 | 2.9 % | $ 19.54 | $ 40,650 | 0.9 % |
Percentile wage estimates for Crossing Guards and Flaggers:
| Percentile | 10% | 25% | 50% (Median) |
75% | 90% |
|---|---|---|---|---|---|
| Hourly Wage | $ 13.66 | $ 15.23 | $ 17.48 | $ 21.51 | $ 29.18 |
| Annual Wage (2) | $ 28,400 | $ 31,680 | $ 36,370 | $ 44,750 | $ 60,690 |
Industries with the highest published employment and wages for Crossing Guards and Flaggers are provided. For a list of all industries with employment in Crossing Guards and Flaggers, see the Create Customized Tables function.
Industries with the highest levels of employment in Crossing Guards and Flaggers:
| Industry | Employment (1) | Percent of industry employment | Hourly mean wage | Annual mean wage (2) |
|---|---|---|---|---|
| Other Support Services | 34,390 | 10.54 | $ 20.60 | $ 42,840 |
| Local Government, excluding Schools and Hospitals (OEWS Designation) | 33,410 | 0.61 | $ 18.22 | $ 37,900 |
| Elementary and Secondary Schools | 8,960 | 0.10 | $ 17.71 | $ 36,840 |
| Employment Services | 3,670 | 0.10 | $ 16.60 | $ 34,530 |
| Highway, Street, and Bridge Construction | 2,930 | 0.80 | $ 26.39 | $ 54,890 |
Industries with the highest concentration of employment in Crossing Guards and Flaggers:
| Industry | Employment (1) | Percent of industry employment | Hourly mean wage | Annual mean wage (2) |
|---|---|---|---|---|
| Other Support Services | 34,390 | 10.54 | $ 20.60 | $ 42,840 |
| Highway, Street, and Bridge Construction | 2,930 | 0.80 | $ 26.39 | $ 54,890 |
| Local Government, excluding Schools and Hospitals (OEWS Designation) | 33,410 | 0.61 | $ 18.22 | $ 37,900 |
| Utility System Construction | 1,330 | 0.23 | $ 22.03 | $ 45,820 |
| Rental and Leasing Services (5322, 5323, and 5324 only) | 750 | 0.21 | $ 17.73 | $ 36,880 |
Top paying industries for Crossing Guards and Flaggers:
| Industry | Employment (1) | Percent of industry employment | Hourly mean wage | Annual mean wage (2) |
|---|---|---|---|---|
| Electric Power Generation, Transmission and Distribution | 40 | 0.01 | $ 30.35 | $ 63,140 |
| Nonresidential Building Construction | 100 | 0.01 | $ 28.27 | $ 58,800 |
| Highway, Street, and Bridge Construction | 2,930 | 0.80 | $ 26.39 | $ 54,890 |
| Building Equipment Contractors | 380 | 0.02 | $ 25.54 | $ 53,110 |
| Other Specialty Trade Contractors | 870 | 0.11 | $ 24.63 | $ 51,230 |
States and areas with the highest published employment, location quotients, and wages for Crossing Guards and Flaggers are provided. For a list of all areas with employment in Crossing Guards and Flaggers, see the Create Customized Tables function.
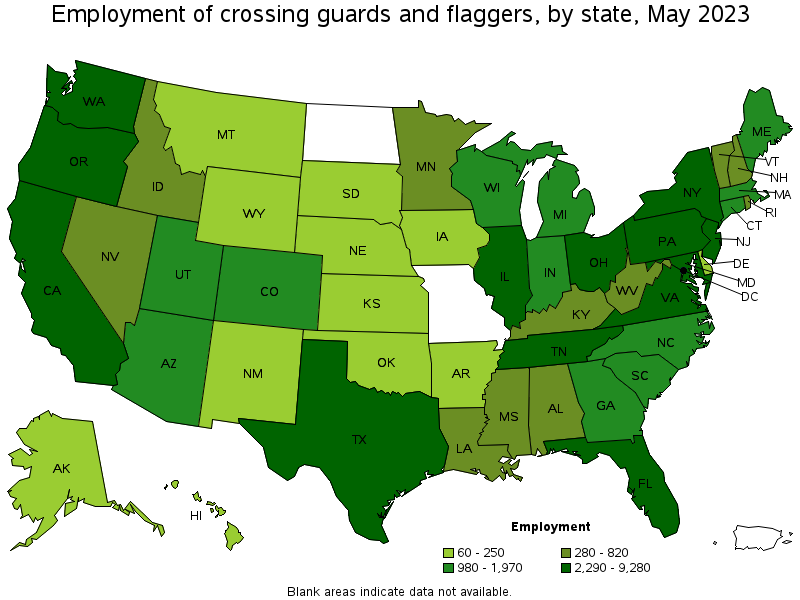
States with the highest employment level in Crossing Guards and Flaggers:
| State | Employment (1) | Employment per thousand jobs | Location quotient (9) | Hourly mean wage | Annual mean wage (2) |
|---|---|---|---|---|---|
| Pennsylvania | 9,280 | 1.56 | 2.61 | $ 18.07 | $ 37,580 |
| California | 8,210 | 0.46 | 0.77 | $ 26.25 | $ 54,590 |
| Florida | 7,870 | 0.82 | 1.38 | $ 16.12 | $ 33,520 |
| New Jersey | 7,620 | 1.81 | 3.03 | $ 19.62 | $ 40,820 |
| New York | 6,710 | 0.71 | 1.19 | $ 21.91 | $ 45,560 |
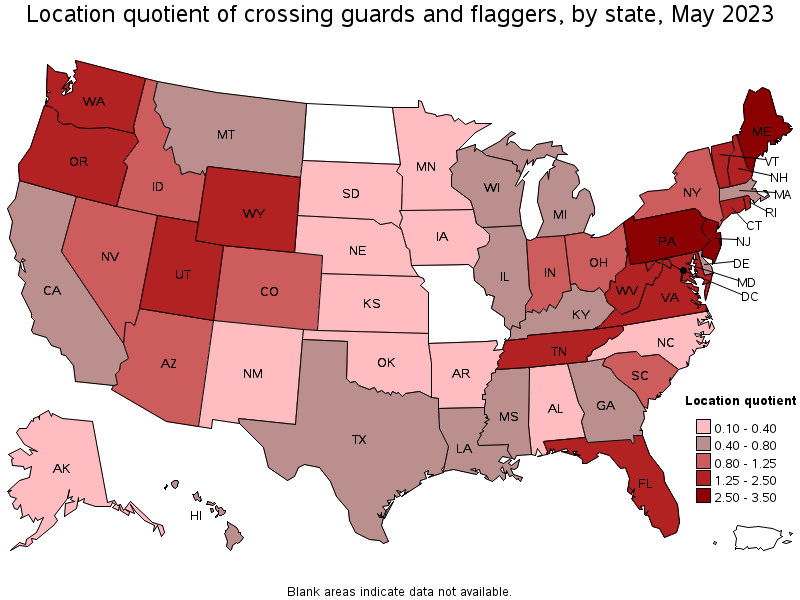
States with the highest concentration of jobs and location quotients in Crossing Guards and Flaggers:
| State | Employment (1) | Employment per thousand jobs | Location quotient (9) | Hourly mean wage | Annual mean wage (2) |
|---|---|---|---|---|---|
| New Jersey | 7,620 | 1.81 | 3.03 | $ 19.62 | $ 40,820 |
| Maine | 1,060 | 1.70 | 2.84 | $ 18.29 | $ 38,040 |
| Pennsylvania | 9,280 | 1.56 | 2.61 | $ 18.07 | $ 37,580 |
| Oregon | 2,290 | 1.18 | 1.97 | $ 23.09 | $ 48,030 |
| Utah | 1,970 | 1.17 | 1.96 | $ 15.77 | $ 32,810 |
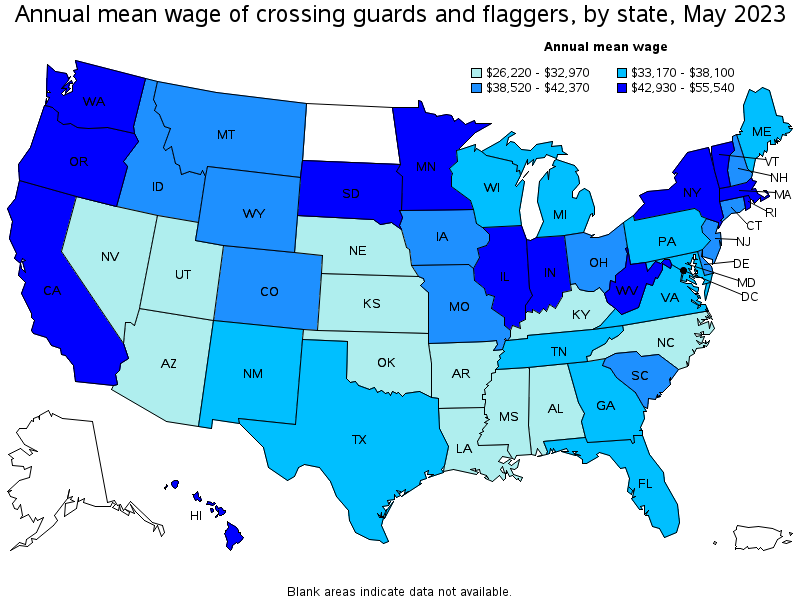
Top paying states for Crossing Guards and Flaggers:
| State | Employment (1) | Employment per thousand jobs | Location quotient (9) | Hourly mean wage | Annual mean wage (2) |
|---|---|---|---|---|---|
| Washington | 2,800 | 0.80 | 1.34 | $ 26.70 | $ 55,540 |
| California | 8,210 | 0.46 | 0.77 | $ 26.25 | $ 54,590 |
| Illinois | 2,770 | 0.46 | 0.77 | $ 23.46 | $ 48,790 |
| Minnesota | 610 | 0.21 | 0.35 | $ 23.11 | $ 48,060 |
| Oregon | 2,290 | 1.18 | 1.97 | $ 23.09 | $ 48,030 |
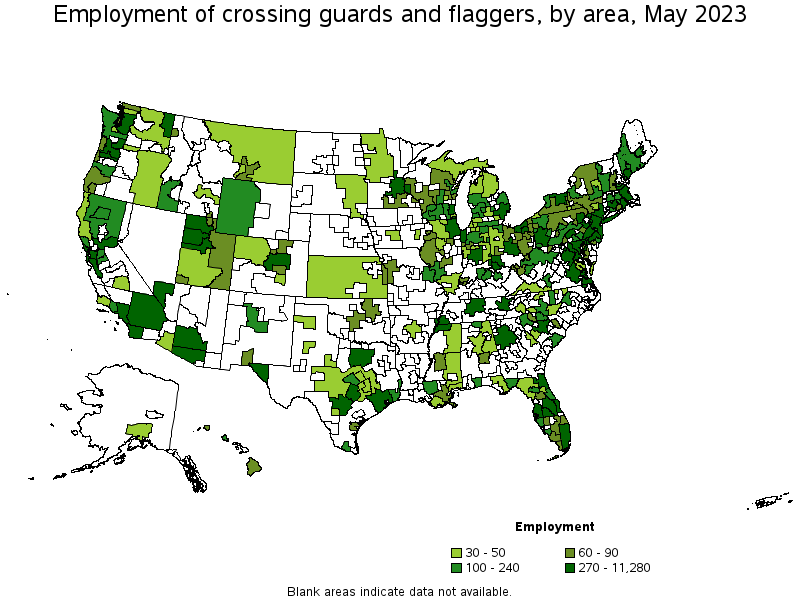
Metropolitan areas with the highest employment level in Crossing Guards and Flaggers:
| Metropolitan area | Employment (1) | Employment per thousand jobs | Location quotient (9) | Hourly mean wage | Annual mean wage (2) |
|---|---|---|---|---|---|
| New York-Newark-Jersey City, NY-NJ-PA | 11,280 | 1.19 | 1.99 | $ 20.82 | $ 43,300 |
| Philadelphia-Camden-Wilmington, PA-NJ-DE-MD | 4,020 | 1.42 | 2.37 | $ 19.07 | $ 39,670 |
| Chicago-Naperville-Elgin, IL-IN-WI | 2,380 | 0.53 | 0.88 | $ 23.16 | $ 48,170 |
| Miami-Fort Lauderdale-West Palm Beach, FL | 2,360 | 0.87 | 1.45 | $ 16.47 | $ 34,250 |
| Los Angeles-Long Beach-Anaheim, CA | 2,350 | 0.38 | 0.63 | $ 26.52 | $ 55,170 |
| Washington-Arlington-Alexandria, DC-VA-MD-WV | 2,280 | 0.74 | 1.23 | $ 19.75 | $ 41,070 |
| Memphis, TN-MS-AR | 2,090 | 3.34 | 5.58 | $ 17.17 | $ 35,710 |
| Pittsburgh, PA | 2,080 | 1.94 | 3.24 | $ 18.63 | $ 38,760 |
| Dallas-Fort Worth-Arlington, TX | 1,780 | 0.45 | 0.75 | $ 15.89 | $ 33,040 |
| Houston-The Woodlands-Sugar Land, TX | 1,780 | 0.56 | 0.94 | $ 17.70 | $ 36,820 |
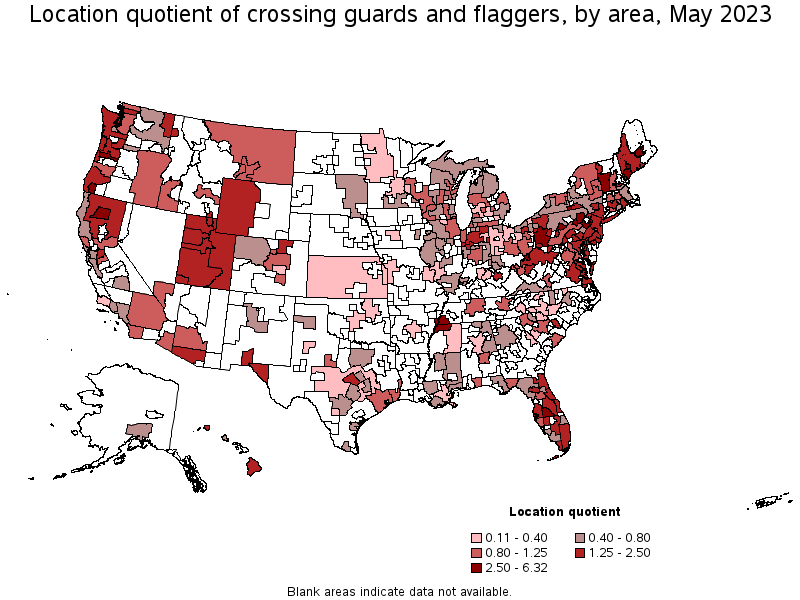
Metropolitan areas with the highest concentration of jobs and location quotients in Crossing Guards and Flaggers:
| Metropolitan area | Employment (1) | Employment per thousand jobs | Location quotient (9) | Hourly mean wage | Annual mean wage (2) |
|---|---|---|---|---|---|
| Lewiston-Auburn, ME | 180 | 3.78 | 6.32 | $ 18.76 | $ 39,020 |
| Memphis, TN-MS-AR | 2,090 | 3.34 | 5.58 | $ 17.17 | $ 35,710 |
| Lakeland-Winter Haven, FL | 690 | 2.68 | 4.48 | $ 13.76 | $ 28,610 |
| Grants Pass, OR | 70 | 2.42 | 4.05 | $ 20.04 | $ 41,680 |
| Scranton--Wilkes-Barre--Hazleton, PA | 520 | 2.06 | 3.45 | $ 19.25 | $ 40,040 |
| State College, PA | 130 | 1.98 | 3.31 | $ 18.73 | $ 38,960 |
| Allentown-Bethlehem-Easton, PA-NJ | 720 | 1.96 | 3.27 | $ 16.94 | $ 35,240 |
| Pittsburgh, PA | 2,080 | 1.94 | 3.24 | $ 18.63 | $ 38,760 |
| Portland-South Portland, ME | 390 | 1.88 | 3.14 | $ 18.61 | $ 38,710 |
| Bloomsburg-Berwick, PA | 80 | 1.87 | 3.14 | $ 16.27 | $ 33,830 |
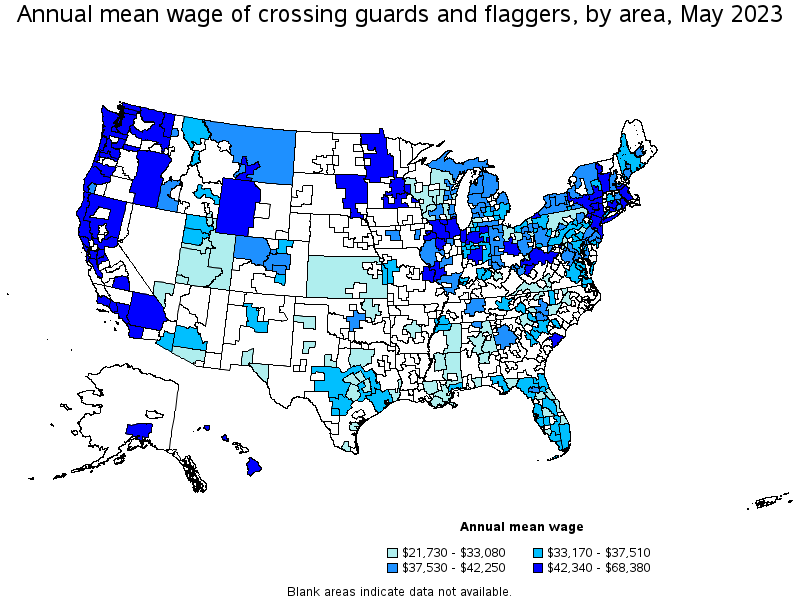
Top paying metropolitan areas for Crossing Guards and Flaggers:
| Metropolitan area | Employment (1) | Employment per thousand jobs | Location quotient (9) | Hourly mean wage | Annual mean wage (2) |
|---|---|---|---|---|---|
| Anchorage, AK | 50 | 0.29 | 0.48 | $ 32.88 | $ 68,380 |
| San Francisco-Oakland-Hayward, CA | 1,030 | 0.43 | 0.71 | $ 30.31 | $ 63,050 |
| Davenport-Moline-Rock Island, IA-IL | 60 | 0.33 | 0.55 | $ 30.20 | $ 62,810 |
| Sacramento--Roseville--Arden-Arcade, CA | 510 | 0.49 | 0.81 | $ 29.97 | $ 62,330 |
| Santa Rosa, CA | 110 | 0.55 | 0.91 | $ 29.15 | $ 60,640 |
| Mount Vernon-Anacortes, WA | 40 | 0.81 | 1.35 | $ 29.04 | $ 60,410 |
| Seattle-Tacoma-Bellevue, WA | 1,460 | 0.70 | 1.17 | $ 28.19 | $ 58,630 |
| Stockton-Lodi, CA | 240 | 0.85 | 1.42 | $ 27.41 | $ 57,010 |
| Bellingham, WA | 60 | 0.63 | 1.05 | $ 27.38 | $ 56,940 |
| Kingston, NY | 50 | 0.96 | 1.61 | $ 27.08 | $ 56,330 |
Nonmetropolitan areas with the highest employment in Crossing Guards and Flaggers:
| Nonmetropolitan area | Employment (1) | Employment per thousand jobs | Location quotient (9) | Hourly mean wage | Annual mean wage (2) |
|---|---|---|---|---|---|
| Northern Indiana nonmetropolitan area | 220 | 1.05 | 1.76 | $ 26.81 | $ 55,760 |
| Southern Vermont nonmetropolitan area | 190 | 1.83 | 3.06 | $ 20.78 | $ 43,220 |
| Southwest Maine nonmetropolitan area | 170 | 0.92 | 1.53 | $ 17.08 | $ 35,530 |
| Balance of Lower Peninsula of Michigan nonmetropolitan area | 150 | 0.57 | 0.95 | $ 19.84 | $ 41,260 |
| Northern West Virginia nonmetropolitan area | 140 | 1.02 | 1.71 | $ 20.36 | $ 42,340 |
Nonmetropolitan areas with the highest concentration of jobs and location quotients in Crossing Guards and Flaggers:
| Nonmetropolitan area | Employment (1) | Employment per thousand jobs | Location quotient (9) | Hourly mean wage | Annual mean wage (2) |
|---|---|---|---|---|---|
| Southern Vermont nonmetropolitan area | 190 | 1.83 | 3.06 | $ 20.78 | $ 43,220 |
| Maryland nonmetropolitan area | 80 | 1.29 | 2.16 | $ 18.06 | $ 37,550 |
| North Valley-Northern Mountains Region of California nonmetropolitan area | 130 | 1.28 | 2.15 | $ 28.39 | $ 59,050 |
| Northern Indiana nonmetropolitan area | 220 | 1.05 | 1.76 | $ 26.81 | $ 55,760 |
| Northern West Virginia nonmetropolitan area | 140 | 1.02 | 1.71 | $ 20.36 | $ 42,340 |
Top paying nonmetropolitan areas for Crossing Guards and Flaggers:
| Nonmetropolitan area | Employment (1) | Employment per thousand jobs | Location quotient (9) | Hourly mean wage | Annual mean wage (2) |
|---|---|---|---|---|---|
| North Coast Region of California nonmetropolitan area | 50 | 0.44 | 0.74 | $ 30.40 | $ 63,230 |
| Western Washington nonmetropolitan area | 110 | 0.87 | 1.45 | $ 28.74 | $ 59,790 |
| North Valley-Northern Mountains Region of California nonmetropolitan area | 130 | 1.28 | 2.15 | $ 28.39 | $ 59,050 |
| Northern Indiana nonmetropolitan area | 220 | 1.05 | 1.76 | $ 26.81 | $ 55,760 |
| Eastern Washington nonmetropolitan area | 40 | 0.40 | 0.67 | $ 25.67 | $ 53,390 |
These estimates are calculated with data collected from employers in all industry sectors, all metropolitan and nonmetropolitan areas, and all states and the District of Columbia. The top employment and wage figures are provided above. The complete list is available in the downloadable XLS files.
The percentile wage estimate is the value of a wage below which a certain percent of workers fall. The median wage is the 50th percentile wage estimate—50 percent of workers earn less than the median and 50 percent of workers earn more than the median. More about percentile wages.
(1) Estimates for detailed occupations do not sum to the totals because the totals include occupations not shown separately. Estimates do not include self-employed workers.
(2) Annual wages have been calculated by multiplying the hourly mean wage by a "year-round, full-time" hours figure of 2,080 hours; for those occupations where there is not an hourly wage published, the annual wage has been directly calculated from the reported survey data.
(3) The relative standard error (RSE) is a measure of the reliability of a survey statistic. The smaller the relative standard error, the more precise the estimate.
(9) The location quotient is the ratio of the area concentration of occupational employment to the national average concentration. A location quotient greater than one indicates the occupation has a higher share of employment than average, and a location quotient less than one indicates the occupation is less prevalent in the area than average.
Other OEWS estimates and related information:
May 2023 National Occupational Employment and Wage Estimates
May 2023 State Occupational Employment and Wage Estimates
May 2023 Metropolitan and Nonmetropolitan Area Occupational Employment and Wage Estimates
May 2023 National Industry-Specific Occupational Employment and Wage Estimates
Last Modified Date: April 3, 2024