
An official website of the United States government
An official website of the United States government
The .gov means it's official.
Federal government websites often end in .gov or .mil. Before sharing sensitive information,
make sure you're on a federal government site.
The site is secure.
The
https:// ensures that you are connecting to the official website and that any
information you provide is encrypted and transmitted securely.
Landscape or maintain grounds of property using hand or power tools or equipment. Workers typically perform a variety of tasks, which may include any combination of the following: sod laying, mowing, trimming, planting, watering, fertilizing, digging, raking, sprinkler installation, and installation of mortarless segmental concrete masonry wall units. Excludes �Farmworkers and Laborers, Crop, Nursery, and Greenhouse� (45-2092).
Employment estimate and mean wage estimates for Landscaping and Groundskeeping Workers:
| Employment (1) | Employment RSE (3) |
Mean hourly wage |
Mean annual wage (2) |
Wage RSE (3) |
|---|---|---|---|---|
| 929,930 | 0.5 % | $ 19.13 | $ 39,790 | 0.3 % |
Percentile wage estimates for Landscaping and Groundskeeping Workers:
| Percentile | 10% | 25% | 50% (Median) |
75% | 90% |
|---|---|---|---|---|---|
| Hourly Wage | $ 13.98 | $ 16.25 | $ 17.96 | $ 21.81 | $ 24.66 |
| Annual Wage (2) | $ 29,070 | $ 33,810 | $ 37,360 | $ 45,350 | $ 51,290 |
Industries with the highest published employment and wages for Landscaping and Groundskeeping Workers are provided. For a list of all industries with employment in Landscaping and Groundskeeping Workers, see the Create Customized Tables function.
Industries with the highest levels of employment in Landscaping and Groundskeeping Workers:
| Industry | Employment (1) | Percent of industry employment | Hourly mean wage | Annual mean wage (2) |
|---|---|---|---|---|
| Services to Buildings and Dwellings | 564,160 | 25.12 | $ 19.46 | $ 40,480 |
| Other Amusement and Recreation Industries | 88,310 | 6.47 | $ 16.53 | $ 34,390 |
| Local Government, excluding Schools and Hospitals (OEWS Designation) | 76,540 | 1.39 | $ 20.08 | $ 41,770 |
| Real Estate | 27,740 | 1.53 | $ 18.55 | $ 38,590 |
| Employment Services | 18,640 | 0.50 | $ 16.61 | $ 34,550 |
Industries with the highest concentration of employment in Landscaping and Groundskeeping Workers:
| Industry | Employment (1) | Percent of industry employment | Hourly mean wage | Annual mean wage (2) |
|---|---|---|---|---|
| Services to Buildings and Dwellings | 564,160 | 25.12 | $ 19.46 | $ 40,480 |
| Death Care Services | 12,590 | 9.17 | $ 18.97 | $ 39,460 |
| RV (Recreational Vehicle) Parks and Recreational Camps | 4,200 | 6.52 | $ 16.64 | $ 34,600 |
| Other Amusement and Recreation Industries | 88,310 | 6.47 | $ 16.53 | $ 34,390 |
| Lawn and Garden Equipment and Supplies Retailers | 7,660 | 3.96 | $ 18.35 | $ 38,160 |
Top paying industries for Landscaping and Groundskeeping Workers:
| Industry | Employment (1) | Percent of industry employment | Hourly mean wage | Annual mean wage (2) |
|---|---|---|---|---|
| Federal, State, and Local Government, excluding State and Local Government Schools and Hospitals and the U.S. Postal Service (OEWS Designation) | 540 | 0.03 | $ 28.02 | $ 58,290 |
| Insurance Carriers | 60 | 0.01 | $ 26.16 | $ 54,410 |
| Electric Power Generation, Transmission and Distribution | 170 | 0.04 | $ 25.87 | $ 53,800 |
| Web Search Portals, Libraries, Archives, and Other Information Services | 30 | 0.02 | $ 25.24 | $ 52,500 |
| Navigational, Measuring, Electromedical, and Control Instruments Manufacturing | 50 | 0.01 | $ 25.13 | $ 52,260 |
States and areas with the highest published employment, location quotients, and wages for Landscaping and Groundskeeping Workers are provided. For a list of all areas with employment in Landscaping and Groundskeeping Workers, see the Create Customized Tables function.
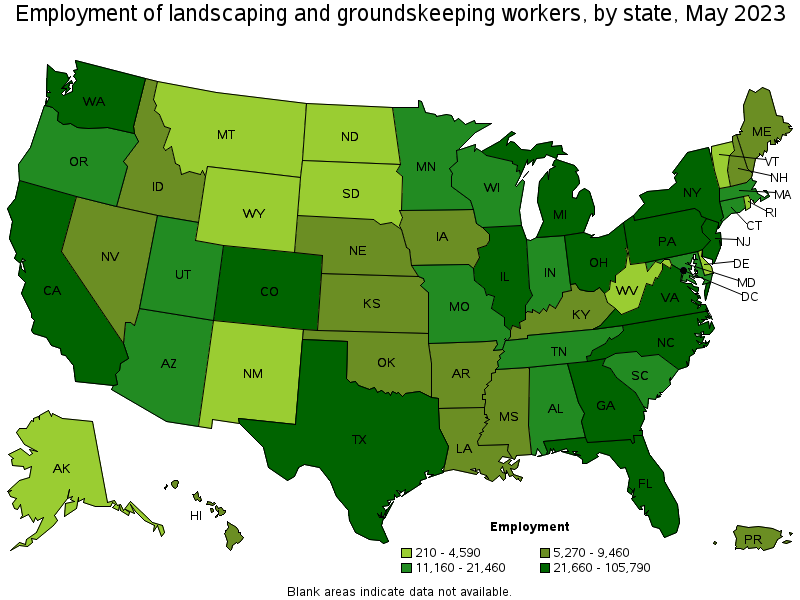
States with the highest employment level in Landscaping and Groundskeeping Workers:
| State | Employment (1) | Employment per thousand jobs | Location quotient (9) | Hourly mean wage | Annual mean wage (2) |
|---|---|---|---|---|---|
| California | 105,790 | 5.89 | 0.96 | $ 21.48 | $ 44,680 |
| Florida | 82,770 | 8.65 | 1.41 | $ 17.42 | $ 36,230 |
| Texas | 68,500 | 5.05 | 0.83 | $ 17.13 | $ 35,630 |
| New York | 49,160 | 5.23 | 0.85 | $ 21.28 | $ 44,250 |
| Illinois | 37,290 | 6.20 | 1.01 | $ 20.46 | $ 42,550 |
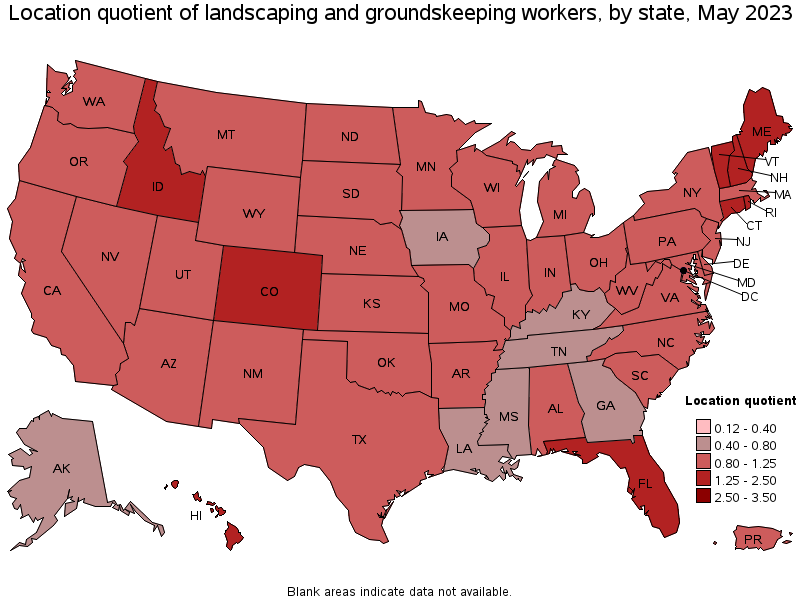
States with the highest concentration of jobs and location quotients in Landscaping and Groundskeeping Workers:
| State | Employment (1) | Employment per thousand jobs | Location quotient (9) | Hourly mean wage | Annual mean wage (2) |
|---|---|---|---|---|---|
| Hawaii | 6,870 | 11.14 | 1.82 | $ 20.67 | $ 42,980 |
| Rhode Island | 4,480 | 9.18 | 1.50 | $ 21.10 | $ 43,880 |
| Vermont | 2,710 | 9.01 | 1.47 | $ 21.21 | $ 44,120 |
| Idaho | 7,300 | 8.87 | 1.45 | $ 19.13 | $ 39,800 |
| Florida | 82,770 | 8.65 | 1.41 | $ 17.42 | $ 36,230 |
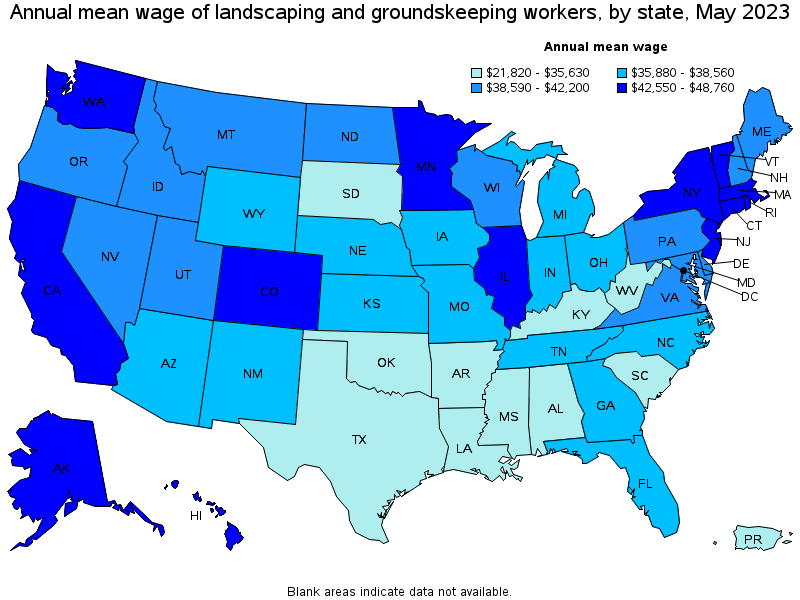
Top paying states for Landscaping and Groundskeeping Workers:
| State | Employment (1) | Employment per thousand jobs | Location quotient (9) | Hourly mean wage | Annual mean wage (2) |
|---|---|---|---|---|---|
| Massachusetts | 21,460 | 5.89 | 0.96 | $ 23.44 | $ 48,760 |
| District of Columbia | 530 | 0.75 | 0.12 | $ 23.11 | $ 48,060 |
| Washington | 21,890 | 6.26 | 1.02 | $ 23.08 | $ 48,010 |
| Alaska | 920 | 2.96 | 0.48 | $ 22.29 | $ 46,360 |
| Connecticut | 13,550 | 8.16 | 1.33 | $ 21.79 | $ 45,330 |
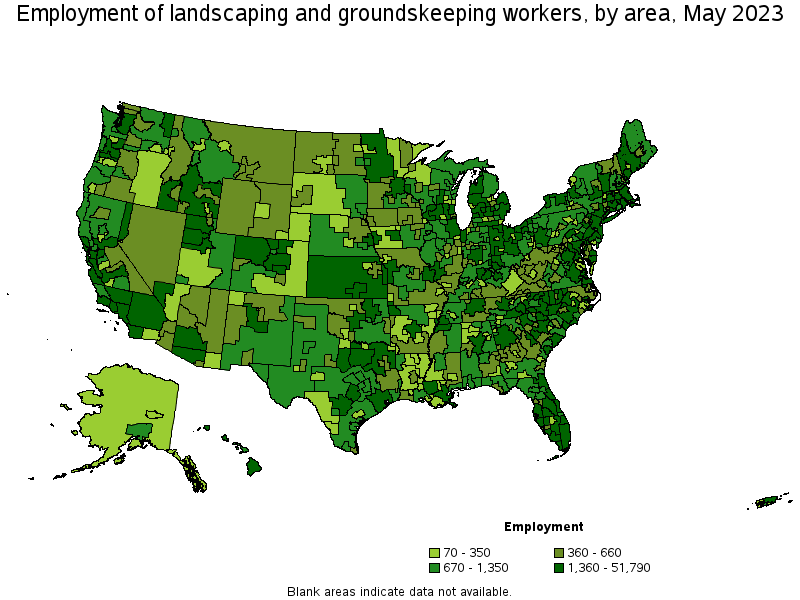
Metropolitan areas with the highest employment level in Landscaping and Groundskeeping Workers:
| Metropolitan area | Employment (1) | Employment per thousand jobs | Location quotient (9) | Hourly mean wage | Annual mean wage (2) |
|---|---|---|---|---|---|
| New York-Newark-Jersey City, NY-NJ-PA | 51,790 | 5.45 | 0.89 | $ 21.87 | $ 45,480 |
| Chicago-Naperville-Elgin, IL-IN-WI | 28,920 | 6.42 | 1.05 | $ 20.89 | $ 43,460 |
| Los Angeles-Long Beach-Anaheim, CA | 27,930 | 4.51 | 0.74 | $ 20.93 | $ 43,530 |
| Dallas-Fort Worth-Arlington, TX | 21,810 | 5.50 | 0.90 | $ 18.14 | $ 37,730 |
| Miami-Fort Lauderdale-West Palm Beach, FL | 20,490 | 7.53 | 1.23 | $ 17.75 | $ 36,920 |
| Philadelphia-Camden-Wilmington, PA-NJ-DE-MD | 18,430 | 6.51 | 1.06 | $ 19.76 | $ 41,110 |
| Washington-Arlington-Alexandria, DC-VA-MD-WV | 16,680 | 5.39 | 0.88 | $ 20.55 | $ 42,750 |
| Houston-The Woodlands-Sugar Land, TX | 16,050 | 5.05 | 0.82 | $ 16.91 | $ 35,160 |
| Phoenix-Mesa-Scottsdale, AZ | 15,270 | 6.67 | 1.09 | $ 18.73 | $ 38,950 |
| Boston-Cambridge-Nashua, MA-NH | 14,680 | 5.31 | 0.87 | $ 23.59 | $ 49,070 |
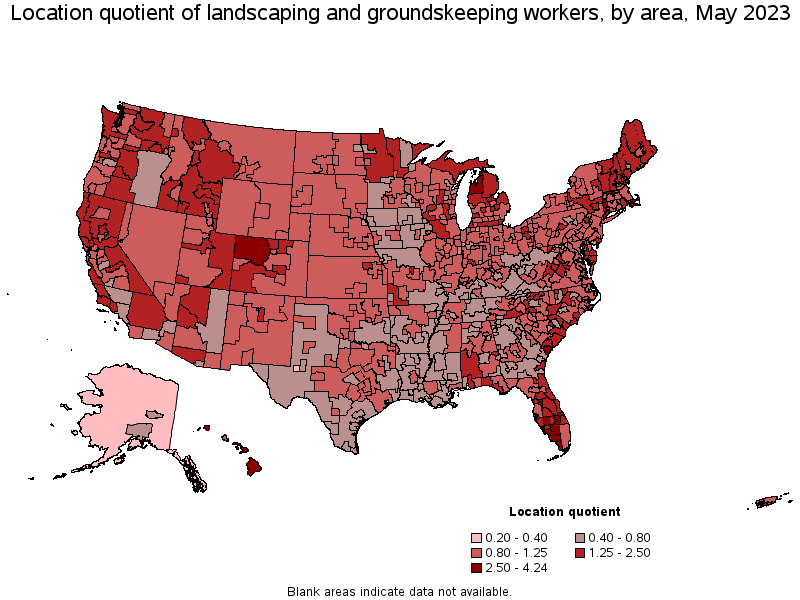
Metropolitan areas with the highest concentration of jobs and location quotients in Landscaping and Groundskeeping Workers:
| Metropolitan area | Employment (1) | Employment per thousand jobs | Location quotient (9) | Hourly mean wage | Annual mean wage (2) |
|---|---|---|---|---|---|
| Naples-Immokalee-Marco Island, FL | 4,230 | 25.94 | 4.24 | $ 18.59 | $ 38,670 |
| Hilton Head Island-Bluffton-Beaufort, SC | 1,840 | 22.85 | 3.73 | $ 17.88 | $ 37,180 |
| Sebastian-Vero Beach, FL | 1,180 | 21.31 | 3.48 | $ 17.19 | $ 35,750 |
| Barnstable Town, MA | 2,000 | 19.71 | 3.22 | $ 23.57 | $ 49,030 |
| Cape Coral-Fort Myers, FL | 5,260 | 18.12 | 2.96 | $ 17.67 | $ 36,750 |
| Ocean City, NJ | 710 | 17.75 | 2.90 | $ 19.72 | $ 41,010 |
| Kahului-Wailuku-Lahaina, HI | 1,340 | 17.66 | 2.88 | $ 21.92 | $ 45,590 |
| The Villages, FL | 630 | 16.56 | 2.70 | $ 16.30 | $ 33,900 |
| Homosassa Springs, FL | 510 | 14.60 | 2.38 | $ 15.50 | $ 32,230 |
| North Port-Sarasota-Bradenton, FL | 4,710 | 14.57 | 2.38 | $ 17.76 | $ 36,950 |
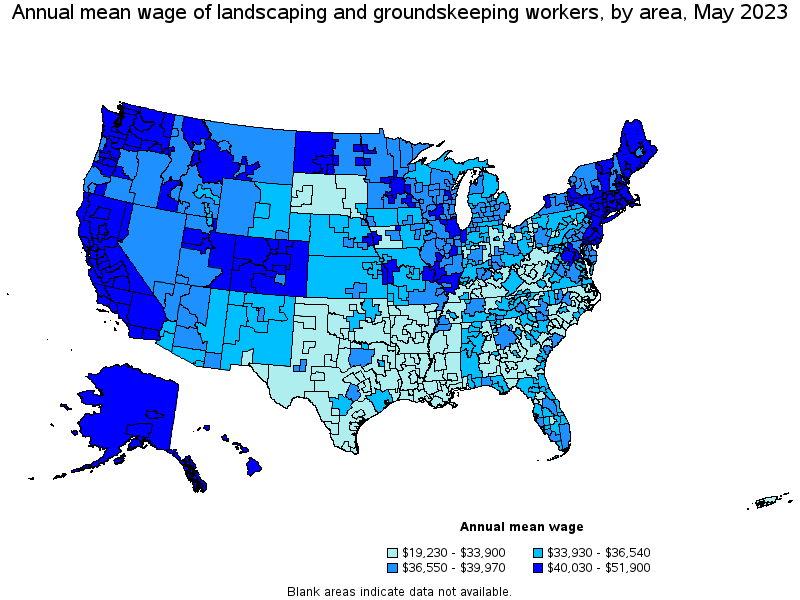
Top paying metropolitan areas for Landscaping and Groundskeeping Workers:
| Metropolitan area | Employment (1) | Employment per thousand jobs | Location quotient (9) | Hourly mean wage | Annual mean wage (2) |
|---|---|---|---|---|---|
| San Francisco-Oakland-Hayward, CA | 12,130 | 5.01 | 0.82 | $ 24.95 | $ 51,900 |
| San Jose-Sunnyvale-Santa Clara, CA | 6,200 | 5.43 | 0.89 | $ 24.88 | $ 51,750 |
| Seattle-Tacoma-Bellevue, WA | 10,880 | 5.23 | 0.85 | $ 24.64 | $ 51,250 |
| Boston-Cambridge-Nashua, MA-NH | 14,680 | 5.31 | 0.87 | $ 23.59 | $ 49,070 |
| Barnstable Town, MA | 2,000 | 19.71 | 3.22 | $ 23.57 | $ 49,030 |
| Santa Rosa, CA | 2,250 | 10.92 | 1.78 | $ 23.24 | $ 48,340 |
| Boulder, CO | 1,290 | 6.62 | 1.08 | $ 23.16 | $ 48,170 |
| Napa, CA | 870 | 11.16 | 1.82 | $ 22.94 | $ 47,720 |
| Fairbanks, AK | 100 | 2.91 | 0.48 | $ 22.60 | $ 47,010 |
| Mount Vernon-Anacortes, WA | 490 | 9.82 | 1.60 | $ 22.46 | $ 46,710 |
Nonmetropolitan areas with the highest employment in Landscaping and Groundskeeping Workers:
| Nonmetropolitan area | Employment (1) | Employment per thousand jobs | Location quotient (9) | Hourly mean wage | Annual mean wage (2) |
|---|---|---|---|---|---|
| Northwest Colorado nonmetropolitan area | 2,330 | 18.45 | 3.01 | $ 22.35 | $ 46,490 |
| North Northeastern Ohio nonmetropolitan area (noncontiguous) | 2,300 | 7.08 | 1.16 | $ 16.25 | $ 33,800 |
| Piedmont North Carolina nonmetropolitan area | 2,300 | 9.01 | 1.47 | $ 15.73 | $ 32,720 |
| Hawaii / Kauai nonmetropolitan area | 2,250 | 22.15 | 3.62 | $ 20.80 | $ 43,260 |
| Balance of Lower Peninsula of Michigan nonmetropolitan area | 2,050 | 7.80 | 1.27 | $ 17.32 | $ 36,020 |
Nonmetropolitan areas with the highest concentration of jobs and location quotients in Landscaping and Groundskeeping Workers:
| Nonmetropolitan area | Employment (1) | Employment per thousand jobs | Location quotient (9) | Hourly mean wage | Annual mean wage (2) |
|---|---|---|---|---|---|
| Massachusetts nonmetropolitan area | 1,430 | 22.77 | 3.72 | $ 24.16 | $ 50,260 |
| Hawaii / Kauai nonmetropolitan area | 2,250 | 22.15 | 3.62 | $ 20.80 | $ 43,260 |
| Northwest Colorado nonmetropolitan area | 2,330 | 18.45 | 3.01 | $ 22.35 | $ 46,490 |
| South Florida nonmetropolitan area | 1,540 | 18.32 | 2.99 | $ 16.97 | $ 35,300 |
| Northwest Lower Peninsula of Michigan nonmetropolitan area | 2,030 | 16.59 | 2.71 | $ 18.69 | $ 38,880 |
Top paying nonmetropolitan areas for Landscaping and Groundskeeping Workers:
| Nonmetropolitan area | Employment (1) | Employment per thousand jobs | Location quotient (9) | Hourly mean wage | Annual mean wage (2) |
|---|---|---|---|---|---|
| Massachusetts nonmetropolitan area | 1,430 | 22.77 | 3.72 | $ 24.16 | $ 50,260 |
| Northwest Colorado nonmetropolitan area | 2,330 | 18.45 | 3.01 | $ 22.35 | $ 46,490 |
| Connecticut nonmetropolitan area | 540 | 16.28 | 2.66 | $ 22.27 | $ 46,310 |
| Alaska nonmetropolitan area | 150 | 1.44 | 0.24 | $ 21.89 | $ 45,530 |
| Western Washington nonmetropolitan area | 1,220 | 9.50 | 1.55 | $ 21.70 | $ 45,140 |
These estimates are calculated with data collected from employers in all industry sectors, all metropolitan and nonmetropolitan areas, and all states and the District of Columbia. The top employment and wage figures are provided above. The complete list is available in the downloadable XLS files.
The percentile wage estimate is the value of a wage below which a certain percent of workers fall. The median wage is the 50th percentile wage estimate—50 percent of workers earn less than the median and 50 percent of workers earn more than the median. More about percentile wages.
(1) Estimates for detailed occupations do not sum to the totals because the totals include occupations not shown separately. Estimates do not include self-employed workers.
(2) Annual wages have been calculated by multiplying the hourly mean wage by a "year-round, full-time" hours figure of 2,080 hours; for those occupations where there is not an hourly wage published, the annual wage has been directly calculated from the reported survey data.
(3) The relative standard error (RSE) is a measure of the reliability of a survey statistic. The smaller the relative standard error, the more precise the estimate.
(9) The location quotient is the ratio of the area concentration of occupational employment to the national average concentration. A location quotient greater than one indicates the occupation has a higher share of employment than average, and a location quotient less than one indicates the occupation is less prevalent in the area than average.
Other OEWS estimates and related information:
May 2023 National Occupational Employment and Wage Estimates
May 2023 State Occupational Employment and Wage Estimates
May 2023 Metropolitan and Nonmetropolitan Area Occupational Employment and Wage Estimates
May 2023 National Industry-Specific Occupational Employment and Wage Estimates
Last Modified Date: April 3, 2024