
An official website of the United States government
An official website of the United States government
The .gov means it's official.
Federal government websites often end in .gov or .mil. Before sharing sensitive information,
make sure you're on a federal government site.
The site is secure.
The
https:// ensures that you are connecting to the official website and that any
information you provide is encrypted and transmitted securely.
Receive and disburse money in establishments other than financial institutions. May use electronic scanners, cash registers, or related equipment. May process credit or debit card transactions and validate checks. Excludes �Gambling Change Persons and Booth Cashiers� (41-2012).
Employment estimate and mean wage estimates for Cashiers:
| Employment (1) | Employment RSE (3) |
Mean hourly wage |
Mean annual wage (2) |
Wage RSE (3) |
|---|---|---|---|---|
| 3,298,660 | 0.5 % | $ 14.77 | $ 30,710 | 0.2 % |
Percentile wage estimates for Cashiers:
| Percentile | 10% | 25% | 50% (Median) |
75% | 90% |
|---|---|---|---|---|---|
| Hourly Wage | $ 10.86 | $ 12.92 | $ 14.29 | $ 16.59 | $ 17.88 |
| Annual Wage (2) | $ 22,580 | $ 26,870 | $ 29,720 | $ 34,500 | $ 37,190 |
Industries with the highest published employment and wages for Cashiers are provided. For a list of all industries with employment in Cashiers, see the Create Customized Tables function.
Industries with the highest levels of employment in Cashiers:
| Industry | Employment (1) | Percent of industry employment | Hourly mean wage | Annual mean wage (2) |
|---|---|---|---|---|
| Food and Beverage Retailers (4451 and 4452 only) | 840,920 | 27.70 | $ 14.96 | $ 31,110 |
| Gasoline Stations | 610,070 | 63.07 | $ 14.12 | $ 29,370 |
| Restaurants and Other Eating Places | 313,150 | 2.88 | $ 13.93 | $ 28,970 |
| Health and Personal Care Retailers | 171,460 | 15.46 | $ 15.71 | $ 32,670 |
| Building Material and Supplies Dealers | 146,630 | 11.82 | $ 15.80 | $ 32,870 |
Industries with the highest concentration of employment in Cashiers:
| Industry | Employment (1) | Percent of industry employment | Hourly mean wage | Annual mean wage (2) |
|---|---|---|---|---|
| Gasoline Stations | 610,070 | 63.07 | $ 14.12 | $ 29,370 |
| Beer, Wine, and Liquor Retailers | 76,400 | 43.97 | $ 15.13 | $ 31,460 |
| Food and Beverage Retailers (4451 and 4452 only) | 840,920 | 27.70 | $ 14.96 | $ 31,110 |
| Health and Personal Care Retailers | 171,460 | 15.46 | $ 15.71 | $ 32,670 |
| Building Material and Supplies Dealers | 146,630 | 11.82 | $ 15.80 | $ 32,870 |
Top paying industries for Cashiers:
| Industry | Employment (1) | Percent of industry employment | Hourly mean wage | Annual mean wage (2) |
|---|---|---|---|---|
| Natural Gas Distribution | 80 | 0.07 | $ 36.66 | $ 76,250 |
| Electric Power Generation, Transmission and Distribution | 600 | 0.15 | $ 21.80 | $ 45,340 |
| Outpatient Care Centers | 150 | 0.01 | $ 21.66 | $ 45,060 |
| Federal, State, and Local Government, excluding State and Local Government Schools and Hospitals and the U.S. Postal Service (OEWS Designation) | 750 | 0.04 | $ 21.54 | $ 44,790 |
| Local Government, excluding Schools and Hospitals (OEWS Designation) | 21,680 | 0.39 | $ 21.30 | $ 44,310 |
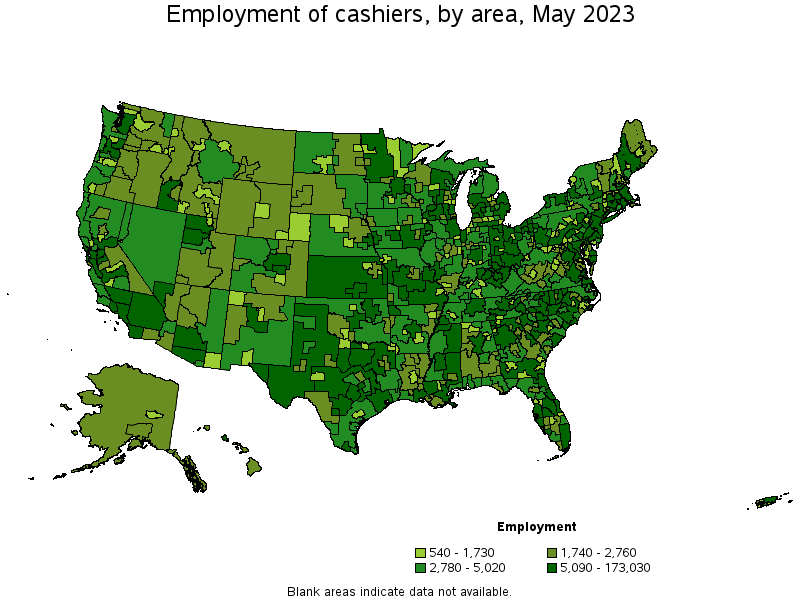
States and areas with the highest published employment, location quotients, and wages for Cashiers are provided. For a list of all areas with employment in Cashiers, see the Create Customized Tables function.
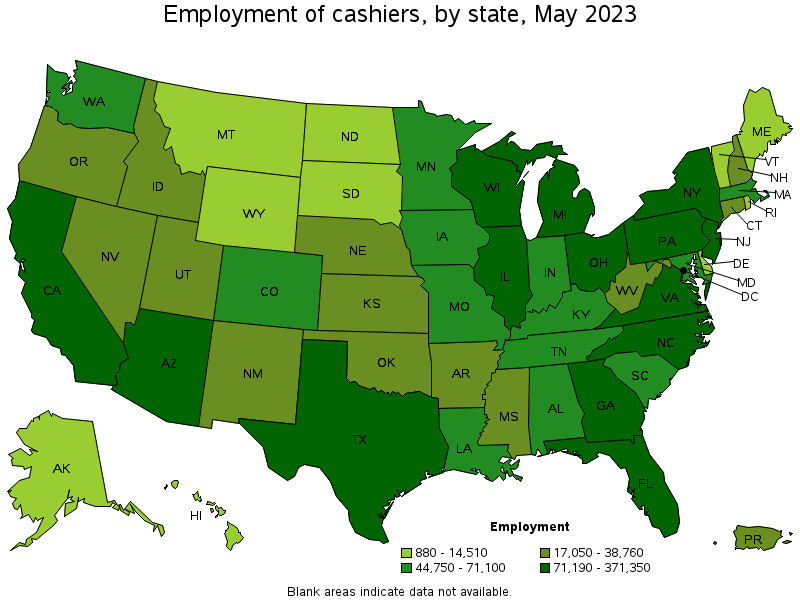
States with the highest employment level in Cashiers:
| State | Employment (1) | Employment per thousand jobs | Location quotient (9) | Hourly mean wage | Annual mean wage (2) |
|---|---|---|---|---|---|
| California | 371,350 | 20.69 | 0.95 | $ 18.02 | $ 37,490 |
| Texas | 282,140 | 20.81 | 0.96 | $ 13.45 | $ 27,970 |
| Florida | 210,950 | 22.05 | 1.01 | $ 13.97 | $ 29,050 |
| New York | 177,810 | 18.93 | 0.87 | $ 17.38 | $ 36,160 |
| Pennsylvania | 125,990 | 21.18 | 0.98 | $ 13.54 | $ 28,160 |
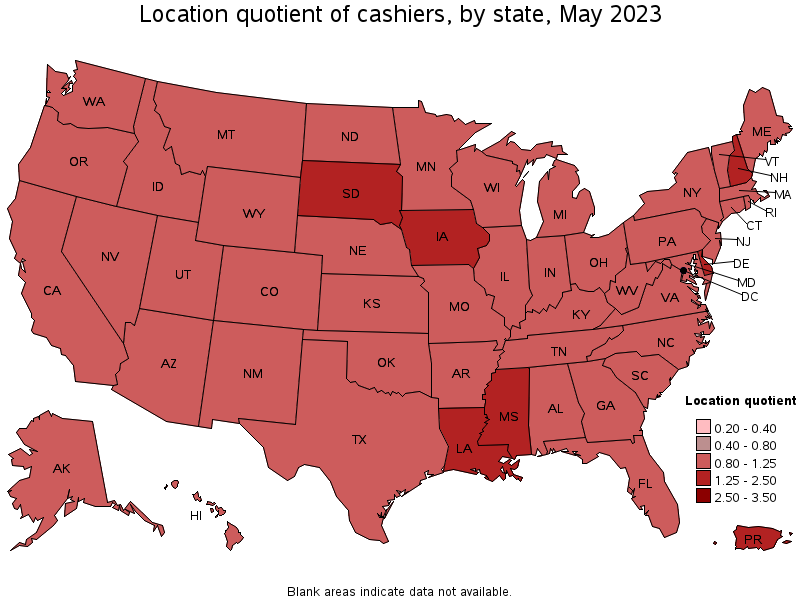
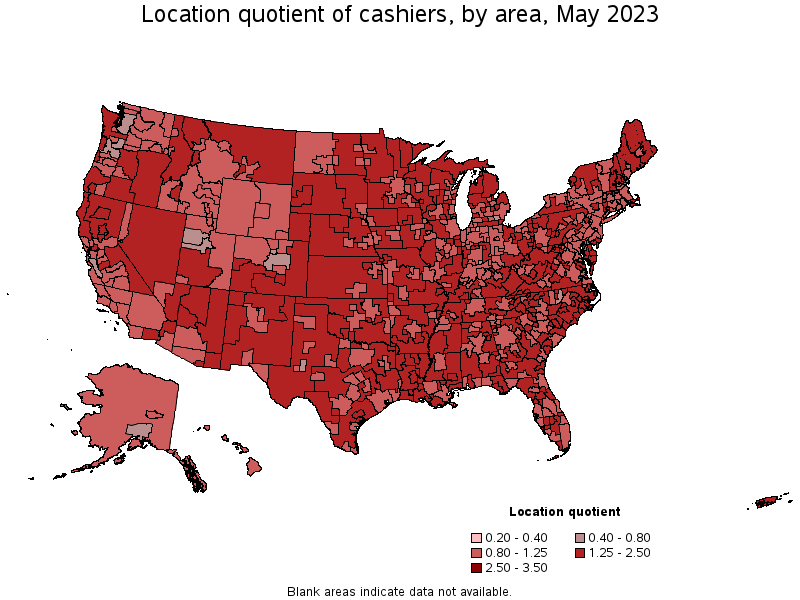
States with the highest concentration of jobs and location quotients in Cashiers:
| State | Employment (1) | Employment per thousand jobs | Location quotient (9) | Hourly mean wage | Annual mean wage (2) |
|---|---|---|---|---|---|
| Mississippi | 35,510 | 30.88 | 1.42 | $ 11.27 | $ 23,430 |
| Iowa | 44,750 | 28.97 | 1.33 | $ 13.73 | $ 28,560 |
| Louisiana | 52,570 | 28.39 | 1.31 | $ 11.85 | $ 24,660 |
| New Hampshire | 19,140 | 28.35 | 1.31 | $ 14.78 | $ 30,730 |
| South Dakota | 12,530 | 28.19 | 1.30 | $ 13.80 | $ 28,710 |
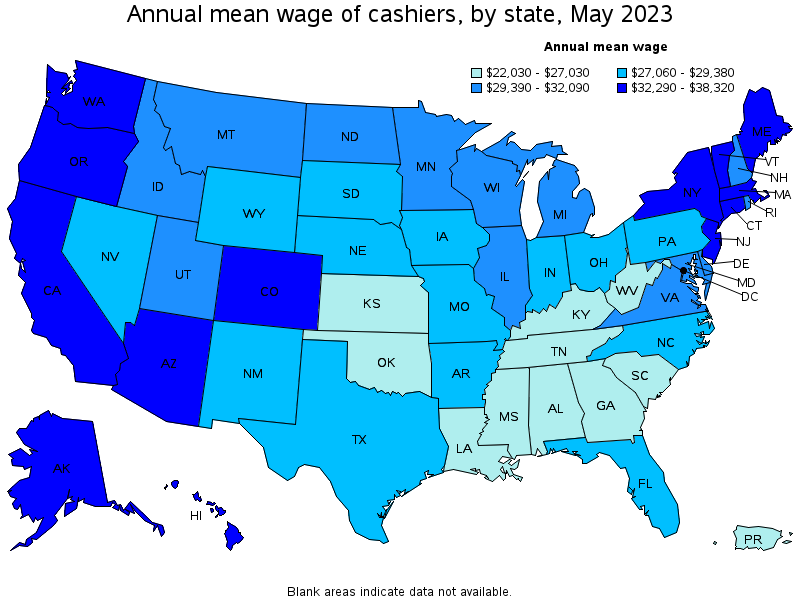
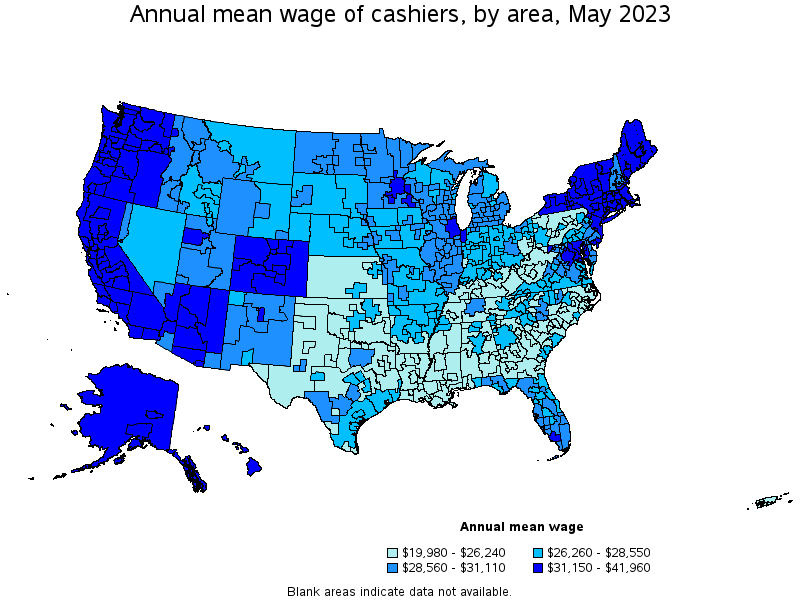
Top paying states for Cashiers:
| State | Employment (1) | Employment per thousand jobs | Location quotient (9) | Hourly mean wage | Annual mean wage (2) |
|---|---|---|---|---|---|
| Washington | 62,930 | 18.00 | 0.83 | $ 18.42 | $ 38,320 |
| California | 371,350 | 20.69 | 0.95 | $ 18.02 | $ 37,490 |
| District of Columbia | 6,820 | 9.72 | 0.45 | $ 17.96 | $ 37,360 |
| New York | 177,810 | 18.93 | 0.87 | $ 17.38 | $ 36,160 |
| Alaska | 5,720 | 18.36 | 0.85 | $ 17.04 | $ 35,430 |
Metropolitan areas with the highest employment level in Cashiers:
| Metropolitan area | Employment (1) | Employment per thousand jobs | Location quotient (9) | Hourly mean wage | Annual mean wage (2) |
|---|---|---|---|---|---|
| New York-Newark-Jersey City, NY-NJ-PA | 173,030 | 18.22 | 0.84 | $ 17.67 | $ 36,750 |
| Los Angeles-Long Beach-Anaheim, CA | 125,060 | 20.22 | 0.93 | $ 17.88 | $ 37,180 |
| Chicago-Naperville-Elgin, IL-IN-WI | 89,090 | 19.77 | 0.91 | $ 15.85 | $ 32,970 |
| Dallas-Fort Worth-Arlington, TX | 74,600 | 18.81 | 0.87 | $ 13.93 | $ 28,970 |
| Houston-The Woodlands-Sugar Land, TX | 65,450 | 20.59 | 0.95 | $ 13.61 | $ 28,320 |
| Philadelphia-Camden-Wilmington, PA-NJ-DE-MD | 61,510 | 21.74 | 1.00 | $ 14.69 | $ 30,560 |
| Atlanta-Sandy Springs-Roswell, GA | 59,110 | 20.98 | 0.97 | $ 13.32 | $ 27,700 |
| Washington-Arlington-Alexandria, DC-VA-MD-WV | 59,010 | 19.08 | 0.88 | $ 16.10 | $ 33,480 |
| Miami-Fort Lauderdale-West Palm Beach, FL | 56,110 | 20.62 | 0.95 | $ 14.09 | $ 29,310 |
| Boston-Cambridge-Nashua, MA-NH | 48,450 | 17.54 | 0.81 | $ 16.82 | $ 34,990 |
Metropolitan areas with the highest concentration of jobs and location quotients in Cashiers:
| Metropolitan area | Employment (1) | Employment per thousand jobs | Location quotient (9) | Hourly mean wage | Annual mean wage (2) |
|---|---|---|---|---|---|
| Lake Havasu City-Kingman, AZ | 2,520 | 46.14 | 2.12 | $ 14.98 | $ 31,150 |
| Ocean City, NJ | 1,790 | 44.44 | 2.05 | $ 15.38 | $ 31,980 |
| Muskegon, MI | 2,500 | 40.52 | 1.87 | $ 13.69 | $ 28,470 |
| Goldsboro, NC | 1,520 | 38.00 | 1.75 | $ 12.11 | $ 25,180 |
| Daphne-Fairhope-Foley, AL | 3,090 | 37.92 | 1.75 | $ 12.33 | $ 25,640 |
| Jacksonville, NC | 1,950 | 37.66 | 1.73 | $ 12.19 | $ 25,360 |
| Myrtle Beach-Conway-North Myrtle Beach, SC-NC | 6,640 | 37.14 | 1.71 | $ 12.47 | $ 25,940 |
| Hattiesburg, MS | 2,310 | 37.01 | 1.70 | $ 10.90 | $ 22,670 |
| Hammond, LA | 1,730 | 37.00 | 1.70 | $ 11.44 | $ 23,790 |
| Rocky Mount, NC | 1,930 | 35.78 | 1.65 | $ 12.28 | $ 25,540 |
Top paying metropolitan areas for Cashiers:
| Metropolitan area | Employment (1) | Employment per thousand jobs | Location quotient (9) | Hourly mean wage | Annual mean wage (2) |
|---|---|---|---|---|---|
| San Jose-Sunnyvale-Santa Clara, CA | 16,670 | 14.60 | 0.67 | $ 20.17 | $ 41,960 |
| San Francisco-Oakland-Hayward, CA | 43,940 | 18.14 | 0.84 | $ 19.66 | $ 40,890 |
| Seattle-Tacoma-Bellevue, WA | 32,480 | 15.62 | 0.72 | $ 19.19 | $ 39,920 |
| Santa Rosa, CA | 5,010 | 24.27 | 1.12 | $ 18.83 | $ 39,170 |
| Mount Vernon-Anacortes, WA | 1,180 | 23.51 | 1.08 | $ 18.49 | $ 38,450 |
| Bremerton-Silverdale, WA | 1,930 | 20.84 | 0.96 | $ 18.46 | $ 38,390 |
| Napa, CA | 1,610 | 20.73 | 0.95 | $ 18.44 | $ 38,360 |
| Vallejo-Fairfield, CA | 3,720 | 27.06 | 1.25 | $ 18.25 | $ 37,950 |
| Salinas, CA | 4,060 | 22.36 | 1.03 | $ 18.11 | $ 37,680 |
| Santa Cruz-Watsonville, CA | 2,610 | 26.64 | 1.23 | $ 18.04 | $ 37,530 |
Nonmetropolitan areas with the highest employment in Cashiers:
| Nonmetropolitan area | Employment (1) | Employment per thousand jobs | Location quotient (9) | Hourly mean wage | Annual mean wage (2) |
|---|---|---|---|---|---|
| Kansas nonmetropolitan area | 11,630 | 29.93 | 1.38 | $ 12.14 | $ 25,240 |
| North Northeastern Ohio nonmetropolitan area (noncontiguous) | 9,370 | 28.79 | 1.33 | $ 12.85 | $ 26,720 |
| Southeast Coastal North Carolina nonmetropolitan area | 8,600 | 34.65 | 1.60 | $ 12.05 | $ 25,050 |
| Piedmont North Carolina nonmetropolitan area | 8,210 | 32.16 | 1.48 | $ 12.43 | $ 25,850 |
| North Texas Region of Texas nonmetropolitan area | 7,820 | 28.08 | 1.29 | $ 12.06 | $ 25,090 |
Nonmetropolitan areas with the highest concentration of jobs and location quotients in Cashiers:
| Nonmetropolitan area | Employment (1) | Employment per thousand jobs | Location quotient (9) | Hourly mean wage | Annual mean wage (2) |
|---|---|---|---|---|---|
| Northeast Coastal North Carolina nonmetropolitan area | 3,980 | 43.12 | 1.99 | $ 12.40 | $ 25,790 |
| Northern New Hampshire nonmetropolitan area | 1,500 | 42.82 | 1.97 | $ 14.33 | $ 29,800 |
| Southwest Iowa nonmetropolitan area | 3,460 | 42.15 | 1.94 | $ 12.76 | $ 26,550 |
| North Missouri nonmetropolitan area | 4,360 | 41.35 | 1.90 | $ 13.44 | $ 27,950 |
| West South Dakota nonmetropolitan area | 2,540 | 40.77 | 1.88 | $ 13.31 | $ 27,680 |
Top paying nonmetropolitan areas for Cashiers:
| Nonmetropolitan area | Employment (1) | Employment per thousand jobs | Location quotient (9) | Hourly mean wage | Annual mean wage (2) |
|---|---|---|---|---|---|
| Northwest Colorado nonmetropolitan area | 2,870 | 22.75 | 1.05 | $ 17.89 | $ 37,210 |
| North Coast Region of California nonmetropolitan area | 3,430 | 32.50 | 1.50 | $ 17.81 | $ 37,050 |
| Western Washington nonmetropolitan area | 3,760 | 29.37 | 1.35 | $ 17.76 | $ 36,940 |
| Eastern Sierra-Mother Lode Region of California nonmetropolitan area | 1,950 | 31.87 | 1.47 | $ 17.65 | $ 36,710 |
| North Valley-Northern Mountains Region of California nonmetropolitan area | 3,070 | 30.15 | 1.39 | $ 17.53 | $ 36,450 |
These estimates are calculated with data collected from employers in all industry sectors, all metropolitan and nonmetropolitan areas, and all states and the District of Columbia. The top employment and wage figures are provided above. The complete list is available in the downloadable XLS files.
The percentile wage estimate is the value of a wage below which a certain percent of workers fall. The median wage is the 50th percentile wage estimate—50 percent of workers earn less than the median and 50 percent of workers earn more than the median. More about percentile wages.
(1) Estimates for detailed occupations do not sum to the totals because the totals include occupations not shown separately. Estimates do not include self-employed workers.
(2) Annual wages have been calculated by multiplying the hourly mean wage by a "year-round, full-time" hours figure of 2,080 hours; for those occupations where there is not an hourly wage published, the annual wage has been directly calculated from the reported survey data.
(3) The relative standard error (RSE) is a measure of the reliability of a survey statistic. The smaller the relative standard error, the more precise the estimate.
(9) The location quotient is the ratio of the area concentration of occupational employment to the national average concentration. A location quotient greater than one indicates the occupation has a higher share of employment than average, and a location quotient less than one indicates the occupation is less prevalent in the area than average.
Other OEWS estimates and related information:
May 2023 National Occupational Employment and Wage Estimates
May 2023 State Occupational Employment and Wage Estimates
May 2023 Metropolitan and Nonmetropolitan Area Occupational Employment and Wage Estimates
May 2023 National Industry-Specific Occupational Employment and Wage Estimates
Last Modified Date: April 3, 2024