
An official website of the United States government
An official website of the United States government
The .gov means it's official.
Federal government websites often end in .gov or .mil. Before sharing sensitive information,
make sure you're on a federal government site.
The site is secure.
The
https:// ensures that you are connecting to the official website and that any
information you provide is encrypted and transmitted securely.
Grade, sort, or classify unprocessed food and other agricultural products by size, weight, color, or condition. Excludes �Agricultural Inspectors� (45-2011).
Employment estimate and mean wage estimates for Graders and Sorters, Agricultural Products:
| Employment (1) | Employment RSE (3) |
Mean hourly wage |
Mean annual wage (2) |
Wage RSE (3) |
|---|---|---|---|---|
| 23,430 | 2.6 % | $ 16.77 | $ 34,880 | 0.7 % |
Percentile wage estimates for Graders and Sorters, Agricultural Products:
| Percentile | 10% | 25% | 50% (Median) |
75% | 90% |
|---|---|---|---|---|---|
| Hourly Wage | $ 13.65 | $ 15.50 | $ 16.52 | $ 17.80 | $ 20.23 |
| Annual Wage (2) | $ 28,400 | $ 32,240 | $ 34,360 | $ 37,020 | $ 42,090 |
Industries with the highest published employment and wages for Graders and Sorters, Agricultural Products are provided. For a list of all industries with employment in Graders and Sorters, Agricultural Products, see the Create Customized Tables function.
Industries with the highest levels of employment in Graders and Sorters, Agricultural Products:
| Industry | Employment (1) | Percent of industry employment | Hourly mean wage | Annual mean wage (2) |
|---|---|---|---|---|
| Support Activities for Crop Production | 8,580 | 2.54 | $ 15.52 | $ 32,290 |
| Animal Slaughtering and Processing | 6,860 | 1.26 | $ 17.32 | $ 36,030 |
| Fruit and Vegetable Preserving and Specialty Food Manufacturing | 1,680 | 0.99 | $ 17.21 | $ 35,800 |
| Merchant Wholesalers, Nondurable Goods (4244 and 4248 only) | 1,510 | 0.15 | $ 17.39 | $ 36,170 |
| Federal, State, and Local Government, excluding State and Local Government Schools and Hospitals and the U.S. Postal Service (OEWS Designation) | 940 | 0.04 | $ 17.06 | $ 35,480 |
Industries with the highest concentration of employment in Graders and Sorters, Agricultural Products:
| Industry | Employment (1) | Percent of industry employment | Hourly mean wage | Annual mean wage (2) |
|---|---|---|---|---|
| Support Activities for Crop Production | 8,580 | 2.54 | $ 15.52 | $ 32,290 |
| Animal Slaughtering and Processing | 6,860 | 1.26 | $ 17.32 | $ 36,030 |
| Fruit and Vegetable Preserving and Specialty Food Manufacturing | 1,680 | 0.99 | $ 17.21 | $ 35,800 |
| Farm Product Raw Material Merchant Wholesalers | 610 | 0.86 | $ 17.92 | $ 37,280 |
| Grain and Oilseed Milling | 160 | 0.24 | $ 18.56 | $ 38,600 |
Top paying industries for Graders and Sorters, Agricultural Products:
| Industry | Employment (1) | Percent of industry employment | Hourly mean wage | Annual mean wage (2) |
|---|---|---|---|---|
| Management of Companies and Enterprises | 40 | (7) | $ 23.43 | $ 48,730 |
| Other Professional, Scientific, and Technical Services | 210 | 0.03 | $ 20.84 | $ 43,340 |
| Architectural, Engineering, and Related Services | 100 | 0.01 | $ 20.59 | $ 42,820 |
| Merchant Wholesalers, Nondurable Goods (4241, 4247, and 4249 only) | 130 | 0.02 | $ 19.69 | $ 40,960 |
| Warehousing and Storage | 230 | 0.01 | $ 18.79 | $ 39,090 |
States and areas with the highest published employment, location quotients, and wages for Graders and Sorters, Agricultural Products are provided. For a list of all areas with employment in Graders and Sorters, Agricultural Products, see the Create Customized Tables function.
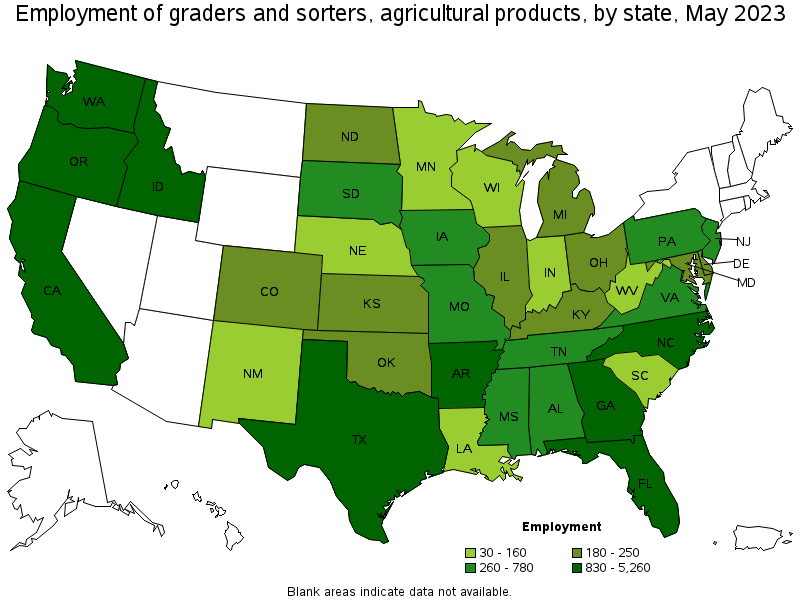
States with the highest employment level in Graders and Sorters, Agricultural Products:
| State | Employment (1) | Employment per thousand jobs | Location quotient (9) | Hourly mean wage | Annual mean wage (2) |
|---|---|---|---|---|---|
| California | 5,260 | 0.29 | 1.90 | $ 17.28 | $ 35,950 |
| Washington | 2,190 | 0.63 | 4.06 | $ 16.98 | $ 35,310 |
| Georgia | 1,840 | 0.39 | 2.51 | $ 16.03 | $ 33,340 |
| Texas | 1,820 | 0.13 | 0.87 | $ 16.16 | $ 33,620 |
| Florida | 1,340 | 0.14 | 0.91 | $ 14.47 | $ 30,090 |
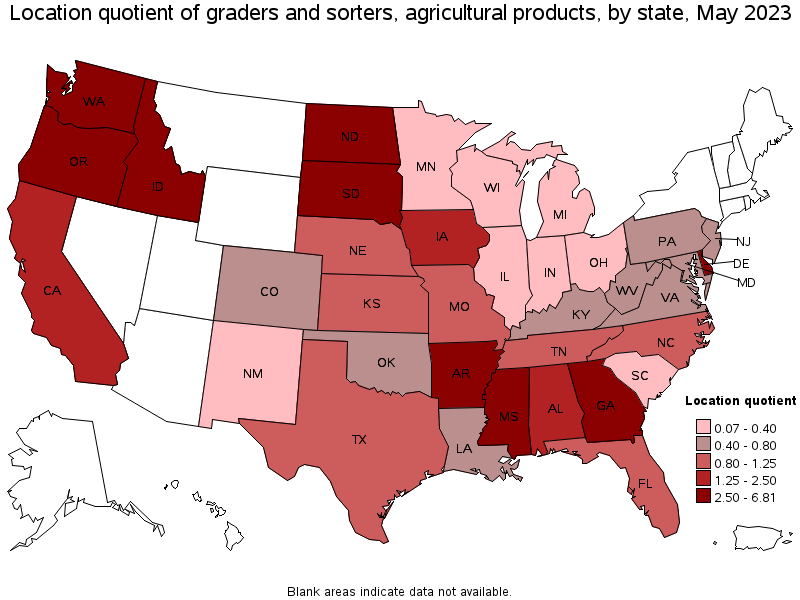
States with the highest concentration of jobs and location quotients in Graders and Sorters, Agricultural Products:
| State | Employment (1) | Employment per thousand jobs | Location quotient (9) | Hourly mean wage | Annual mean wage (2) |
|---|---|---|---|---|---|
| Idaho | 860 | 1.05 | 6.81 | $ 14.41 | $ 29,970 |
| Arkansas | 1,220 | 0.96 | 6.23 | $ 17.13 | $ 35,620 |
| South Dakota | 390 | 0.87 | 5.66 | $ 18.50 | $ 38,470 |
| Mississippi | 780 | 0.68 | 4.41 | $ 15.53 | $ 32,310 |
| Washington | 2,190 | 0.63 | 4.06 | $ 16.98 | $ 35,310 |
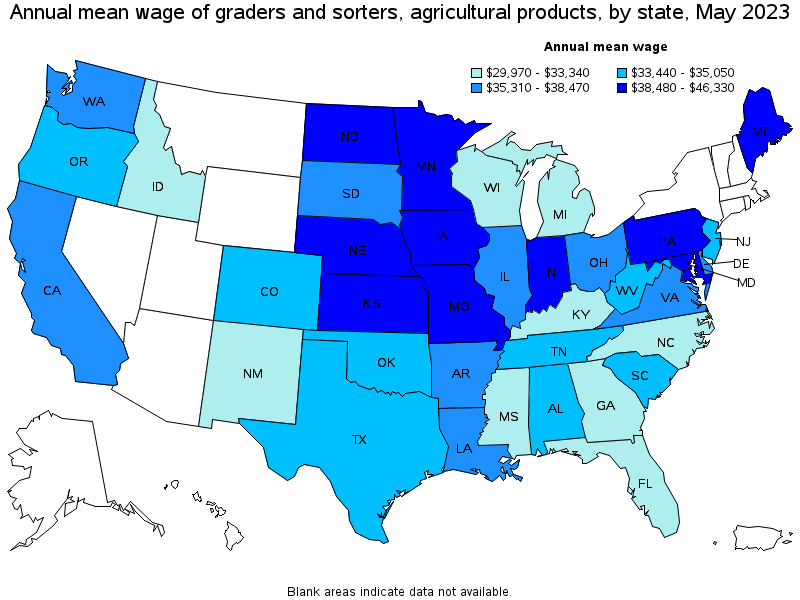
Top paying states for Graders and Sorters, Agricultural Products:
| State | Employment (1) | Employment per thousand jobs | Location quotient (9) | Hourly mean wage | Annual mean wage (2) |
|---|---|---|---|---|---|
| Minnesota | 50 | 0.02 | 0.12 | $ 22.27 | $ 46,330 |
| Nebraska | 150 | 0.14 | 0.94 | $ 22.15 | $ 46,070 |
| Maine | (8) | (8) | (8) | $ 21.67 | $ 45,080 |
| Kansas | 220 | 0.16 | 1.02 | $ 21.14 | $ 43,980 |
| Indiana | 30 | 0.01 | 0.07 | $ 20.43 | $ 42,490 |
Metropolitan areas with the highest employment level in Graders and Sorters, Agricultural Products:
| Metropolitan area | Employment (1) | Employment per thousand jobs | Location quotient (9) | Hourly mean wage | Annual mean wage (2) |
|---|---|---|---|---|---|
| Fresno, CA | 840 | 2.06 | 13.38 | $ 16.75 | $ 34,830 |
| Yakima, WA | 820 | 8.47 | 54.90 | $ 16.94 | $ 35,240 |
| Bakersfield, CA | 540 | 1.63 | 10.56 | $ 16.29 | $ 33,880 |
| Modesto, CA | 470 | 2.47 | 16.01 | $ 18.14 | $ 37,740 |
| Visalia-Porterville, CA | 470 | 2.81 | 18.20 | $ 16.67 | $ 34,680 |
| Wenatchee, WA | 470 | 9.25 | 59.92 | $ 16.76 | $ 34,850 |
| Salinas, CA | 460 | 2.51 | 16.30 | $ 17.30 | $ 35,980 |
| Miami-Fort Lauderdale-West Palm Beach, FL | 430 | 0.16 | 1.01 | $ 14.11 | $ 29,360 |
| Gainesville, GA | 410 | 4.09 | 26.54 | $ 16.88 | $ 35,110 |
| Atlanta-Sandy Springs-Roswell, GA | 340 | 0.12 | 0.78 | $ 16.82 | $ 34,990 |
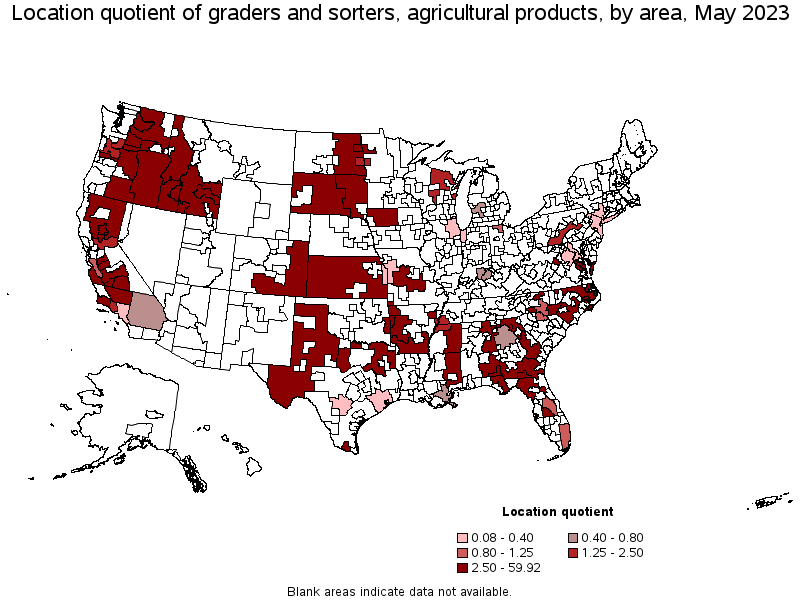
Metropolitan areas with the highest concentration of jobs and location quotients in Graders and Sorters, Agricultural Products:
| Metropolitan area | Employment (1) | Employment per thousand jobs | Location quotient (9) | Hourly mean wage | Annual mean wage (2) |
|---|---|---|---|---|---|
| Wenatchee, WA | 470 | 9.25 | 59.92 | $ 16.76 | $ 34,850 |
| Yakima, WA | 820 | 8.47 | 54.90 | $ 16.94 | $ 35,240 |
| Hanford-Corcoran, CA | 240 | 5.14 | 33.30 | $ 16.78 | $ 34,900 |
| Gainesville, GA | 410 | 4.09 | 26.54 | $ 16.88 | $ 35,110 |
| Visalia-Porterville, CA | 470 | 2.81 | 18.20 | $ 16.67 | $ 34,680 |
| Salinas, CA | 460 | 2.51 | 16.30 | $ 17.30 | $ 35,980 |
| Modesto, CA | 470 | 2.47 | 16.01 | $ 18.14 | $ 37,740 |
| Twin Falls, ID | 120 | 2.43 | 15.74 | $ 17.60 | $ 36,600 |
| Merced, CA | 180 | 2.35 | 15.26 | $ 17.75 | $ 36,910 |
| Fresno, CA | 840 | 2.06 | 13.38 | $ 16.75 | $ 34,830 |
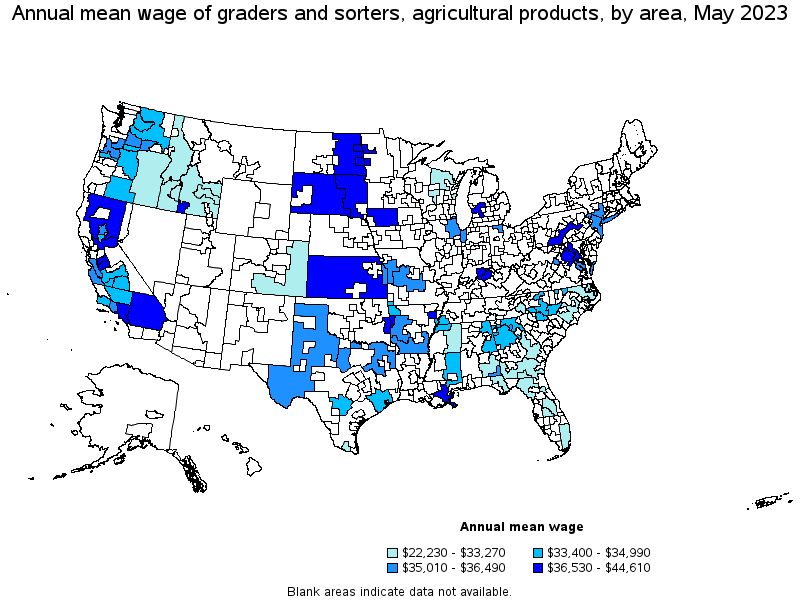
Top paying metropolitan areas for Graders and Sorters, Agricultural Products:
| Metropolitan area | Employment (1) | Employment per thousand jobs | Location quotient (9) | Hourly mean wage | Annual mean wage (2) |
|---|---|---|---|---|---|
| Grand Forks, ND-MN | 40 | 0.80 | 5.17 | $ 19.18 | $ 39,900 |
| Los Angeles-Long Beach-Anaheim, CA | 270 | 0.04 | 0.28 | $ 19.03 | $ 39,570 |
| Fargo, ND-MN | 30 | 0.22 | 1.41 | $ 18.80 | $ 39,100 |
| Sacramento--Roseville--Arden-Arcade, CA | 220 | 0.21 | 1.36 | $ 18.68 | $ 38,850 |
| Louisville/Jefferson County, KY-IN | 50 | 0.08 | 0.50 | $ 18.66 | $ 38,800 |
| New Orleans-Metairie, LA | 60 | 0.12 | 0.76 | $ 18.58 | $ 38,650 |
| Modesto, CA | 470 | 2.47 | 16.01 | $ 18.14 | $ 37,740 |
| Merced, CA | 180 | 2.35 | 15.26 | $ 17.75 | $ 36,910 |
| Jonesboro, AR | 80 | 1.30 | 8.41 | $ 17.72 | $ 36,870 |
| Grand Rapids-Wyoming, MI | 40 | 0.07 | 0.49 | $ 17.66 | $ 36,730 |
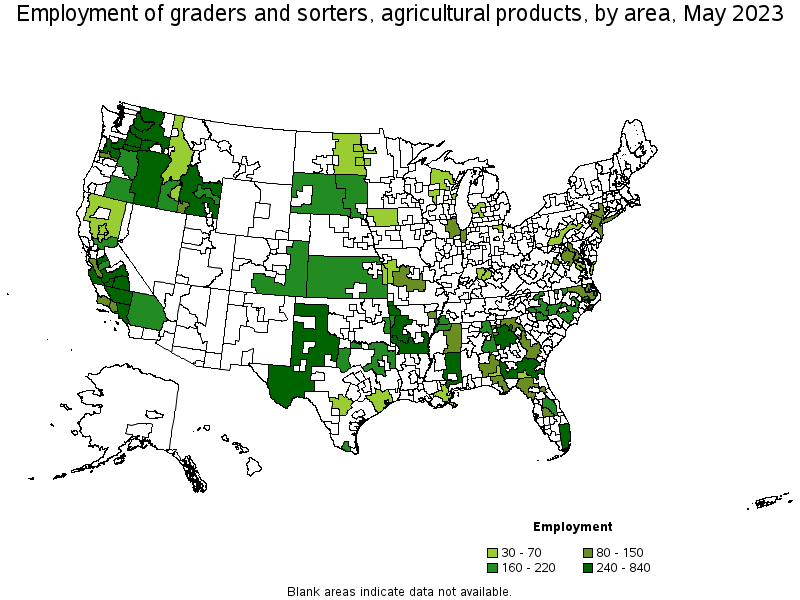
Nonmetropolitan areas with the highest employment in Graders and Sorters, Agricultural Products:
| Nonmetropolitan area | Employment (1) | Employment per thousand jobs | Location quotient (9) | Hourly mean wage | Annual mean wage (2) |
|---|---|---|---|---|---|
| Southeast Mississippi nonmetropolitan area | 460 | 3.13 | 20.27 | $ 16.06 | $ 33,400 |
| Eastern Washington nonmetropolitan area | 420 | 4.06 | 26.28 | $ 16.80 | $ 34,940 |
| West Texas Region of Texas nonmetropolitan area | 410 | 2.08 | 13.46 | $ 17.54 | $ 36,490 |
| Eastern Oregon nonmetropolitan area | 340 | 4.65 | 30.15 | $ 14.96 | $ 31,110 |
| South Georgia nonmetropolitan area | 290 | 1.53 | 9.91 | $ 14.89 | $ 30,980 |
Nonmetropolitan areas with the highest concentration of jobs and location quotients in Graders and Sorters, Agricultural Products:
| Nonmetropolitan area | Employment (1) | Employment per thousand jobs | Location quotient (9) | Hourly mean wage | Annual mean wage (2) |
|---|---|---|---|---|---|
| Eastern Oregon nonmetropolitan area | 340 | 4.65 | 30.15 | $ 14.96 | $ 31,110 |
| Eastern Washington nonmetropolitan area | 420 | 4.06 | 26.28 | $ 16.80 | $ 34,940 |
| Southeast Mississippi nonmetropolitan area | 460 | 3.13 | 20.27 | $ 16.06 | $ 33,400 |
| Southeast-Central Idaho nonmetropolitan area | 290 | 3.10 | 20.11 | $ 13.00 | $ 27,050 |
| West South Dakota nonmetropolitan area | 170 | 2.80 | 18.16 | $ 17.68 | $ 36,770 |
Top paying nonmetropolitan areas for Graders and Sorters, Agricultural Products:
| Nonmetropolitan area | Employment (1) | Employment per thousand jobs | Location quotient (9) | Hourly mean wage | Annual mean wage (2) |
|---|---|---|---|---|---|
| Kansas nonmetropolitan area | 160 | 0.42 | 2.72 | $ 21.45 | $ 44,610 |
| Southern Pennsylvania nonmetropolitan area | 60 | 0.34 | 2.18 | $ 19.02 | $ 39,570 |
| East South Dakota nonmetropolitan area | 160 | 1.18 | 7.67 | $ 18.96 | $ 39,440 |
| Northwest Iowa nonmetropolitan area | 60 | 0.48 | 3.09 | $ 18.37 | $ 38,220 |
| East North Dakota nonmetropolitan area | 50 | 0.73 | 4.75 | $ 17.93 | $ 37,300 |
These estimates are calculated with data collected from employers in all industry sectors, all metropolitan and nonmetropolitan areas, and all states and the District of Columbia. The top employment and wage figures are provided above. The complete list is available in the downloadable XLS files.
The percentile wage estimate is the value of a wage below which a certain percent of workers fall. The median wage is the 50th percentile wage estimate—50 percent of workers earn less than the median and 50 percent of workers earn more than the median. More about percentile wages.
(1) Estimates for detailed occupations do not sum to the totals because the totals include occupations not shown separately. Estimates do not include self-employed workers.
(2) Annual wages have been calculated by multiplying the hourly mean wage by a "year-round, full-time" hours figure of 2,080 hours; for those occupations where there is not an hourly wage published, the annual wage has been directly calculated from the reported survey data.
(3) The relative standard error (RSE) is a measure of the reliability of a survey statistic. The smaller the relative standard error, the more precise the estimate.
(7) The value is less than .005 percent of industry employment.
(8) Estimate not released.
(9) The location quotient is the ratio of the area concentration of occupational employment to the national average concentration. A location quotient greater than one indicates the occupation has a higher share of employment than average, and a location quotient less than one indicates the occupation is less prevalent in the area than average.
Other OEWS estimates and related information:
May 2023 National Occupational Employment and Wage Estimates
May 2023 State Occupational Employment and Wage Estimates
May 2023 Metropolitan and Nonmetropolitan Area Occupational Employment and Wage Estimates
May 2023 National Industry-Specific Occupational Employment and Wage Estimates
Last Modified Date: April 3, 2024