
An official website of the United States government
An official website of the United States government
The .gov means it's official.
Federal government websites often end in .gov or .mil. Before sharing sensitive information,
make sure you're on a federal government site.
The site is secure.
The
https:// ensures that you are connecting to the official website and that any
information you provide is encrypted and transmitted securely.
Fabricate, assemble, install, and repair sheet metal products and equipment, such as ducts, control boxes, drainpipes, and furnace casings. Work may involve any of the following: setting up and operating fabricating machines to cut, bend, and straighten sheet metal; shaping metal over anvils, blocks, or forms using hammer; operating soldering and welding equipment to join sheet metal parts; or inspecting, assembling, and smoothing seams and joints of burred surfaces. Includes sheet metal duct installers who install prefabricated sheet metal ducts used for heating, air conditioning, or other purposes.
Employment estimate and mean wage estimates for Sheet Metal Workers:
| Employment (1) | Employment RSE (3) |
Mean hourly wage |
Mean annual wage (2) |
Wage RSE (3) |
|---|---|---|---|---|
| 116,190 | 2.1 % | $ 30.90 | $ 64,270 | 0.9 % |
Percentile wage estimates for Sheet Metal Workers:
| Percentile | 10% | 25% | 50% (Median) |
75% | 90% |
|---|---|---|---|---|---|
| Hourly Wage | $ 17.79 | $ 22.04 | $ 28.26 | $ 37.80 | $ 48.49 |
| Annual Wage (2) | $ 37,000 | $ 45,840 | $ 58,780 | $ 78,620 | $ 100,850 |
Industries with the highest published employment and wages for Sheet Metal Workers are provided. For a list of all industries with employment in Sheet Metal Workers, see the Create Customized Tables function.
Industries with the highest levels of employment in Sheet Metal Workers:
| Industry | Employment (1) | Percent of industry employment | Hourly mean wage | Annual mean wage (2) |
|---|---|---|---|---|
| Building Equipment Contractors | 52,500 | 2.16 | $ 34.82 | $ 72,420 |
| Fabricated Metal Product Manufacturing (3323 and 3324 only) | 19,470 | 3.91 | $ 26.90 | $ 55,950 |
| Foundation, Structure, and Building Exterior Contractors | 15,080 | 1.54 | $ 27.03 | $ 56,220 |
| Federal, State, and Local Government, excluding State and Local Government Schools and Hospitals and the U.S. Postal Service (OEWS Designation) | 5,750 | 0.27 | $ 31.59 | $ 65,700 |
| Nonresidential Building Construction | 4,690 | 0.55 | $ 30.06 | $ 62,520 |
Industries with the highest concentration of employment in Sheet Metal Workers:
| Industry | Employment (1) | Percent of industry employment | Hourly mean wage | Annual mean wage (2) |
|---|---|---|---|---|
| Fabricated Metal Product Manufacturing (3323 and 3324 only) | 19,470 | 3.91 | $ 26.90 | $ 55,950 |
| Building Equipment Contractors | 52,500 | 2.16 | $ 34.82 | $ 72,420 |
| Foundation, Structure, and Building Exterior Contractors | 15,080 | 1.54 | $ 27.03 | $ 56,220 |
| Ship and Boat Building | 1,390 | 0.91 | $ 28.80 | $ 59,900 |
| Motor Vehicle Body and Trailer Manufacturing | 1,070 | 0.63 | $ 23.77 | $ 49,450 |
Top paying industries for Sheet Metal Workers:
| Industry | Employment (1) | Percent of industry employment | Hourly mean wage | Annual mean wage (2) |
|---|---|---|---|---|
| Scheduled Air Transportation | 450 | 0.09 | $ 54.36 | $ 113,060 |
| General Medical and Surgical Hospitals | 30 | (7) | $ 49.82 | $ 103,630 |
| Local Government, excluding Schools and Hospitals (OEWS Designation) | 340 | 0.01 | $ 47.33 | $ 98,450 |
| Utility System Construction | 100 | 0.02 | $ 45.28 | $ 94,170 |
| Nonscheduled Air Transportation | 50 | 0.09 | $ 40.72 | $ 84,700 |
States and areas with the highest published employment, location quotients, and wages for Sheet Metal Workers are provided. For a list of all areas with employment in Sheet Metal Workers, see the Create Customized Tables function.
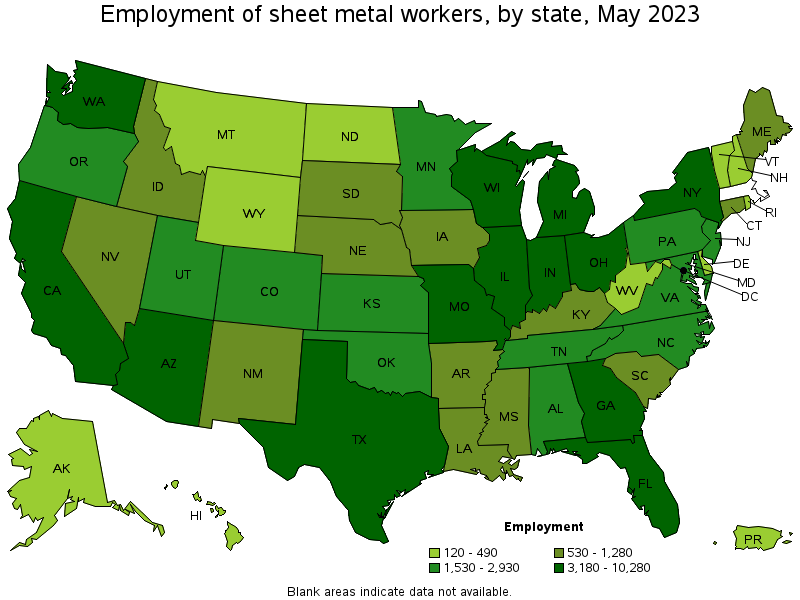
States with the highest employment level in Sheet Metal Workers:
| State | Employment (1) | Employment per thousand jobs | Location quotient (9) | Hourly mean wage | Annual mean wage (2) |
|---|---|---|---|---|---|
| California | 10,280 | 0.57 | 0.75 | $ 41.39 | $ 86,090 |
| Texas | 9,390 | 0.69 | 0.91 | $ 25.75 | $ 53,560 |
| Florida | 8,100 | 0.85 | 1.11 | $ 22.99 | $ 47,820 |
| New York | 6,010 | 0.64 | 0.84 | $ 35.01 | $ 72,820 |
| Ohio | 4,580 | 0.84 | 1.10 | $ 29.29 | $ 60,910 |
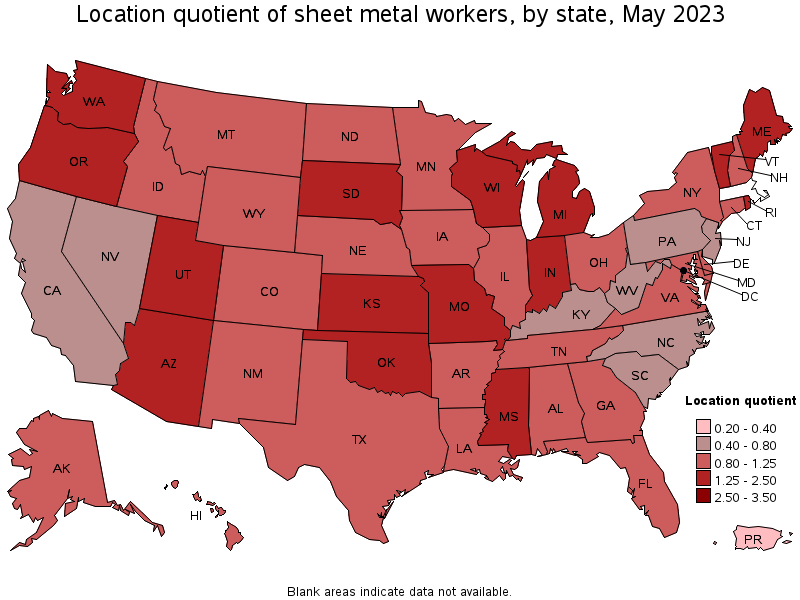
States with the highest concentration of jobs and location quotients in Sheet Metal Workers:
| State | Employment (1) | Employment per thousand jobs | Location quotient (9) | Hourly mean wage | Annual mean wage (2) |
|---|---|---|---|---|---|
| Oklahoma | 2,750 | 1.65 | 2.16 | $ 28.13 | $ 58,500 |
| Maine | 980 | 1.57 | 2.05 | $ 25.59 | $ 53,230 |
| Missouri | 4,070 | 1.41 | 1.85 | $ 33.46 | $ 69,610 |
| Kansas | 1,910 | 1.35 | 1.77 | $ 27.75 | $ 57,720 |
| Oregon | 2,460 | 1.26 | 1.65 | $ 33.90 | $ 70,510 |
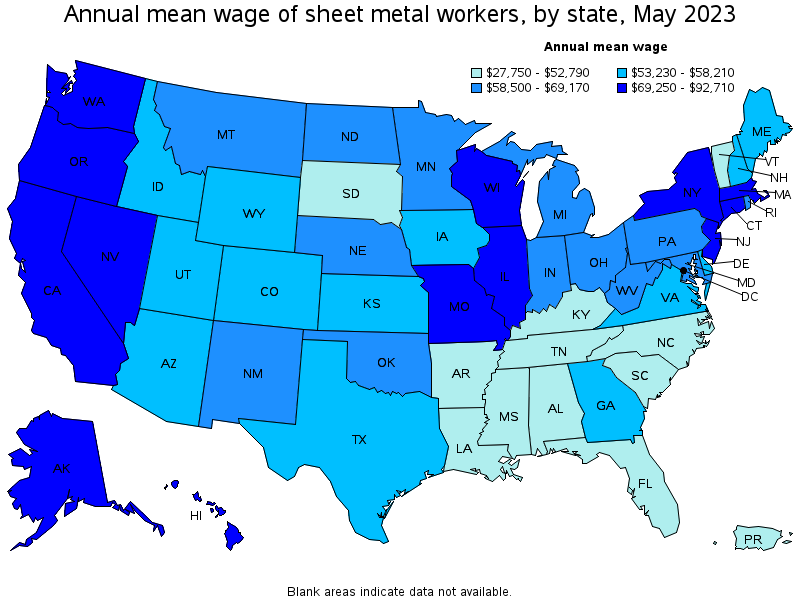
Top paying states for Sheet Metal Workers:
| State | Employment (1) | Employment per thousand jobs | Location quotient (9) | Hourly mean wage | Annual mean wage (2) |
|---|---|---|---|---|---|
| Washington | 3,780 | 1.08 | 1.41 | $ 44.57 | $ 92,710 |
| Alaska | 240 | 0.78 | 1.02 | $ 43.66 | $ 90,810 |
| California | 10,280 | 0.57 | 0.75 | $ 41.39 | $ 86,090 |
| Hawaii | 490 | 0.80 | 1.04 | $ 41.35 | $ 86,010 |
| Illinois | 4,430 | 0.74 | 0.96 | $ 39.50 | $ 82,160 |
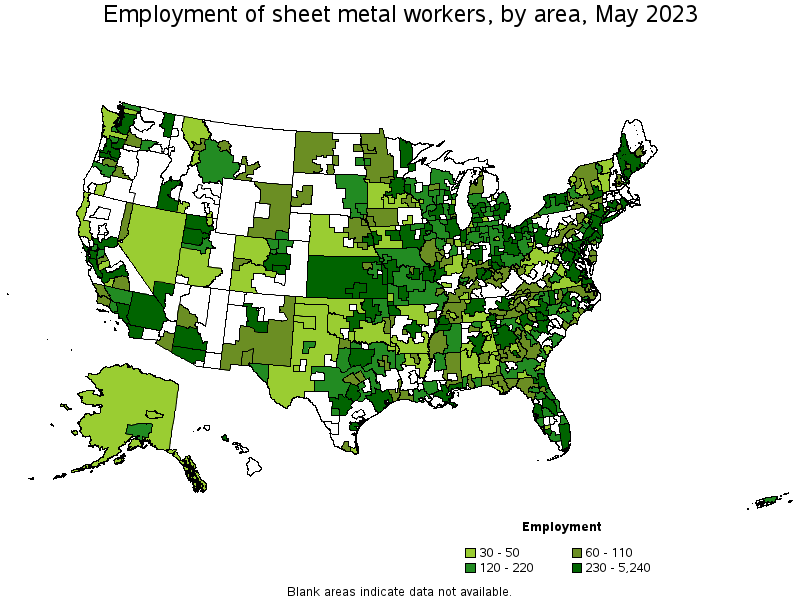
Metropolitan areas with the highest employment level in Sheet Metal Workers:
| Metropolitan area | Employment (1) | Employment per thousand jobs | Location quotient (9) | Hourly mean wage | Annual mean wage (2) |
|---|---|---|---|---|---|
| New York-Newark-Jersey City, NY-NJ-PA | 5,240 | 0.55 | 0.72 | $ 38.03 | $ 79,100 |
| Chicago-Naperville-Elgin, IL-IN-WI | 3,450 | 0.77 | 1.00 | $ 40.62 | $ 84,480 |
| Dallas-Fort Worth-Arlington, TX | 3,160 | 0.80 | 1.04 | $ 25.89 | $ 53,850 |
| Los Angeles-Long Beach-Anaheim, CA | 2,920 | 0.47 | 0.62 | $ 39.94 | $ 83,070 |
| Phoenix-Mesa-Scottsdale, AZ | 2,720 | 1.19 | 1.55 | $ 27.07 | $ 56,310 |
| Houston-The Woodlands-Sugar Land, TX | 2,240 | 0.71 | 0.92 | $ 26.96 | $ 56,080 |
| Oklahoma City, OK | 2,100 | 3.20 | 4.18 | $ 28.64 | $ 59,570 |
| Seattle-Tacoma-Bellevue, WA | 2,090 | 1.00 | 1.31 | $ 49.10 | $ 102,130 |
| Minneapolis-St. Paul-Bloomington, MN-WI | 1,970 | 1.03 | 1.35 | $ 33.19 | $ 69,040 |
| Portland-Vancouver-Hillsboro, OR-WA | 1,930 | 1.60 | 2.10 | $ 36.74 | $ 76,410 |
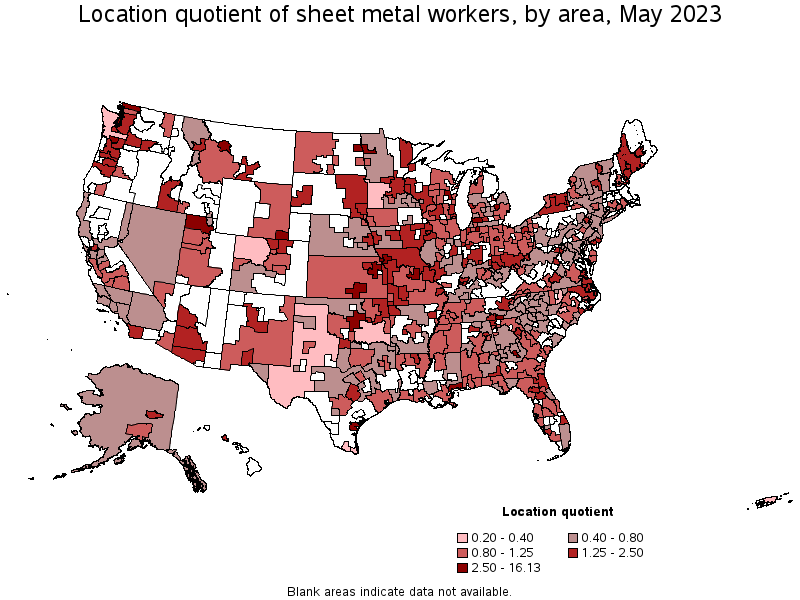
Metropolitan areas with the highest concentration of jobs and location quotients in Sheet Metal Workers:
| Metropolitan area | Employment (1) | Employment per thousand jobs | Location quotient (9) | Hourly mean wage | Annual mean wage (2) |
|---|---|---|---|---|---|
| Warner Robins, GA | 950 | 12.34 | 16.13 | $ 29.35 | $ 61,050 |
| Elkhart-Goshen, IN | 880 | 6.47 | 8.46 | $ 25.80 | $ 53,670 |
| Longview, WA | 150 | 3.66 | 4.78 | $ 38.83 | $ 80,760 |
| Appleton, WI | 430 | 3.52 | 4.60 | $ 36.73 | $ 76,390 |
| Jefferson City, MO | 250 | 3.32 | 4.34 | $ 34.18 | $ 71,090 |
| St. Joseph, MO-KS | 170 | 3.21 | 4.19 | $ 37.71 | $ 78,440 |
| Oklahoma City, OK | 2,100 | 3.20 | 4.18 | $ 28.64 | $ 59,570 |
| Ogden-Clearfield, UT | 820 | 2.86 | 3.73 | $ 28.48 | $ 59,230 |
| Kalamazoo-Portage, MI | 390 | 2.80 | 3.66 | $ 37.22 | $ 77,420 |
| Flint, MI | 360 | 2.72 | 3.55 | $ 34.62 | $ 72,010 |
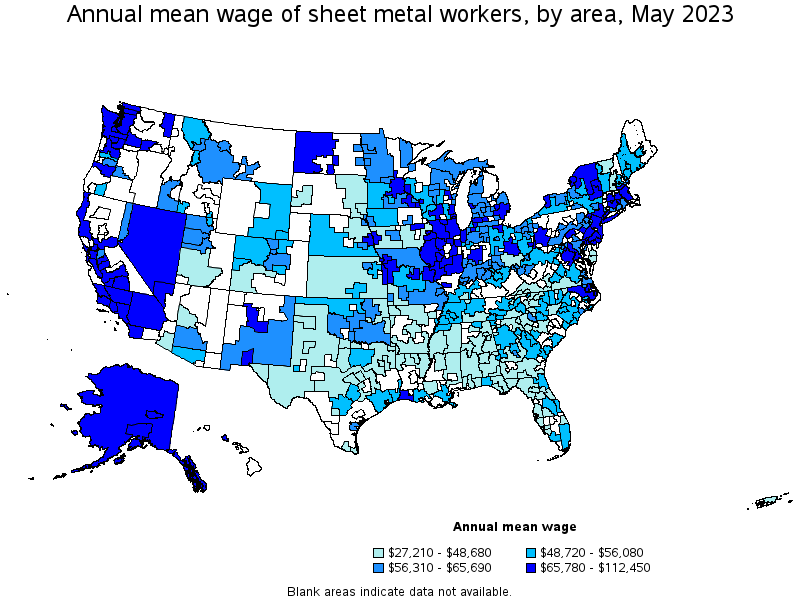
Top paying metropolitan areas for Sheet Metal Workers:
| Metropolitan area | Employment (1) | Employment per thousand jobs | Location quotient (9) | Hourly mean wage | Annual mean wage (2) |
|---|---|---|---|---|---|
| San Jose-Sunnyvale-Santa Clara, CA | 1,030 | 0.90 | 1.17 | $ 54.06 | $ 112,450 |
| San Francisco-Oakland-Hayward, CA | 1,340 | 0.55 | 0.72 | $ 51.04 | $ 106,160 |
| Seattle-Tacoma-Bellevue, WA | 2,090 | 1.00 | 1.31 | $ 49.10 | $ 102,130 |
| Kennewick-Richland, WA | 210 | 1.70 | 2.22 | $ 46.09 | $ 95,860 |
| Olympia-Tumwater, WA | 150 | 1.20 | 1.56 | $ 44.11 | $ 91,760 |
| Anchorage, AK | 160 | 0.93 | 1.22 | $ 44.03 | $ 91,580 |
| Vineland-Bridgeton, NJ | 70 | 1.11 | 1.45 | $ 43.71 | $ 90,910 |
| Fairbanks, AK | 50 | 1.41 | 1.84 | $ 42.61 | $ 88,620 |
| Atlantic City-Hammonton, NJ | 140 | 1.11 | 1.45 | $ 42.37 | $ 88,140 |
| Urban Honolulu, HI | 440 | 1.00 | 1.31 | $ 41.46 | $ 86,250 |
Nonmetropolitan areas with the highest employment in Sheet Metal Workers:
| Nonmetropolitan area | Employment (1) | Employment per thousand jobs | Location quotient (9) | Hourly mean wage | Annual mean wage (2) |
|---|---|---|---|---|---|
| Southwest Maine nonmetropolitan area | 340 | 1.78 | 2.33 | $ 25.95 | $ 53,980 |
| Southeast Iowa nonmetropolitan area | 290 | 1.36 | 1.78 | $ 23.19 | $ 48,230 |
| Kansas nonmetropolitan area | 270 | 0.69 | 0.90 | $ 23.40 | $ 48,680 |
| North Northeastern Ohio nonmetropolitan area (noncontiguous) | 250 | 0.76 | 1.00 | $ 23.85 | $ 49,610 |
| Southwest New York nonmetropolitan area | 200 | 1.20 | 1.57 | $ 24.10 | $ 50,120 |
Nonmetropolitan areas with the highest concentration of jobs and location quotients in Sheet Metal Workers:
| Nonmetropolitan area | Employment (1) | Employment per thousand jobs | Location quotient (9) | Hourly mean wage | Annual mean wage (2) |
|---|---|---|---|---|---|
| Southwest Missouri nonmetropolitan area | 140 | 1.87 | 2.44 | $ 20.65 | $ 42,940 |
| Southwest Maine nonmetropolitan area | 340 | 1.78 | 2.33 | $ 25.95 | $ 53,980 |
| Western Wisconsin nonmetropolitan area | 190 | 1.43 | 1.87 | $ 26.68 | $ 55,500 |
| Southeast Iowa nonmetropolitan area | 290 | 1.36 | 1.78 | $ 23.19 | $ 48,230 |
| Southern Ohio nonmetropolitan area | 190 | 1.20 | 1.57 | $ 22.43 | $ 46,640 |
Top paying nonmetropolitan areas for Sheet Metal Workers:
| Nonmetropolitan area | Employment (1) | Employment per thousand jobs | Location quotient (9) | Hourly mean wage | Annual mean wage (2) |
|---|---|---|---|---|---|
| Alaska nonmetropolitan area | 40 | 0.34 | 0.45 | $ 43.69 | $ 90,870 |
| East Central Illinois nonmetropolitan area | 40 | 0.32 | 0.42 | $ 36.14 | $ 75,170 |
| Western Washington nonmetropolitan area | 40 | 0.29 | 0.39 | $ 34.99 | $ 72,780 |
| Nevada nonmetropolitan area | 40 | 0.42 | 0.55 | $ 34.69 | $ 72,160 |
| West Central Illinois nonmetropolitan area | 100 | 0.60 | 0.79 | $ 34.53 | $ 71,820 |
These estimates are calculated with data collected from employers in all industry sectors, all metropolitan and nonmetropolitan areas, and all states and the District of Columbia. The top employment and wage figures are provided above. The complete list is available in the downloadable XLS files.
The percentile wage estimate is the value of a wage below which a certain percent of workers fall. The median wage is the 50th percentile wage estimate—50 percent of workers earn less than the median and 50 percent of workers earn more than the median. More about percentile wages.
(1) Estimates for detailed occupations do not sum to the totals because the totals include occupations not shown separately. Estimates do not include self-employed workers.
(2) Annual wages have been calculated by multiplying the hourly mean wage by a "year-round, full-time" hours figure of 2,080 hours; for those occupations where there is not an hourly wage published, the annual wage has been directly calculated from the reported survey data.
(3) The relative standard error (RSE) is a measure of the reliability of a survey statistic. The smaller the relative standard error, the more precise the estimate.
(7) The value is less than .005 percent of industry employment.
(9) The location quotient is the ratio of the area concentration of occupational employment to the national average concentration. A location quotient greater than one indicates the occupation has a higher share of employment than average, and a location quotient less than one indicates the occupation is less prevalent in the area than average.
Other OEWS estimates and related information:
May 2023 National Occupational Employment and Wage Estimates
May 2023 State Occupational Employment and Wage Estimates
May 2023 Metropolitan and Nonmetropolitan Area Occupational Employment and Wage Estimates
May 2023 National Industry-Specific Occupational Employment and Wage Estimates
Last Modified Date: April 3, 2024