
An official website of the United States government
An official website of the United States government
The .gov means it's official.
Federal government websites often end in .gov or .mil. Before sharing sensitive information,
make sure you're on a federal government site.
The site is secure.
The
https:// ensures that you are connecting to the official website and that any
information you provide is encrypted and transmitted securely.
Help electricians by performing duties requiring less skill. Duties include using, supplying, or holding materials or tools, and cleaning work area and equipment. Construction laborers who do not primarily assist electricians are classified under �Construction Laborers� (47-2061). Apprentice workers are classified with the appropriate skilled construction trade occupation (47-2011 through 47-2231).
Employment estimate and mean wage estimates for Helpers--Electricians:
| Employment (1) | Employment RSE (3) |
Mean hourly wage |
Mean annual wage (2) |
Wage RSE (3) |
|---|---|---|---|---|
| 68,670 | 3.4 % | $ 19.83 | $ 41,240 | 0.7 % |
Percentile wage estimates for Helpers--Electricians:
| Percentile | 10% | 25% | 50% (Median) |
75% | 90% |
|---|---|---|---|---|---|
| Hourly Wage | $ 14.41 | $ 16.85 | $ 18.43 | $ 22.34 | $ 26.88 |
| Annual Wage (2) | $ 29,970 | $ 35,040 | $ 38,340 | $ 46,470 | $ 55,900 |
Industries with the highest published employment and wages for Helpers--Electricians are provided. For a list of all industries with employment in Helpers--Electricians, see the Create Customized Tables function.
Industries with the highest levels of employment in Helpers--Electricians:
| Industry | Employment (1) | Percent of industry employment | Hourly mean wage | Annual mean wage (2) |
|---|---|---|---|---|
| Building Equipment Contractors | 59,550 | 2.45 | $ 19.26 | $ 40,050 |
| Nonresidential Building Construction | 1,310 | 0.15 | $ 22.95 | $ 47,730 |
| Employment Services | 1,170 | 0.03 | $ 18.92 | $ 39,350 |
| Utility System Construction | 760 | 0.13 | $ 20.13 | $ 41,870 |
| Architectural, Engineering, and Related Services | 550 | 0.03 | $ 22.39 | $ 46,570 |
Industries with the highest concentration of employment in Helpers--Electricians:
| Industry | Employment (1) | Percent of industry employment | Hourly mean wage | Annual mean wage (2) |
|---|---|---|---|---|
| Building Equipment Contractors | 59,550 | 2.45 | $ 19.26 | $ 40,050 |
| Ship and Boat Building | 270 | 0.18 | $ 21.94 | $ 45,630 |
| Nonresidential Building Construction | 1,310 | 0.15 | $ 22.95 | $ 47,730 |
| Utility System Construction | 760 | 0.13 | $ 20.13 | $ 41,870 |
| Other Specialty Trade Contractors | 480 | 0.06 | $ 19.55 | $ 40,660 |
Top paying industries for Helpers--Electricians:
| Industry | Employment (1) | Percent of industry employment | Hourly mean wage | Annual mean wage (2) |
|---|---|---|---|---|
| Support Activities for Mining | 50 | 0.02 | $ 36.05 | $ 74,980 |
| Local Government, excluding Schools and Hospitals (OEWS Designation) | (8) | (8) | $ 29.14 | $ 60,620 |
| Colleges, Universities, and Professional Schools | 50 | (7) | $ 24.39 | $ 50,740 |
| Electric Power Generation, Transmission and Distribution | 180 | 0.05 | $ 23.87 | $ 49,640 |
| General Medical and Surgical Hospitals | 30 | (7) | $ 23.64 | $ 49,160 |
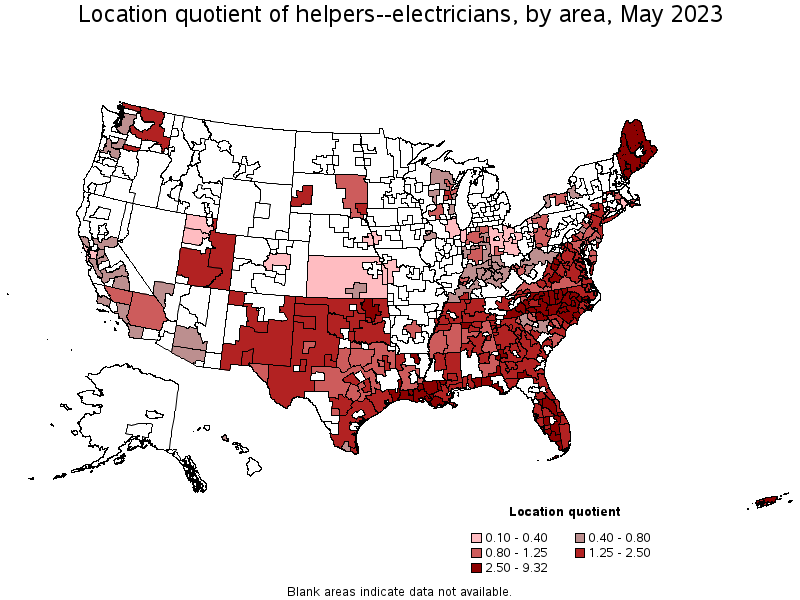
States and areas with the highest published employment, location quotients, and wages for Helpers--Electricians are provided. For a list of all areas with employment in Helpers--Electricians, see the Create Customized Tables function.
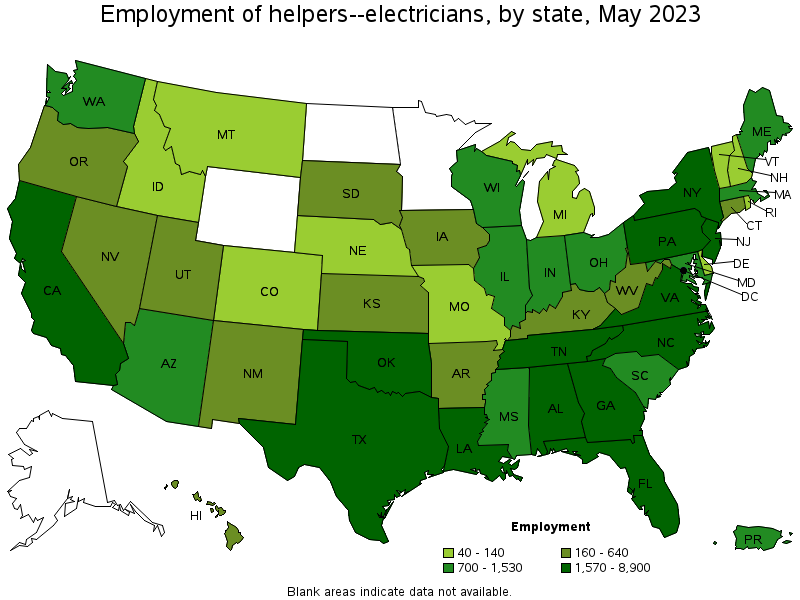
States with the highest employment level in Helpers--Electricians:
| State | Employment (1) | Employment per thousand jobs | Location quotient (9) | Hourly mean wage | Annual mean wage (2) |
|---|---|---|---|---|---|
| Florida | 8,900 | 0.93 | 2.06 | $ 17.85 | $ 37,120 |
| Texas | 7,810 | 0.58 | 1.27 | $ 20.68 | $ 43,020 |
| North Carolina | 7,200 | 1.50 | 3.32 | $ 17.97 | $ 37,380 |
| New York | 5,360 | 0.57 | 1.26 | $ 25.76 | $ 53,580 |
| Georgia | 4,020 | 0.84 | 1.87 | $ 17.68 | $ 36,770 |
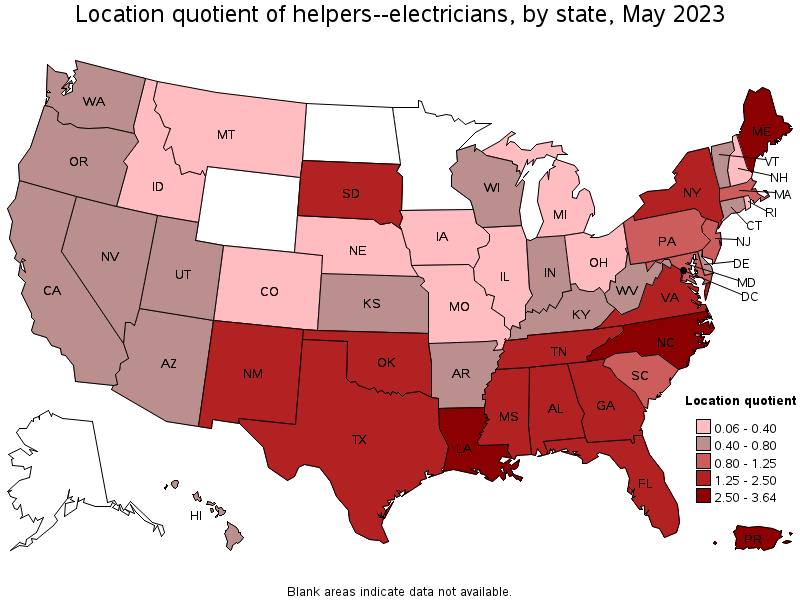
States with the highest concentration of jobs and location quotients in Helpers--Electricians:
| State | Employment (1) | Employment per thousand jobs | Location quotient (9) | Hourly mean wage | Annual mean wage (2) |
|---|---|---|---|---|---|
| Maine | 1,010 | 1.63 | 3.59 | $ 21.34 | $ 44,400 |
| Louisiana | 2,780 | 1.50 | 3.32 | $ 19.17 | $ 39,870 |
| North Carolina | 7,200 | 1.50 | 3.32 | $ 17.97 | $ 37,380 |
| Oklahoma | 1,570 | 0.94 | 2.08 | $ 18.40 | $ 38,260 |
| Florida | 8,900 | 0.93 | 2.06 | $ 17.85 | $ 37,120 |
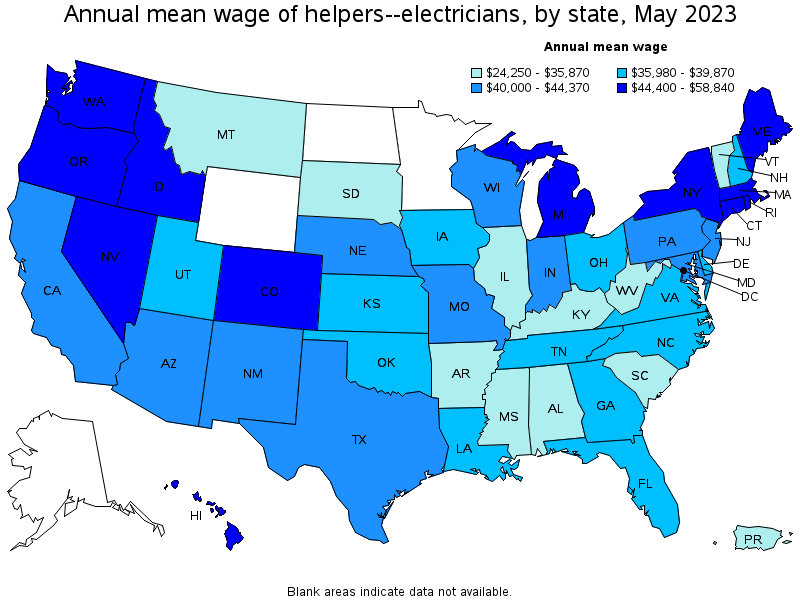
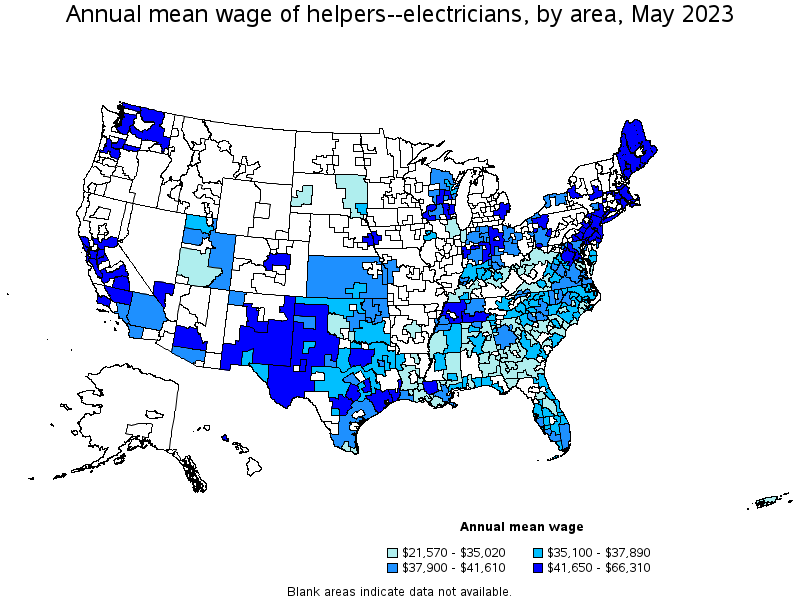
Top paying states for Helpers--Electricians:
| State | Employment (1) | Employment per thousand jobs | Location quotient (9) | Hourly mean wage | Annual mean wage (2) |
|---|---|---|---|---|---|
| Washington | 910 | 0.26 | 0.58 | $ 28.29 | $ 58,840 |
| Nevada | 390 | 0.27 | 0.59 | $ 28.17 | $ 58,590 |
| Connecticut | 330 | 0.20 | 0.44 | $ 26.67 | $ 55,480 |
| New York | 5,360 | 0.57 | 1.26 | $ 25.76 | $ 53,580 |
| Rhode Island | 60 | 0.13 | 0.29 | $ 22.46 | $ 46,710 |
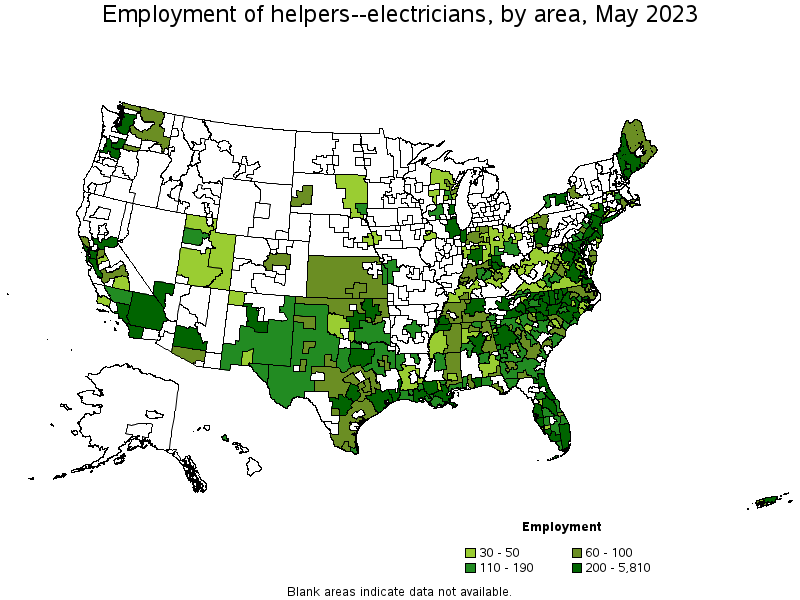
Metropolitan areas with the highest employment level in Helpers--Electricians:
| Metropolitan area | Employment (1) | Employment per thousand jobs | Location quotient (9) | Hourly mean wage | Annual mean wage (2) |
|---|---|---|---|---|---|
| New York-Newark-Jersey City, NY-NJ-PA | 5,810 | 0.61 | 1.35 | $ 25.19 | $ 52,400 |
| Atlanta-Sandy Springs-Roswell, GA | 2,270 | 0.81 | 1.78 | $ 18.52 | $ 38,520 |
| Houston-The Woodlands-Sugar Land, TX | 2,070 | 0.65 | 1.44 | $ 21.55 | $ 44,820 |
| Dallas-Fort Worth-Arlington, TX | 1,970 | 0.50 | 1.10 | $ 21.38 | $ 44,480 |
| Charlotte-Concord-Gastonia, NC-SC | 1,850 | 1.41 | 3.12 | $ 18.46 | $ 38,390 |
| Washington-Arlington-Alexandria, DC-VA-MD-WV | 1,810 | 0.58 | 1.29 | $ 21.01 | $ 43,700 |
| Miami-Fort Lauderdale-West Palm Beach, FL | 1,800 | 0.66 | 1.46 | $ 19.47 | $ 40,500 |
| Orlando-Kissimmee-Sanford, FL | 1,760 | 1.29 | 2.85 | $ 16.41 | $ 34,120 |
| Tampa-St. Petersburg-Clearwater, FL | 1,520 | 1.08 | 2.38 | $ 17.53 | $ 36,460 |
| Raleigh, NC | 1,210 | 1.72 | 3.80 | $ 18.58 | $ 38,650 |
Metropolitan areas with the highest concentration of jobs and location quotients in Helpers--Electricians:
| Metropolitan area | Employment (1) | Employment per thousand jobs | Location quotient (9) | Hourly mean wage | Annual mean wage (2) |
|---|---|---|---|---|---|
| Lewiston-Auburn, ME | 160 | 3.47 | 7.67 | $ 21.21 | $ 44,120 |
| Baton Rouge, LA | 1,090 | 2.82 | 6.23 | $ 21.99 | $ 45,740 |
| Asheville, NC | 390 | 1.92 | 4.25 | $ 17.68 | $ 36,770 |
| Lake Charles, LA | 170 | 1.89 | 4.19 | $ 18.53 | $ 38,540 |
| Beaumont-Port Arthur, TX | 290 | 1.85 | 4.10 | $ 21.44 | $ 44,590 |
| Burlington, NC | 120 | 1.77 | 3.93 | $ 16.78 | $ 34,890 |
| Greenville, NC | 140 | 1.75 | 3.87 | $ 16.91 | $ 35,170 |
| Raleigh, NC | 1,210 | 1.72 | 3.80 | $ 18.58 | $ 38,650 |
| Valdosta, GA | 90 | 1.70 | 3.76 | $ 16.60 | $ 34,530 |
| Houma-Thibodaux, LA | 140 | 1.70 | 3.76 | $ 15.76 | $ 32,770 |
Top paying metropolitan areas for Helpers--Electricians:
| Metropolitan area | Employment (1) | Employment per thousand jobs | Location quotient (9) | Hourly mean wage | Annual mean wage (2) |
|---|---|---|---|---|---|
| Seattle-Tacoma-Bellevue, WA | 450 | 0.22 | 0.48 | $ 31.88 | $ 66,310 |
| Las Vegas-Henderson-Paradise, NV | 320 | 0.30 | 0.65 | $ 28.57 | $ 59,430 |
| San Jose-Sunnyvale-Santa Clara, CA | 210 | 0.19 | 0.41 | $ 25.96 | $ 54,010 |
| Bridgeport-Stamford-Norwalk, CT | 40 | 0.11 | 0.24 | $ 25.54 | $ 53,130 |
| New York-Newark-Jersey City, NY-NJ-PA | 5,810 | 0.61 | 1.35 | $ 25.19 | $ 52,400 |
| San Francisco-Oakland-Hayward, CA | 320 | 0.13 | 0.29 | $ 24.77 | $ 51,530 |
| Santa Maria-Santa Barbara, CA | 40 | 0.20 | 0.44 | $ 24.32 | $ 50,580 |
| Denver-Aurora-Lakewood, CO | 70 | 0.04 | 0.10 | $ 23.86 | $ 49,630 |
| New Haven, CT | 30 | 0.12 | 0.26 | $ 23.77 | $ 49,440 |
| Detroit-Warren-Dearborn, MI | (8) | (8) | (8) | $ 23.48 | $ 48,830 |
Nonmetropolitan areas with the highest employment in Helpers--Electricians:
| Nonmetropolitan area | Employment (1) | Employment per thousand jobs | Location quotient (9) | Hourly mean wage | Annual mean wage (2) |
|---|---|---|---|---|---|
| Southeast Coastal North Carolina nonmetropolitan area | 430 | 1.74 | 3.85 | $ 17.28 | $ 35,940 |
| Piedmont North Carolina nonmetropolitan area | 380 | 1.47 | 3.25 | $ 17.07 | $ 35,500 |
| Southwest Maine nonmetropolitan area | 270 | 1.45 | 3.20 | $ 21.14 | $ 43,970 |
| Mountain North Carolina nonmetropolitan area | 220 | 1.67 | 3.68 | $ 16.90 | $ 35,150 |
| South Georgia nonmetropolitan area | 190 | 0.96 | 2.13 | $ 15.96 | $ 33,200 |
Nonmetropolitan areas with the highest concentration of jobs and location quotients in Helpers--Electricians:
| Nonmetropolitan area | Employment (1) | Employment per thousand jobs | Location quotient (9) | Hourly mean wage | Annual mean wage (2) |
|---|---|---|---|---|---|
| Southeast Coastal North Carolina nonmetropolitan area | 430 | 1.74 | 3.85 | $ 17.28 | $ 35,940 |
| Southwest Louisiana nonmetropolitan area | 110 | 1.69 | 3.74 | $ 15.81 | $ 32,890 |
| Mountain North Carolina nonmetropolitan area | 220 | 1.67 | 3.68 | $ 16.90 | $ 35,150 |
| South Florida nonmetropolitan area | 120 | 1.49 | 3.29 | $ 17.94 | $ 37,310 |
| Piedmont North Carolina nonmetropolitan area | 380 | 1.47 | 3.25 | $ 17.07 | $ 35,500 |
Top paying nonmetropolitan areas for Helpers--Electricians:
| Nonmetropolitan area | Employment (1) | Employment per thousand jobs | Location quotient (9) | Hourly mean wage | Annual mean wage (2) |
|---|---|---|---|---|---|
| Eastern Washington nonmetropolitan area | 90 | 0.85 | 1.88 | $ 27.23 | $ 56,630 |
| Massachusetts nonmetropolitan area | 40 | 0.66 | 1.46 | $ 25.49 | $ 53,020 |
| West Tennessee nonmetropolitan area | 100 | 0.72 | 1.58 | $ 23.69 | $ 49,280 |
| Northeast Maine nonmetropolitan area | 80 | 1.14 | 2.53 | $ 22.19 | $ 46,150 |
| Western Pennsylvania nonmetropolitan area | 60 | 0.41 | 0.91 | $ 21.29 | $ 44,290 |
These estimates are calculated with data collected from employers in all industry sectors, all metropolitan and nonmetropolitan areas, and all states and the District of Columbia. The top employment and wage figures are provided above. The complete list is available in the downloadable XLS files.
The percentile wage estimate is the value of a wage below which a certain percent of workers fall. The median wage is the 50th percentile wage estimate—50 percent of workers earn less than the median and 50 percent of workers earn more than the median. More about percentile wages.
(1) Estimates for detailed occupations do not sum to the totals because the totals include occupations not shown separately. Estimates do not include self-employed workers.
(2) Annual wages have been calculated by multiplying the hourly mean wage by a "year-round, full-time" hours figure of 2,080 hours; for those occupations where there is not an hourly wage published, the annual wage has been directly calculated from the reported survey data.
(3) The relative standard error (RSE) is a measure of the reliability of a survey statistic. The smaller the relative standard error, the more precise the estimate.
(7) The value is less than .005 percent of industry employment.
(8) Estimate not released.
(9) The location quotient is the ratio of the area concentration of occupational employment to the national average concentration. A location quotient greater than one indicates the occupation has a higher share of employment than average, and a location quotient less than one indicates the occupation is less prevalent in the area than average.
Other OEWS estimates and related information:
May 2023 National Occupational Employment and Wage Estimates
May 2023 State Occupational Employment and Wage Estimates
May 2023 Metropolitan and Nonmetropolitan Area Occupational Employment and Wage Estimates
May 2023 National Industry-Specific Occupational Employment and Wage Estimates
Last Modified Date: April 3, 2024