
An official website of the United States government
An official website of the United States government
The .gov means it's official.
Federal government websites often end in .gov or .mil. Before sharing sensitive information,
make sure you're on a federal government site.
The site is secure.
The
https:// ensures that you are connecting to the official website and that any
information you provide is encrypted and transmitted securely.
Install, dismantle, or move machinery and heavy equipment according to layout plans, blueprints, or other drawings.
Employment estimate and mean wage estimates for Millwrights:
| Employment (1) | Employment RSE (3) |
Mean hourly wage |
Mean annual wage (2) |
Wage RSE (3) |
|---|---|---|---|---|
| 37,930 | 2.4 % | $ 30.92 | $ 64,310 | 0.8 % |
Percentile wage estimates for Millwrights:
| Percentile | 10% | 25% | 50% (Median) |
75% | 90% |
|---|---|---|---|---|---|
| Hourly Wage | $ 20.75 | $ 24.77 | $ 30.28 | $ 36.72 | $ 39.76 |
| Annual Wage (2) | $ 43,160 | $ 51,530 | $ 62,980 | $ 76,380 | $ 82,700 |
Industries with the highest published employment and wages for Millwrights are provided. For a list of all industries with employment in Millwrights, see the Create Customized Tables function.
Industries with the highest levels of employment in Millwrights:
| Industry | Employment (1) | Percent of industry employment | Hourly mean wage | Annual mean wage (2) |
|---|---|---|---|---|
| Building Equipment Contractors | 7,990 | 0.33 | $ 31.22 | $ 64,930 |
| Nonresidential Building Construction | 4,840 | 0.56 | $ 30.91 | $ 64,290 |
| Commercial and Industrial Machinery and Equipment (except Automotive and Electronic) Repair and Maintenance | 2,700 | 1.15 | $ 30.77 | $ 64,000 |
| Sawmills and Wood Preservation | 2,410 | 2.62 | $ 28.23 | $ 58,720 |
| Motor Vehicle Manufacturing | 1,670 | 0.58 | $ 37.68 | $ 78,370 |
Industries with the highest concentration of employment in Millwrights:
| Industry | Employment (1) | Percent of industry employment | Hourly mean wage | Annual mean wage (2) |
|---|---|---|---|---|
| Sawmills and Wood Preservation | 2,410 | 2.62 | $ 28.23 | $ 58,720 |
| Pulp, Paper, and Paperboard Mills | 1,070 | 1.21 | $ 33.45 | $ 69,570 |
| Commercial and Industrial Machinery and Equipment (except Automotive and Electronic) Repair and Maintenance | 2,700 | 1.15 | $ 30.77 | $ 64,000 |
| Veneer, Plywood, and Engineered Wood Product Manufacturing | 570 | 0.68 | $ 29.88 | $ 62,150 |
| Iron and Steel Mills and Ferroalloy Manufacturing | 530 | 0.63 | $ 26.63 | $ 55,390 |
Top paying industries for Millwrights:
| Industry | Employment (1) | Percent of industry employment | Hourly mean wage | Annual mean wage (2) |
|---|---|---|---|---|
| Scientific Research and Development Services | 40 | (7) | $ 39.68 | $ 82,530 |
| Support Activities for Mining | (8) | (8) | $ 39.46 | $ 82,070 |
| Utility System Construction | 730 | 0.13 | $ 38.79 | $ 80,670 |
| Remediation and Other Waste Management Services | (8) | (8) | $ 38.32 | $ 79,700 |
| Chemical Manufacturing (3251, 3252, 3253, and 3259 only) | 610 | 0.17 | $ 37.86 | $ 78,750 |
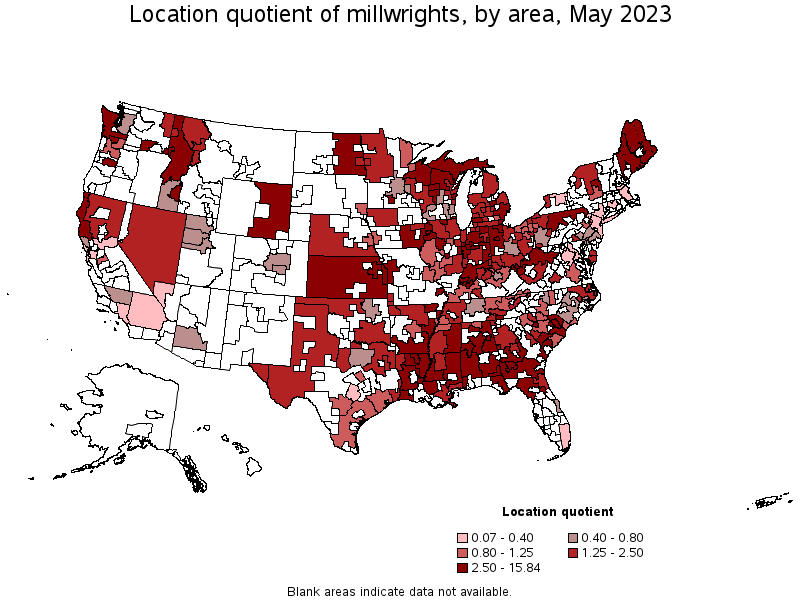
States and areas with the highest published employment, location quotients, and wages for Millwrights are provided. For a list of all areas with employment in Millwrights, see the Create Customized Tables function.
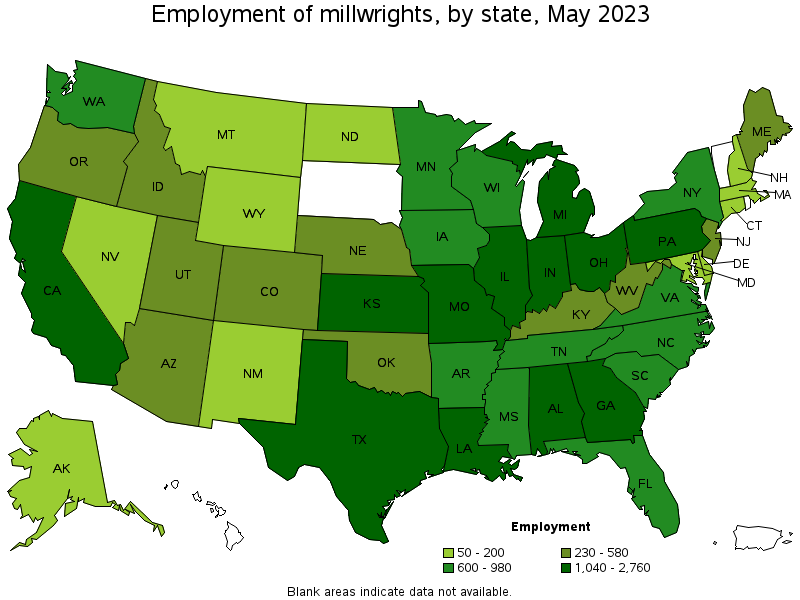
States with the highest employment level in Millwrights:
| State | Employment (1) | Employment per thousand jobs | Location quotient (9) | Hourly mean wage | Annual mean wage (2) |
|---|---|---|---|---|---|
| Michigan | 2,760 | 0.64 | 2.55 | $ 35.20 | $ 73,220 |
| Texas | 2,500 | 0.18 | 0.74 | $ 29.93 | $ 62,250 |
| Illinois | 2,380 | 0.40 | 1.59 | $ 33.39 | $ 69,450 |
| Georgia | 2,300 | 0.48 | 1.94 | $ 27.74 | $ 57,700 |
| Alabama | 2,230 | 1.09 | 4.36 | $ 27.41 | $ 57,010 |
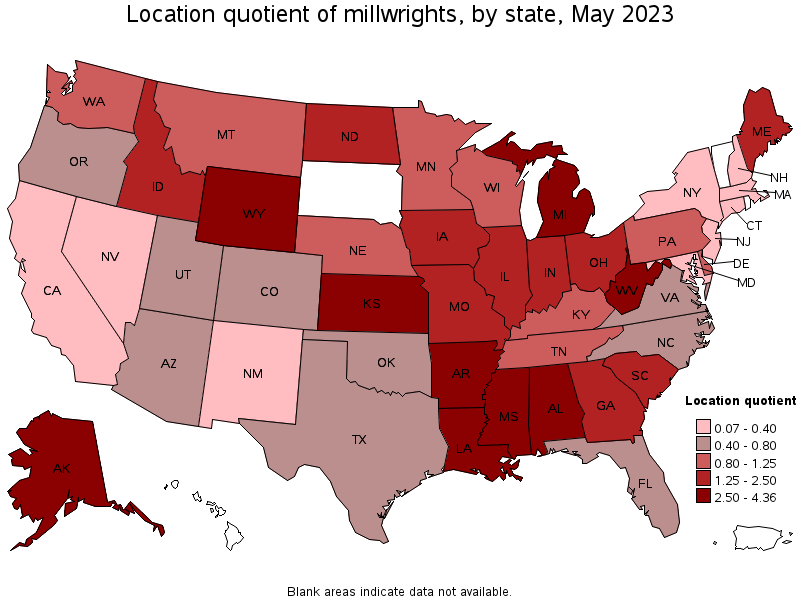
States with the highest concentration of jobs and location quotients in Millwrights:
| State | Employment (1) | Employment per thousand jobs | Location quotient (9) | Hourly mean wage | Annual mean wage (2) |
|---|---|---|---|---|---|
| Alabama | 2,230 | 1.09 | 4.36 | $ 27.41 | $ 57,010 |
| Louisiana | 1,560 | 0.84 | 3.38 | $ 32.10 | $ 66,770 |
| West Virginia | 560 | 0.81 | 3.26 | $ 29.62 | $ 61,610 |
| Arkansas | 960 | 0.76 | 3.02 | $ 24.90 | $ 51,790 |
| Kansas | 1,040 | 0.74 | 2.96 | $ 31.28 | $ 65,060 |
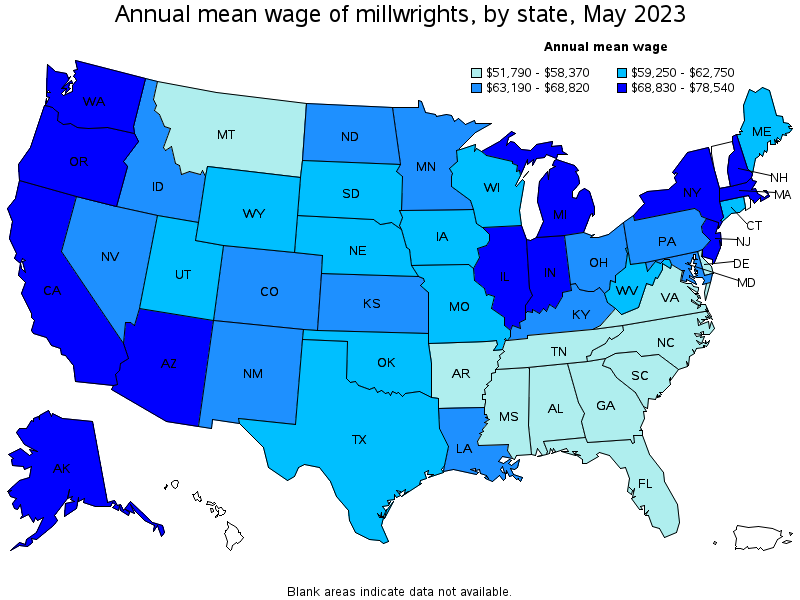
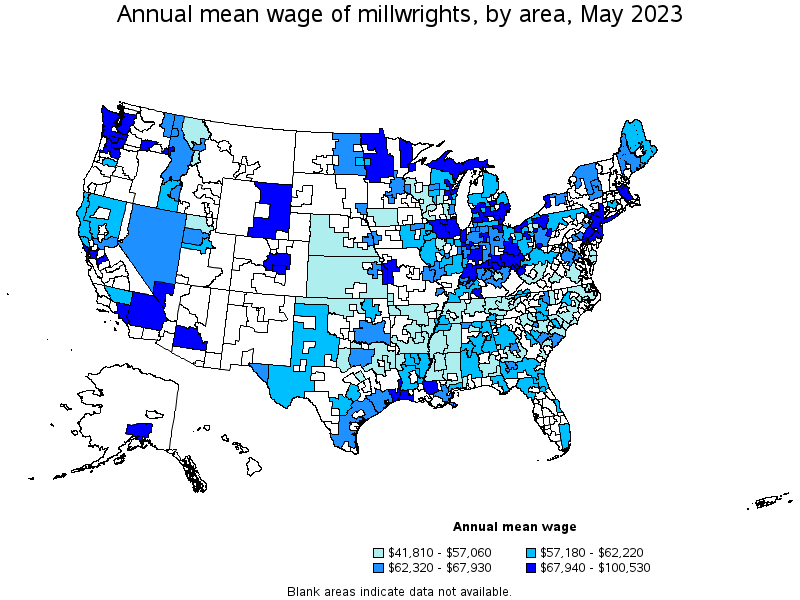
Top paying states for Millwrights:
| State | Employment (1) | Employment per thousand jobs | Location quotient (9) | Hourly mean wage | Annual mean wage (2) |
|---|---|---|---|---|---|
| Massachusetts | 140 | 0.04 | 0.16 | $ 37.76 | $ 78,540 |
| Washington | 950 | 0.27 | 1.09 | $ 37.00 | $ 76,960 |
| New Jersey | 310 | 0.07 | 0.29 | $ 35.72 | $ 74,300 |
| Oregon | 350 | 0.18 | 0.71 | $ 35.31 | $ 73,450 |
| Michigan | 2,760 | 0.64 | 2.55 | $ 35.20 | $ 73,220 |
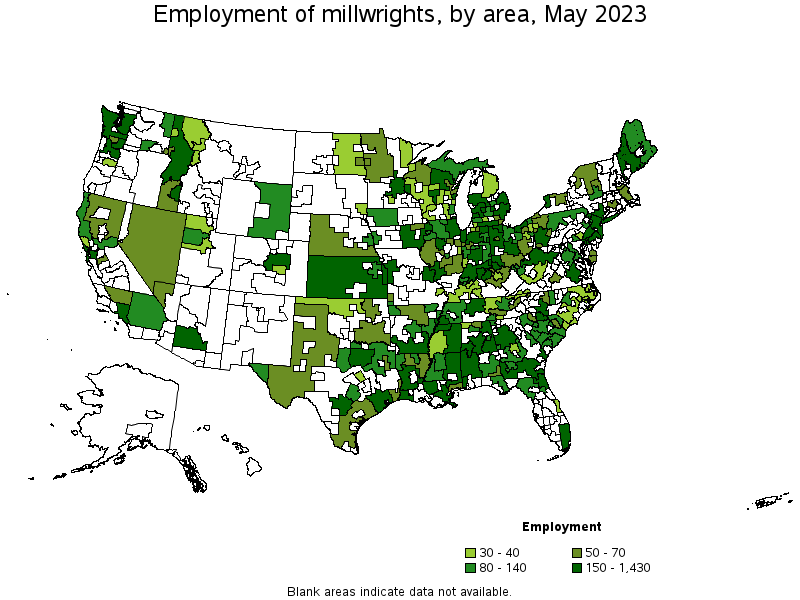
Metropolitan areas with the highest employment level in Millwrights:
| Metropolitan area | Employment (1) | Employment per thousand jobs | Location quotient (9) | Hourly mean wage | Annual mean wage (2) |
|---|---|---|---|---|---|
| Chicago-Naperville-Elgin, IL-IN-WI | 1,430 | 0.32 | 1.27 | $ 35.31 | $ 73,440 |
| Detroit-Warren-Dearborn, MI | 1,420 | 0.75 | 3.00 | $ 36.83 | $ 76,600 |
| Atlanta-Sandy Springs-Roswell, GA | 990 | 0.35 | 1.41 | $ 28.98 | $ 60,280 |
| Kansas City, MO-KS | 940 | 0.87 | 3.50 | $ 34.19 | $ 71,100 |
| Houston-The Woodlands-Sugar Land, TX | 650 | 0.21 | 0.82 | $ 30.98 | $ 64,440 |
| Birmingham-Hoover, AL | 540 | 1.06 | 4.26 | $ 27.87 | $ 57,960 |
| Dallas-Fort Worth-Arlington, TX | 500 | 0.13 | 0.50 | $ 32.03 | $ 66,620 |
| Los Angeles-Long Beach-Anaheim, CA | 480 | 0.08 | 0.31 | $ 34.13 | $ 70,990 |
| New York-Newark-Jersey City, NY-NJ-PA | 390 | 0.04 | 0.17 | $ 38.75 | $ 80,600 |
| Phoenix-Mesa-Scottsdale, AZ | 390 | 0.17 | 0.69 | $ 33.85 | $ 70,400 |
Metropolitan areas with the highest concentration of jobs and location quotients in Millwrights:
| Metropolitan area | Employment (1) | Employment per thousand jobs | Location quotient (9) | Hourly mean wage | Annual mean wage (2) |
|---|---|---|---|---|---|
| Lake Charles, LA | 350 | 3.89 | 15.58 | $ 37.69 | $ 78,390 |
| Decatur, AL | 120 | 2.08 | 8.33 | $ 25.29 | $ 52,590 |
| Anniston-Oxford-Jacksonville, AL | 80 | 1.80 | 7.22 | $ 28.16 | $ 58,570 |
| Decatur, IL | 80 | 1.79 | 7.16 | $ 29.96 | $ 62,320 |
| Albany, GA | 100 | 1.75 | 7.02 | $ 30.21 | $ 62,840 |
| Tuscaloosa, AL | 170 | 1.68 | 6.72 | $ 28.70 | $ 59,690 |
| Lewiston, ID-WA | 50 | 1.66 | 6.64 | $ 35.06 | $ 72,920 |
| Longview, WA | 70 | 1.63 | 6.54 | $ 35.16 | $ 73,130 |
| Monroe, MI | 60 | 1.44 | 5.78 | $ 33.59 | $ 69,860 |
| Lima, OH | 70 | 1.41 | 5.64 | $ 31.49 | $ 65,500 |
Top paying metropolitan areas for Millwrights:
| Metropolitan area | Employment (1) | Employment per thousand jobs | Location quotient (9) | Hourly mean wage | Annual mean wage (2) |
|---|---|---|---|---|---|
| Kennewick-Richland, WA | 80 | 0.66 | 2.63 | $ 48.33 | $ 100,530 |
| Boston-Cambridge-Nashua, MA-NH | 50 | 0.02 | 0.07 | $ 45.28 | $ 94,170 |
| San Francisco-Oakland-Hayward, CA | 150 | 0.06 | 0.25 | $ 41.50 | $ 86,320 |
| Modesto, CA | 50 | 0.26 | 1.04 | $ 41.13 | $ 85,550 |
| Seattle-Tacoma-Bellevue, WA | 280 | 0.13 | 0.54 | $ 40.40 | $ 84,040 |
| New York-Newark-Jersey City, NY-NJ-PA | 390 | 0.04 | 0.17 | $ 38.75 | $ 80,600 |
| Lake Charles, LA | 350 | 3.89 | 15.58 | $ 37.69 | $ 78,390 |
| Portland-Vancouver-Hillsboro, OR-WA | 260 | 0.21 | 0.85 | $ 37.29 | $ 77,570 |
| Detroit-Warren-Dearborn, MI | 1,420 | 0.75 | 3.00 | $ 36.83 | $ 76,600 |
| Philadelphia-Camden-Wilmington, PA-NJ-DE-MD | 330 | 0.12 | 0.46 | $ 36.66 | $ 76,260 |
Nonmetropolitan areas with the highest employment in Millwrights:
| Nonmetropolitan area | Employment (1) | Employment per thousand jobs | Location quotient (9) | Hourly mean wage | Annual mean wage (2) |
|---|---|---|---|---|---|
| Kansas nonmetropolitan area | 270 | 0.71 | 2.83 | $ 24.89 | $ 51,760 |
| Southwest Alabama nonmetropolitan area | 270 | 3.96 | 15.84 | $ 29.16 | $ 60,660 |
| South Georgia nonmetropolitan area | 250 | 1.29 | 5.17 | $ 27.54 | $ 57,270 |
| Western Washington nonmetropolitan area | 240 | 1.89 | 7.56 | $ 34.38 | $ 71,510 |
| Northwestern Idaho nonmetropolitan area | 230 | 3.09 | 12.38 | $ 32.12 | $ 66,820 |
Nonmetropolitan areas with the highest concentration of jobs and location quotients in Millwrights:
| Nonmetropolitan area | Employment (1) | Employment per thousand jobs | Location quotient (9) | Hourly mean wage | Annual mean wage (2) |
|---|---|---|---|---|---|
| Southwest Alabama nonmetropolitan area | 270 | 3.96 | 15.84 | $ 29.16 | $ 60,660 |
| Northwestern Idaho nonmetropolitan area | 230 | 3.09 | 12.38 | $ 32.12 | $ 66,820 |
| South Arkansas nonmetropolitan area | 190 | 2.06 | 8.26 | $ 25.85 | $ 53,770 |
| East Arkansas nonmetropolitan area | 130 | 1.98 | 7.92 | $ 22.74 | $ 47,310 |
| Central Louisiana nonmetropolitan area | 150 | 1.94 | 7.77 | $ 27.56 | $ 57,320 |
Top paying nonmetropolitan areas for Millwrights:
| Nonmetropolitan area | Employment (1) | Employment per thousand jobs | Location quotient (9) | Hourly mean wage | Annual mean wage (2) |
|---|---|---|---|---|---|
| Western Pennsylvania nonmetropolitan area | 70 | 0.48 | 1.93 | $ 36.94 | $ 76,840 |
| Northwest Illinois nonmetropolitan area | 80 | 0.59 | 2.37 | $ 35.37 | $ 73,580 |
| Northwest Minnesota nonmetropolitan area | 60 | 0.32 | 1.30 | $ 34.69 | $ 72,160 |
| Western Washington nonmetropolitan area | 240 | 1.89 | 7.56 | $ 34.38 | $ 71,510 |
| Eastern Wyoming nonmetropolitan area | 90 | 1.10 | 4.39 | $ 33.19 | $ 69,030 |
These estimates are calculated with data collected from employers in all industry sectors, all metropolitan and nonmetropolitan areas, and all states and the District of Columbia. The top employment and wage figures are provided above. The complete list is available in the downloadable XLS files.
The percentile wage estimate is the value of a wage below which a certain percent of workers fall. The median wage is the 50th percentile wage estimate—50 percent of workers earn less than the median and 50 percent of workers earn more than the median. More about percentile wages.
(1) Estimates for detailed occupations do not sum to the totals because the totals include occupations not shown separately. Estimates do not include self-employed workers.
(2) Annual wages have been calculated by multiplying the hourly mean wage by a "year-round, full-time" hours figure of 2,080 hours; for those occupations where there is not an hourly wage published, the annual wage has been directly calculated from the reported survey data.
(3) The relative standard error (RSE) is a measure of the reliability of a survey statistic. The smaller the relative standard error, the more precise the estimate.
(7) The value is less than .005 percent of industry employment.
(8) Estimate not released.
(9) The location quotient is the ratio of the area concentration of occupational employment to the national average concentration. A location quotient greater than one indicates the occupation has a higher share of employment than average, and a location quotient less than one indicates the occupation is less prevalent in the area than average.
Other OEWS estimates and related information:
May 2023 National Occupational Employment and Wage Estimates
May 2023 State Occupational Employment and Wage Estimates
May 2023 Metropolitan and Nonmetropolitan Area Occupational Employment and Wage Estimates
May 2023 National Industry-Specific Occupational Employment and Wage Estimates
Last Modified Date: April 3, 2024