
An official website of the United States government
An official website of the United States government
The .gov means it's official.
Federal government websites often end in .gov or .mil. Before sharing sensitive information,
make sure you're on a federal government site.
The site is secure.
The
https:// ensures that you are connecting to the official website and that any
information you provide is encrypted and transmitted securely.
Plan, direct, or coordinate the selling, buying, leasing, or governance activities of commercial, industrial, or residential real estate properties. Includes managers of homeowner and condominium associations, rented or leased housing units, buildings, or land (including rights-of-way).
Employment estimate and mean wage estimates for Property, Real Estate, and Community Association Managers:
| Employment (1) | Employment RSE (3) |
Mean hourly wage |
Mean annual wage (2) |
Wage RSE (3) |
|---|---|---|---|---|
| 284,120 | 1.1 % | $ 37.69 | $ 78,400 | 1.2 % |
Percentile wage estimates for Property, Real Estate, and Community Association Managers:
| Percentile | 10% | 25% | 50% (Median) |
75% | 90% |
|---|---|---|---|---|---|
| Hourly Wage | $ 18.05 | $ 23.05 | $ 30.22 | $ 44.50 | $ 65.38 |
| Annual Wage (2) | $ 37,540 | $ 47,940 | $ 62,850 | $ 92,560 | $ 135,990 |
Industries with the highest published employment and wages for Property, Real Estate, and Community Association Managers are provided. For a list of all industries with employment in Property, Real Estate, and Community Association Managers, see the Create Customized Tables function.
Industries with the highest levels of employment in Property, Real Estate, and Community Association Managers:
| Industry | Employment (1) | Percent of industry employment | Hourly mean wage | Annual mean wage (2) |
|---|---|---|---|---|
| Real Estate | 229,840 | 12.69 | $ 35.28 | $ 73,380 |
| Management of Companies and Enterprises | 8,850 | 0.32 | $ 57.36 | $ 119,300 |
| Local Government, excluding Schools and Hospitals (OEWS Designation) | 5,980 | 0.11 | $ 39.09 | $ 81,310 |
| Business, Professional, Labor, Political, and Similar Organizations | 5,360 | 1.25 | $ 32.98 | $ 68,590 |
| Residential Building Construction | 3,160 | 0.34 | $ 53.09 | $ 110,430 |
Industries with the highest concentration of employment in Property, Real Estate, and Community Association Managers:
| Industry | Employment (1) | Percent of industry employment | Hourly mean wage | Annual mean wage (2) |
|---|---|---|---|---|
| Real Estate | 229,840 | 12.69 | $ 35.28 | $ 73,380 |
| Land Subdivision | 1,450 | 4.21 | $ 55.34 | $ 115,100 |
| Other Investment Pools and Funds | 370 | 2.00 | $ 41.21 | $ 85,710 |
| Business, Professional, Labor, Political, and Similar Organizations | 5,360 | 1.25 | $ 32.98 | $ 68,590 |
| Rooming and Boarding Houses, Dormitories, and Workers' Camps | 120 | 1.16 | $ 26.32 | $ 54,740 |
Top paying industries for Property, Real Estate, and Community Association Managers:
| Industry | Employment (1) | Percent of industry employment | Hourly mean wage | Annual mean wage (2) |
|---|---|---|---|---|
| Agencies, Brokerages, and Other Insurance Related Activities | 100 | 0.01 | $ 86.46 | $ 179,830 |
| Oil and Gas Extraction | 1,080 | 0.99 | $ 85.19 | $ 177,200 |
| Computer Systems Design and Related Services | 160 | 0.01 | $ 83.71 | $ 174,110 |
| Electric Power Generation, Transmission and Distribution | 170 | 0.04 | $ 81.32 | $ 169,150 |
| Support Activities for Mining | 420 | 0.15 | $ 78.95 | $ 164,210 |
States and areas with the highest published employment, location quotients, and wages for Property, Real Estate, and Community Association Managers are provided. For a list of all areas with employment in Property, Real Estate, and Community Association Managers, see the Create Customized Tables function.
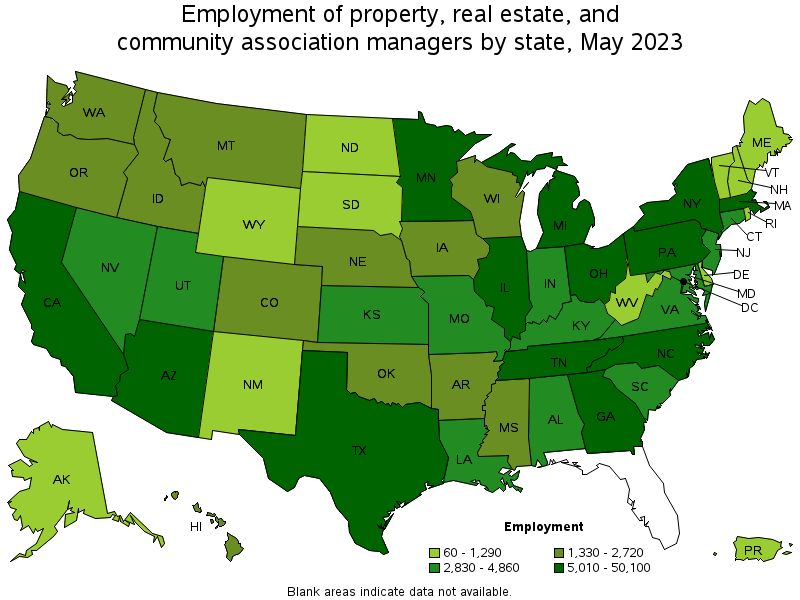
States with the highest employment level in Property, Real Estate, and Community Association Managers:
| State | Employment (1) | Employment per thousand jobs | Location quotient (9) | Hourly mean wage | Annual mean wage (2) |
|---|---|---|---|---|---|
| California | 50,100 | 2.79 | 1.49 | $ 40.86 | $ 84,990 |
| Texas | 31,810 | 2.35 | 1.25 | $ 36.66 | $ 76,240 |
| Illinois | 12,550 | 2.09 | 1.12 | $ 39.09 | $ 81,310 |
| New York | 10,480 | 1.12 | 0.60 | $ 55.79 | $ 116,050 |
| Ohio | 9,500 | 1.74 | 0.93 | $ 29.55 | $ 61,470 |
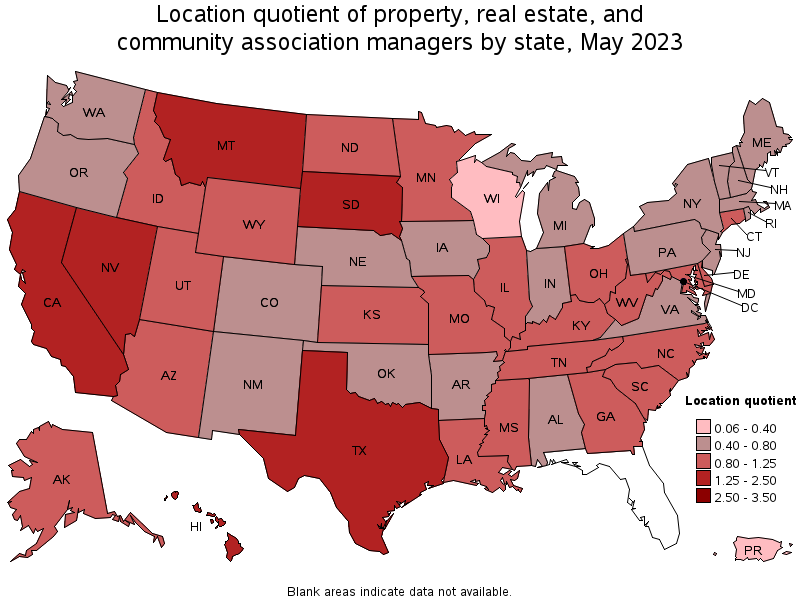
States with the highest concentration of jobs and location quotients in Property, Real Estate, and Community Association Managers:
| State | Employment (1) | Employment per thousand jobs | Location quotient (9) | Hourly mean wage | Annual mean wage (2) |
|---|---|---|---|---|---|
| District of Columbia | 2,250 | 3.21 | 1.71 | $ 47.08 | $ 97,920 |
| Hawaii | 1,830 | 2.96 | 1.58 | $ 33.84 | $ 70,380 |
| California | 50,100 | 2.79 | 1.49 | $ 40.86 | $ 84,990 |
| Nevada | 4,100 | 2.77 | 1.48 | $ 32.72 | $ 68,060 |
| Montana | 1,360 | 2.71 | 1.45 | $ 24.77 | $ 51,520 |
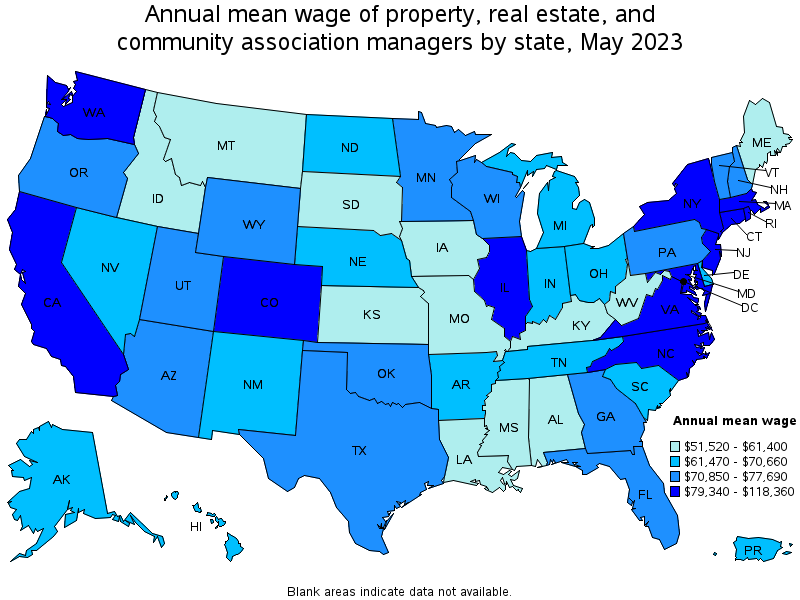
Top paying states for Property, Real Estate, and Community Association Managers:
| State | Employment (1) | Employment per thousand jobs | Location quotient (9) | Hourly mean wage | Annual mean wage (2) |
|---|---|---|---|---|---|
| Washington | 2,720 | 0.78 | 0.42 | $ 56.90 | $ 118,360 |
| New York | 10,480 | 1.12 | 0.60 | $ 55.79 | $ 116,050 |
| Colorado | 2,290 | 0.81 | 0.43 | $ 55.04 | $ 114,490 |
| District of Columbia | 2,250 | 3.21 | 1.71 | $ 47.08 | $ 97,920 |
| Massachusetts | 5,410 | 1.49 | 0.79 | $ 46.23 | $ 96,160 |
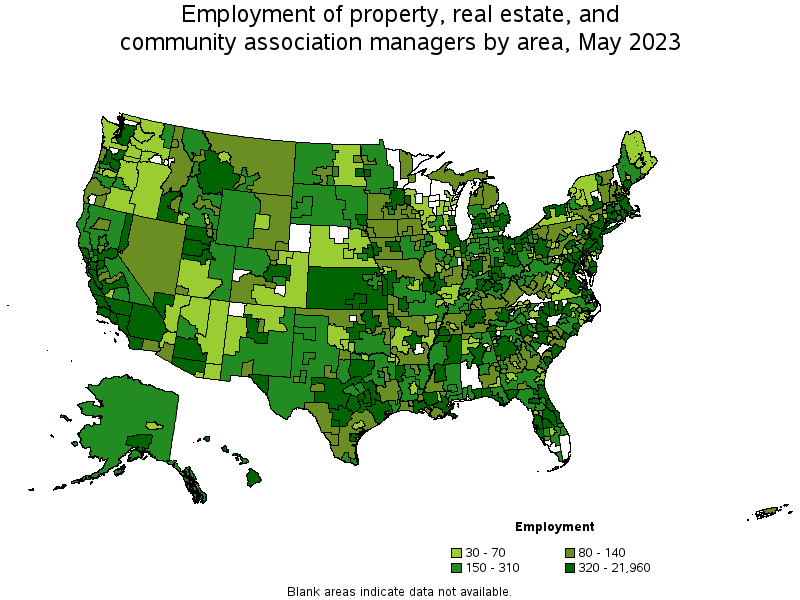
Metropolitan areas with the highest employment level in Property, Real Estate, and Community Association Managers:
| Metropolitan area | Employment (1) | Employment per thousand jobs | Location quotient (9) | Hourly mean wage | Annual mean wage (2) |
|---|---|---|---|---|---|
| Los Angeles-Long Beach-Anaheim, CA | 21,960 | 3.55 | 1.90 | $ 39.47 | $ 82,090 |
| New York-Newark-Jersey City, NY-NJ-PA | 11,850 | 1.25 | 0.67 | $ 54.23 | $ 112,800 |
| Chicago-Naperville-Elgin, IL-IN-WI | 10,610 | 2.35 | 1.26 | $ 40.51 | $ 84,250 |
| Dallas-Fort Worth-Arlington, TX | 10,420 | 2.63 | 1.40 | $ 36.00 | $ 74,870 |
| Houston-The Woodlands-Sugar Land, TX | 8,570 | 2.70 | 1.44 | $ 40.84 | $ 84,940 |
| San Francisco-Oakland-Hayward, CA | 7,350 | 3.04 | 1.62 | $ 47.59 | $ 99,000 |
| Washington-Arlington-Alexandria, DC-VA-MD-WV | 6,400 | 2.07 | 1.11 | $ 47.14 | $ 98,050 |
| Atlanta-Sandy Springs-Roswell, GA | 5,060 | 1.80 | 0.96 | $ 37.94 | $ 78,910 |
| Phoenix-Mesa-Scottsdale, AZ | 5,040 | 2.20 | 1.18 | $ 36.27 | $ 75,430 |
| Boston-Cambridge-Nashua, MA-NH | 4,430 | 1.61 | 0.86 | $ 48.11 | $ 100,060 |
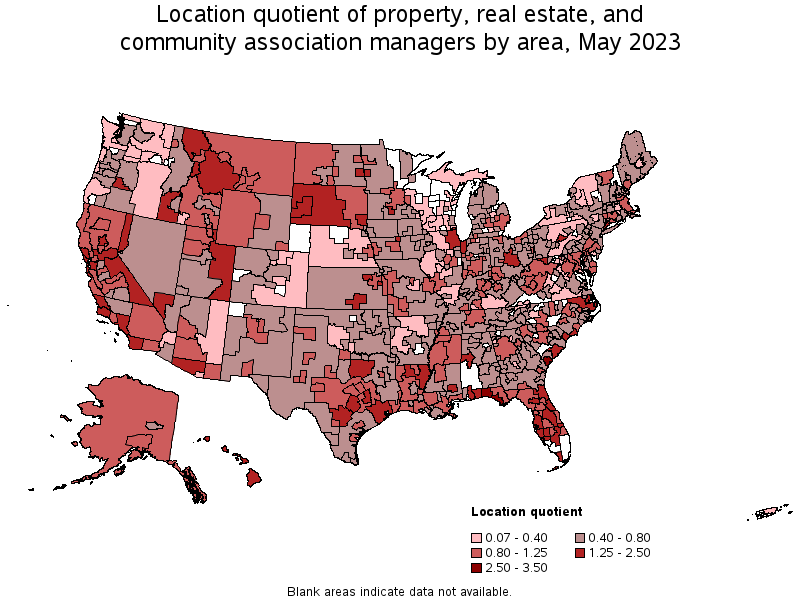
Metropolitan areas with the highest concentration of jobs and location quotients in Property, Real Estate, and Community Association Managers:
| Metropolitan area | Employment (1) | Employment per thousand jobs | Location quotient (9) | Hourly mean wage | Annual mean wage (2) |
|---|---|---|---|---|---|
| Panama City, FL | 490 | 5.83 | 3.11 | $ 31.45 | $ 65,410 |
| Crestview-Fort Walton Beach-Destin, FL | 640 | 5.26 | 2.81 | $ 30.73 | $ 63,910 |
| Hilton Head Island-Bluffton-Beaufort, SC | 380 | 4.73 | 2.53 | $ 35.76 | $ 74,380 |
| North Port-Sarasota-Bradenton, FL | 1,270 | 3.93 | 2.10 | $ 35.73 | $ 74,310 |
| Sebastian-Vero Beach, FL | 210 | 3.74 | 2.00 | $ 29.43 | $ 61,210 |
| Manhattan, KS | 150 | 3.64 | 1.95 | $ 22.40 | $ 46,590 |
| Sacramento--Roseville--Arden-Arcade, CA | 3,810 | 3.64 | 1.95 | $ 38.51 | $ 80,090 |
| Los Angeles-Long Beach-Anaheim, CA | 21,960 | 3.55 | 1.90 | $ 39.47 | $ 82,090 |
| Chico, CA | 280 | 3.53 | 1.89 | $ 29.06 | $ 60,440 |
| Reno, NV | 880 | 3.47 | 1.85 | $ 31.66 | $ 65,840 |
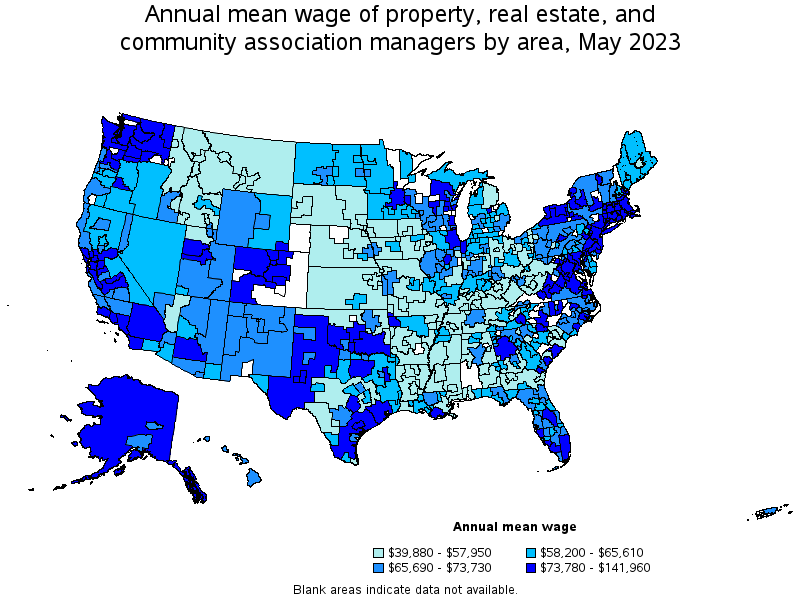
Top paying metropolitan areas for Property, Real Estate, and Community Association Managers:
| Metropolitan area | Employment (1) | Employment per thousand jobs | Location quotient (9) | Hourly mean wage | Annual mean wage (2) |
|---|---|---|---|---|---|
| Midland, TX | 240 | 2.11 | 1.13 | $ 68.25 | $ 141,960 |
| Bremerton-Silverdale, WA | 40 | 0.44 | 0.24 | $ 62.32 | $ 129,620 |
| Greeley, CO | 60 | 0.54 | 0.29 | $ 61.79 | $ 128,510 |
| Seattle-Tacoma-Bellevue, WA | 1,940 | 0.93 | 0.50 | $ 59.18 | $ 123,090 |
| Denver-Aurora-Lakewood, CO | 1,400 | 0.88 | 0.47 | $ 58.97 | $ 122,650 |
| New York-Newark-Jersey City, NY-NJ-PA | 11,850 | 1.25 | 0.67 | $ 54.23 | $ 112,800 |
| Olympia-Tumwater, WA | 70 | 0.57 | 0.31 | $ 53.94 | $ 112,180 |
| Kennewick-Richland, WA | 40 | 0.32 | 0.17 | $ 52.46 | $ 109,120 |
| Spokane-Spokane Valley, WA | 150 | 0.59 | 0.32 | $ 51.61 | $ 107,350 |
| Bellingham, WA | 40 | 0.48 | 0.26 | $ 51.25 | $ 106,590 |
Nonmetropolitan areas with the highest employment in Property, Real Estate, and Community Association Managers:
| Nonmetropolitan area | Employment (1) | Employment per thousand jobs | Location quotient (9) | Hourly mean wage | Annual mean wage (2) |
|---|---|---|---|---|---|
| Southwest Montana nonmetropolitan area | 580 | 3.87 | 2.07 | $ 25.72 | $ 53,490 |
| Kansas nonmetropolitan area | 460 | 1.20 | 0.64 | $ 25.33 | $ 52,680 |
| Northeast Mississippi nonmetropolitan area | 450 | 1.98 | 1.06 | $ 22.70 | $ 47,220 |
| Hawaii / Kauai nonmetropolitan area | 430 | 4.19 | 2.24 | $ 33.21 | $ 69,070 |
| North Northeastern Ohio nonmetropolitan area (noncontiguous) | 390 | 1.20 | 0.64 | $ 23.33 | $ 48,530 |
Nonmetropolitan areas with the highest concentration of jobs and location quotients in Property, Real Estate, and Community Association Managers:
| Nonmetropolitan area | Employment (1) | Employment per thousand jobs | Location quotient (9) | Hourly mean wage | Annual mean wage (2) |
|---|---|---|---|---|---|
| Hawaii / Kauai nonmetropolitan area | 430 | 4.19 | 2.24 | $ 33.21 | $ 69,070 |
| Southwest Montana nonmetropolitan area | 580 | 3.87 | 2.07 | $ 25.72 | $ 53,490 |
| West Montana nonmetropolitan area | 270 | 3.24 | 1.73 | $ 22.95 | $ 47,730 |
| Northeast Coastal North Carolina nonmetropolitan area | 270 | 2.96 | 1.58 | $ 34.02 | $ 70,770 |
| South Florida nonmetropolitan area | 250 | 2.92 | 1.56 | $ 32.24 | $ 67,060 |
Top paying nonmetropolitan areas for Property, Real Estate, and Community Association Managers:
| Nonmetropolitan area | Employment (1) | Employment per thousand jobs | Location quotient (9) | Hourly mean wage | Annual mean wage (2) |
|---|---|---|---|---|---|
| Eastern Washington nonmetropolitan area | 40 | 0.39 | 0.21 | $ 51.03 | $ 106,140 |
| Northwest Colorado nonmetropolitan area | 180 | 1.42 | 0.76 | $ 50.90 | $ 105,870 |
| West Texas Region of Texas nonmetropolitan area | 190 | 0.99 | 0.53 | $ 48.31 | $ 100,480 |
| Western Washington nonmetropolitan area | 70 | 0.57 | 0.31 | $ 42.68 | $ 88,770 |
| Massachusetts nonmetropolitan area | 80 | 1.22 | 0.65 | $ 40.97 | $ 85,220 |
These estimates are calculated with data collected from employers in all industry sectors, all metropolitan and nonmetropolitan areas, and all states and the District of Columbia. The top employment and wage figures are provided above. The complete list is available in the downloadable XLS files.
The percentile wage estimate is the value of a wage below which a certain percent of workers fall. The median wage is the 50th percentile wage estimate—50 percent of workers earn less than the median and 50 percent of workers earn more than the median. More about percentile wages.
(1) Estimates for detailed occupations do not sum to the totals because the totals include occupations not shown separately. Estimates do not include self-employed workers.
(2) Annual wages have been calculated by multiplying the hourly mean wage by a "year-round, full-time" hours figure of 2,080 hours; for those occupations where there is not an hourly wage published, the annual wage has been directly calculated from the reported survey data.
(3) The relative standard error (RSE) is a measure of the reliability of a survey statistic. The smaller the relative standard error, the more precise the estimate.
(9) The location quotient is the ratio of the area concentration of occupational employment to the national average concentration. A location quotient greater than one indicates the occupation has a higher share of employment than average, and a location quotient less than one indicates the occupation is less prevalent in the area than average.
Other OEWS estimates and related information:
May 2023 National Occupational Employment and Wage Estimates
May 2023 State Occupational Employment and Wage Estimates
May 2023 Metropolitan and Nonmetropolitan Area Occupational Employment and Wage Estimates
May 2023 National Industry-Specific Occupational Employment and Wage Estimates
Last Modified Date: April 3, 2024