
An official website of the United States government
An official website of the United States government
The .gov means it's official.
Federal government websites often end in .gov or .mil. Before sharing sensitive information,
make sure you're on a federal government site.
The site is secure.
The
https:// ensures that you are connecting to the official website and that any
information you provide is encrypted and transmitted securely.
Arbitrate, advise, adjudicate, or administer justice in a court of law. May sentence defendant in criminal cases according to government statutes or sentencing guidelines. May determine liability of defendant in civil cases. May perform wedding ceremonies.
Employment estimate and mean wage estimates for Judges, Magistrate Judges, and Magistrates:
| Employment (1) | Employment RSE (3) |
Mean hourly wage |
Mean annual wage (2) |
Wage RSE (3) |
|---|---|---|---|---|
| 24,470 | 1.1 % | $ 66.83 | $ 139,000 | 0.8 % |
Percentile wage estimates for Judges, Magistrate Judges, and Magistrates:
| Percentile | 10% | 25% | 50% (Median) |
75% | 90% |
|---|---|---|---|---|---|
| Hourly Wage | $ 22.09 | $ 40.53 | $ 71.59 | $ 87.60 | $ 101.39 |
| Annual Wage (2) | $ 45,950 | $ 84,300 | $ 148,910 | $ 182,200 | $ 210,890 |
Industries with the highest published employment and wages for Judges, Magistrate Judges, and Magistrates are provided. For a list of all industries with employment in Judges, Magistrate Judges, and Magistrates, see the Create Customized Tables function.
Industries with the highest levels of employment in Judges, Magistrate Judges, and Magistrates:
| Industry | Employment (1) | Percent of industry employment | Hourly mean wage | Annual mean wage (2) |
|---|---|---|---|---|
| State Government, excluding Schools and Hospitals (OEWS Designation) | 13,420 | 0.63 | $ 76.09 | $ 158,260 |
| Local Government, excluding Schools and Hospitals (OEWS Designation) | 11,050 | 0.20 | $ 55.58 | $ 115,600 |
Industries with the highest concentration of employment in Judges, Magistrate Judges, and Magistrates:
| Industry | Employment (1) | Percent of industry employment | Hourly mean wage | Annual mean wage (2) |
|---|---|---|---|---|
| State Government, excluding Schools and Hospitals (OEWS Designation) | 13,420 | 0.63 | $ 76.09 | $ 158,260 |
| Local Government, excluding Schools and Hospitals (OEWS Designation) | 11,050 | 0.20 | $ 55.58 | $ 115,600 |
Top paying industries for Judges, Magistrate Judges, and Magistrates:
| Industry | Employment (1) | Percent of industry employment | Hourly mean wage | Annual mean wage (2) |
|---|---|---|---|---|
| State Government, excluding Schools and Hospitals (OEWS Designation) | 13,420 | 0.63 | $ 76.09 | $ 158,260 |
| Local Government, excluding Schools and Hospitals (OEWS Designation) | 11,050 | 0.20 | $ 55.58 | $ 115,600 |
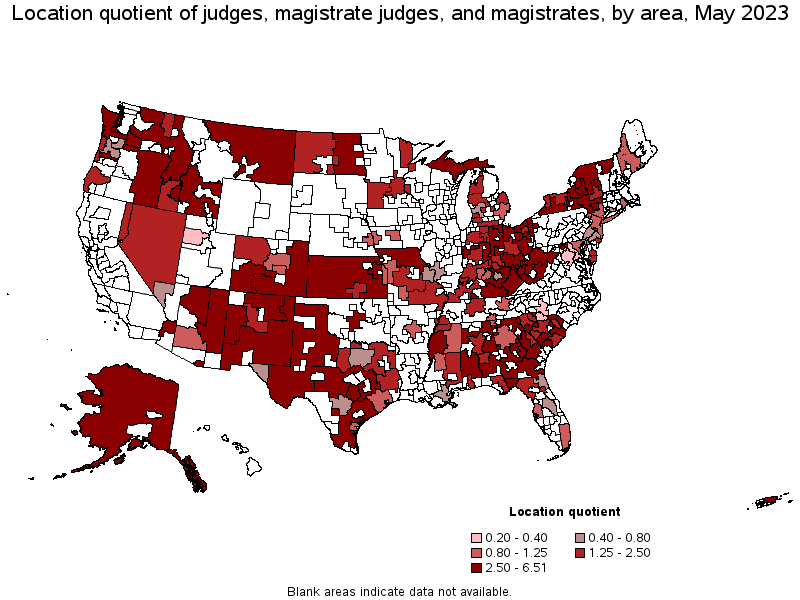
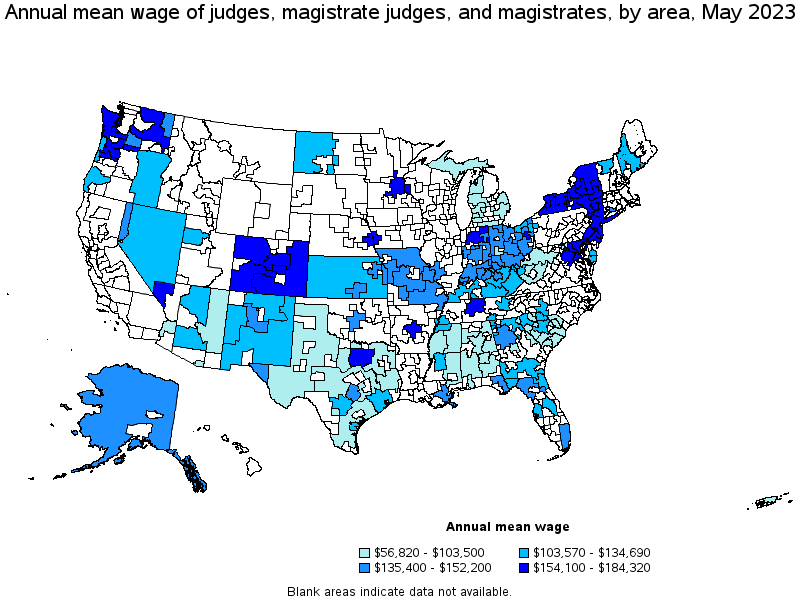
States and areas with the highest published employment, location quotients, and wages for Judges, Magistrate Judges, and Magistrates are provided. For a list of all areas with employment in Judges, Magistrate Judges, and Magistrates, see the Create Customized Tables function.
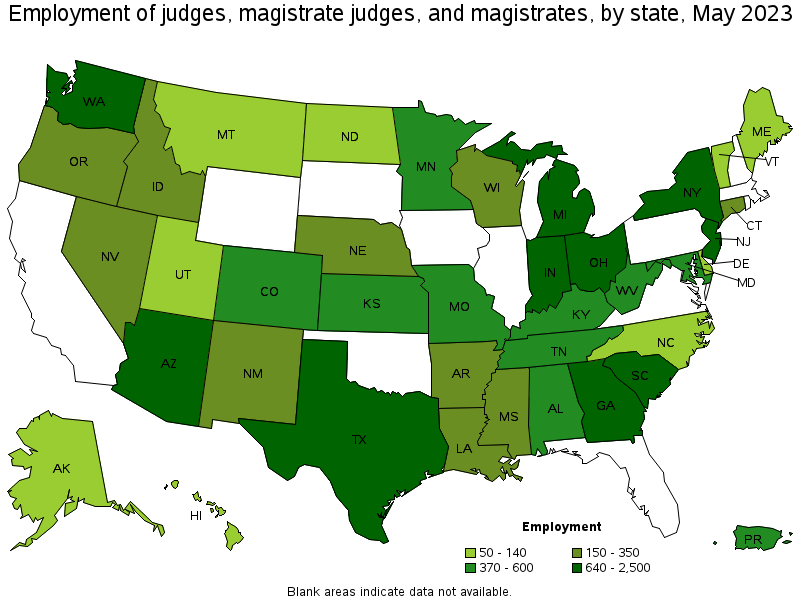
States with the highest employment level in Judges, Magistrate Judges, and Magistrates:
| State | Employment (1) | Employment per thousand jobs | Location quotient (9) | Hourly mean wage | Annual mean wage (2) |
|---|---|---|---|---|---|
| New York | 2,500 | 0.27 | 1.66 | $ 89.02 | $ 185,160 |
| Ohio | 2,280 | 0.42 | 2.59 | $ 64.37 | $ 133,880 |
| Texas | 2,250 | 0.17 | 1.03 | $ 60.94 | $ 126,750 |
| Georgia | 1,230 | 0.26 | 1.60 | $ 62.18 | $ 129,340 |
| Washington | 1,030 | 0.29 | 1.82 | $ 72.91 | $ 151,640 |
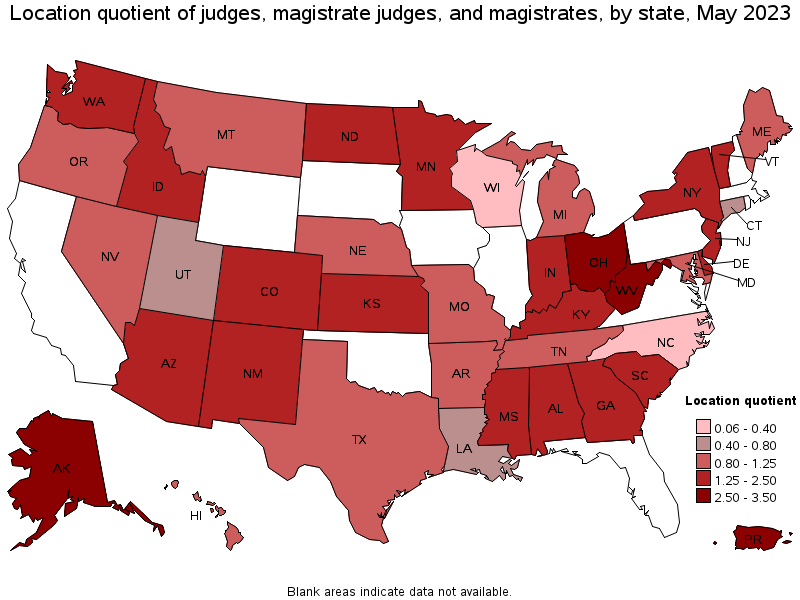
States with the highest concentration of jobs and location quotients in Judges, Magistrate Judges, and Magistrates:
| State | Employment (1) | Employment per thousand jobs | Location quotient (9) | Hourly mean wage | Annual mean wage (2) |
|---|---|---|---|---|---|
| West Virginia | 370 | 0.54 | 3.35 | $ 42.88 | $ 89,180 |
| Alaska | 140 | 0.46 | 2.84 | $ 76.08 | $ 158,240 |
| Ohio | 2,280 | 0.42 | 2.59 | $ 64.37 | $ 133,880 |
| New Mexico | 280 | 0.33 | 2.07 | $ 61.72 | $ 128,370 |
| Idaho | 270 | 0.33 | 2.02 | (8) | (8) |
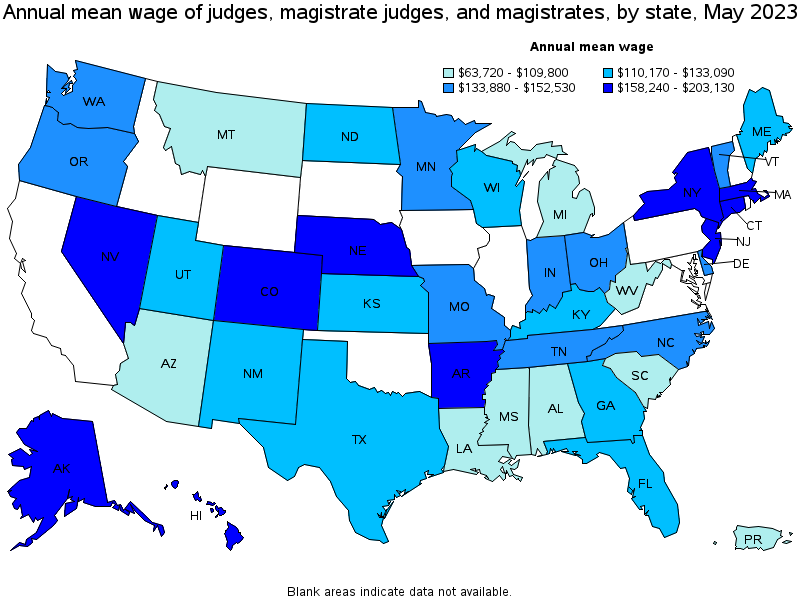
Top paying states for Judges, Magistrate Judges, and Magistrates:
| State | Employment (1) | Employment per thousand jobs | Location quotient (9) | Hourly mean wage | Annual mean wage (2) |
|---|---|---|---|---|---|
| Hawaii | 120 | 0.20 | 1.22 | $ 97.66 | $ 203,130 |
| Massachusetts | (8) | (8) | (8) | $ 91.99 | $ 191,330 |
| New York | 2,500 | 0.27 | 1.66 | $ 89.02 | $ 185,160 |
| Connecticut | 200 | 0.12 | 0.75 | $ 88.61 | $ 184,320 |
| Nebraska | 150 | 0.15 | 0.91 | $ 87.77 | $ 182,560 |
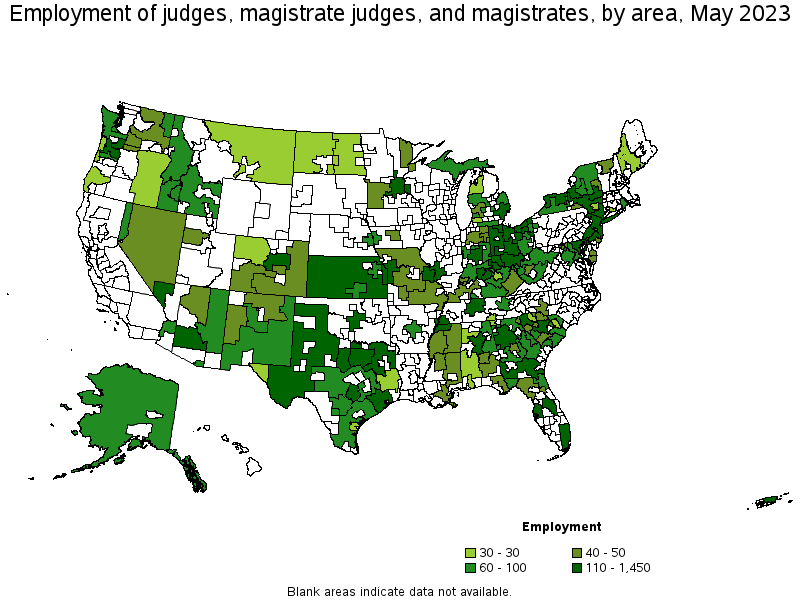
Metropolitan areas with the highest employment level in Judges, Magistrate Judges, and Magistrates:
| Metropolitan area | Employment (1) | Employment per thousand jobs | Location quotient (9) | Hourly mean wage | Annual mean wage (2) |
|---|---|---|---|---|---|
| New York-Newark-Jersey City, NY-NJ-PA | 1,450 | 0.15 | 0.95 | $ 84.38 | $ 175,500 |
| Austin-Round Rock, TX | 650 | 0.53 | 3.27 | $ 69.46 | $ 144,480 |
| Atlanta-Sandy Springs-Roswell, GA | 540 | 0.19 | 1.20 | $ 68.56 | $ 142,600 |
| Cleveland-Elyria, OH | 430 | 0.43 | 2.67 | $ 55.89 | $ 116,260 |
| Houston-The Woodlands-Sugar Land, TX | 430 | 0.14 | 0.84 | $ 61.30 | $ 127,500 |
| Phoenix-Mesa-Scottsdale, AZ | 410 | 0.18 | 1.12 | $ 53.68 | $ 111,650 |
| Minneapolis-St. Paul-Bloomington, MN-WI | 410 | 0.21 | 1.33 | $ 75.87 | $ 157,820 |
| Miami-Fort Lauderdale-West Palm Beach, FL | 380 | 0.14 | 0.87 | $ 66.88 | $ 139,110 |
| Columbus, OH | 370 | 0.35 | 2.15 | $ 71.14 | $ 147,980 |
| Dallas-Fort Worth-Arlington, TX | 360 | 0.09 | 0.56 | $ 81.96 | $ 170,470 |
Metropolitan areas with the highest concentration of jobs and location quotients in Judges, Magistrate Judges, and Magistrates:
| Metropolitan area | Employment (1) | Employment per thousand jobs | Location quotient (9) | Hourly mean wage | Annual mean wage (2) |
|---|---|---|---|---|---|
| Glens Falls, NY | 50 | 1.05 | 6.51 | $ 85.38 | $ 177,600 |
| Utica-Rome, NY | 70 | 0.63 | 3.91 | $ 81.71 | $ 169,950 |
| Kingston, NY | 30 | 0.57 | 3.54 | $ 75.83 | $ 157,720 |
| Flagstaff, AZ | 40 | 0.57 | 3.54 | $ 51.47 | $ 107,070 |
| Topeka, KS | 60 | 0.53 | 3.30 | $ 66.70 | $ 138,740 |
| Oklahoma City, OK | 350 | 0.53 | 3.30 | $ 67.95 | $ 141,330 |
| Austin-Round Rock, TX | 650 | 0.53 | 3.27 | $ 69.46 | $ 144,480 |
| Binghamton, NY | 50 | 0.52 | 3.23 | $ 83.31 | $ 173,290 |
| Canton-Massillon, OH | 80 | 0.51 | 3.17 | $ 75.10 | $ 156,210 |
| Toledo, OH | 150 | 0.51 | 3.15 | $ 73.07 | $ 151,980 |
Top paying metropolitan areas for Judges, Magistrate Judges, and Magistrates:
| Metropolitan area | Employment (1) | Employment per thousand jobs | Location quotient (9) | Hourly mean wage | Annual mean wage (2) |
|---|---|---|---|---|---|
| Buffalo-Cheektowaga-Niagara Falls, NY | 200 | 0.38 | 2.34 | $ 88.62 | $ 184,320 |
| Denver-Aurora-Lakewood, CO | 310 | 0.20 | 1.23 | $ 87.52 | $ 182,040 |
| Omaha-Council Bluffs, NE-IA | 60 | 0.13 | 0.82 | $ 86.10 | $ 179,090 |
| Glens Falls, NY | 50 | 1.05 | 6.51 | $ 85.38 | $ 177,600 |
| New York-Newark-Jersey City, NY-NJ-PA | 1,450 | 0.15 | 0.95 | $ 84.38 | $ 175,500 |
| Atlantic City-Hammonton, NJ | 40 | 0.32 | 1.97 | $ 84.28 | $ 175,300 |
| Colorado Springs, CO | 50 | 0.17 | 1.06 | $ 84.12 | $ 174,970 |
| Rochester, NY | 180 | 0.37 | 2.31 | $ 83.67 | $ 174,030 |
| Binghamton, NY | 50 | 0.52 | 3.23 | $ 83.31 | $ 173,290 |
| Bremerton-Silverdale, WA | 30 | 0.35 | 2.18 | $ 83.29 | $ 173,250 |
Nonmetropolitan areas with the highest employment in Judges, Magistrate Judges, and Magistrates:
| Nonmetropolitan area | Employment (1) | Employment per thousand jobs | Location quotient (9) | Hourly mean wage | Annual mean wage (2) |
|---|---|---|---|---|---|
| North Northeastern Ohio nonmetropolitan area (noncontiguous) | 180 | 0.55 | 3.39 | $ 65.82 | $ 136,900 |
| Kansas nonmetropolitan area | 170 | 0.43 | 2.65 | $ 54.83 | $ 114,040 |
| Central East New York nonmetropolitan area | 160 | 1.02 | 6.36 | $ 85.17 | $ 177,150 |
| South Georgia nonmetropolitan area | 160 | 0.82 | 5.12 | $ 60.38 | $ 125,580 |
| West Northwestern Ohio nonmetropolitan area | 140 | 0.58 | 3.57 | $ 66.61 | $ 138,540 |
Nonmetropolitan areas with the highest concentration of jobs and location quotients in Judges, Magistrate Judges, and Magistrates:
| Nonmetropolitan area | Employment (1) | Employment per thousand jobs | Location quotient (9) | Hourly mean wage | Annual mean wage (2) |
|---|---|---|---|---|---|
| Arizona nonmetropolitan area | 100 | 1.05 | 6.50 | $ 46.88 | $ 97,510 |
| Central East New York nonmetropolitan area | 160 | 1.02 | 6.36 | $ 85.17 | $ 177,150 |
| Southern West Virginia nonmetropolitan area | 70 | 0.95 | 5.89 | $ 44.41 | $ 92,360 |
| Northeast South Carolina nonmetropolitan area | 80 | 0.89 | 5.54 | $ 31.65 | $ 65,840 |
| South Georgia nonmetropolitan area | 160 | 0.82 | 5.12 | $ 60.38 | $ 125,580 |
Top paying nonmetropolitan areas for Judges, Magistrate Judges, and Magistrates:
| Nonmetropolitan area | Employment (1) | Employment per thousand jobs | Location quotient (9) | Hourly mean wage | Annual mean wage (2) |
|---|---|---|---|---|---|
| Capital/Northern New York nonmetropolitan area | 100 | 0.69 | 4.27 | $ 85.64 | $ 178,130 |
| Central East New York nonmetropolitan area | 160 | 1.02 | 6.36 | $ 85.17 | $ 177,150 |
| Eastern and Southern Colorado nonmetropolitan area | 50 | 0.70 | 4.37 | $ 82.02 | $ 170,590 |
| Northwest Colorado nonmetropolitan area | 30 | 0.26 | 1.62 | $ 80.11 | $ 166,630 |
| Southwest Colorado nonmetropolitan area | 50 | 0.46 | 2.83 | $ 78.43 | $ 163,130 |
These estimates are calculated with data collected from employers in all industry sectors, all metropolitan and nonmetropolitan areas, and all states and the District of Columbia. The top employment and wage figures are provided above. The complete list is available in the downloadable XLS files.
The percentile wage estimate is the value of a wage below which a certain percent of workers fall. The median wage is the 50th percentile wage estimate—50 percent of workers earn less than the median and 50 percent of workers earn more than the median. More about percentile wages.
(1) Estimates for detailed occupations do not sum to the totals because the totals include occupations not shown separately. Estimates do not include self-employed workers.
(2) Annual wages have been calculated by multiplying the hourly mean wage by a "year-round, full-time" hours figure of 2,080 hours; for those occupations where there is not an hourly wage published, the annual wage has been directly calculated from the reported survey data.
(3) The relative standard error (RSE) is a measure of the reliability of a survey statistic. The smaller the relative standard error, the more precise the estimate.
(8) Estimate not released.
(9) The location quotient is the ratio of the area concentration of occupational employment to the national average concentration. A location quotient greater than one indicates the occupation has a higher share of employment than average, and a location quotient less than one indicates the occupation is less prevalent in the area than average.
Other OEWS estimates and related information:
May 2023 National Occupational Employment and Wage Estimates
May 2023 State Occupational Employment and Wage Estimates
May 2023 Metropolitan and Nonmetropolitan Area Occupational Employment and Wage Estimates
May 2023 National Industry-Specific Occupational Employment and Wage Estimates
Last Modified Date: April 3, 2024