
An official website of the United States government
An official website of the United States government
The .gov means it's official.
Federal government websites often end in .gov or .mil. Before sharing sensitive information,
make sure you're on a federal government site.
The site is secure.
The
https:// ensures that you are connecting to the official website and that any
information you provide is encrypted and transmitted securely.
Search real estate records, examine titles, or summarize pertinent legal or insurance documents or details for a variety of purposes. May compile lists of mortgages, contracts, and other instruments pertaining to titles by searching public and private records for law firms, real estate agencies, or title insurance companies. Excludes �Loan Officers� (13-2072).
Employment estimate and mean wage estimates for Title Examiners, Abstractors, and Searchers:
| Employment (1) | Employment RSE (3) |
Mean hourly wage |
Mean annual wage (2) |
Wage RSE (3) |
|---|---|---|---|---|
| 49,760 | 2.5 % | $ 28.58 | $ 59,440 | 1.6 % |
Percentile wage estimates for Title Examiners, Abstractors, and Searchers:
| Percentile | 10% | 25% | 50% (Median) |
75% | 90% |
|---|---|---|---|---|---|
| Hourly Wage | $ 17.50 | $ 21.04 | $ 25.74 | $ 33.78 | $ 43.26 |
| Annual Wage (2) | $ 36,400 | $ 43,760 | $ 53,550 | $ 70,260 | $ 89,980 |
Industries with the highest published employment and wages for Title Examiners, Abstractors, and Searchers are provided. For a list of all industries with employment in Title Examiners, Abstractors, and Searchers, see the Create Customized Tables function.
Industries with the highest levels of employment in Title Examiners, Abstractors, and Searchers:
| Industry | Employment (1) | Percent of industry employment | Hourly mean wage | Annual mean wage (2) |
|---|---|---|---|---|
| Legal Services | 21,330 | 1.80 | $ 27.46 | $ 57,120 |
| Insurance Carriers | 14,760 | 1.21 | $ 31.90 | $ 66,350 |
| Real Estate | 3,280 | 0.18 | $ 29.48 | $ 61,330 |
| Automobile Dealers | 1,480 | 0.12 | $ 20.81 | $ 43,280 |
| Agencies, Brokerages, and Other Insurance Related Activities | 1,180 | 0.09 | $ 24.29 | $ 50,520 |
Industries with the highest concentration of employment in Title Examiners, Abstractors, and Searchers:
| Industry | Employment (1) | Percent of industry employment | Hourly mean wage | Annual mean wage (2) |
|---|---|---|---|---|
| Legal Services | 21,330 | 1.80 | $ 27.46 | $ 57,120 |
| Insurance Carriers | 14,760 | 1.21 | $ 31.90 | $ 66,350 |
| Oil and Gas Extraction | 520 | 0.48 | $ 45.38 | $ 94,400 |
| Other Investment Pools and Funds | 30 | 0.19 | $ 31.79 | $ 66,110 |
| Other Support Services | 610 | 0.19 | $ 18.82 | $ 39,150 |
Top paying industries for Title Examiners, Abstractors, and Searchers:
| Industry | Employment (1) | Percent of industry employment | Hourly mean wage | Annual mean wage (2) |
|---|---|---|---|---|
| Electric Power Generation, Transmission and Distribution | 30 | 0.01 | $ 56.81 | $ 118,160 |
| Oil and Gas Extraction | 520 | 0.48 | $ 45.38 | $ 94,400 |
| Management of Companies and Enterprises | 550 | 0.02 | $ 35.17 | $ 73,140 |
| Support Activities for Mining | 180 | 0.06 | $ 34.44 | $ 71,640 |
| Federal, State, and Local Government, excluding State and Local Government Schools and Hospitals and the U.S. Postal Service (OEWS Designation) | 200 | 0.01 | $ 34.20 | $ 71,130 |
States and areas with the highest published employment, location quotients, and wages for Title Examiners, Abstractors, and Searchers are provided. For a list of all areas with employment in Title Examiners, Abstractors, and Searchers, see the Create Customized Tables function.
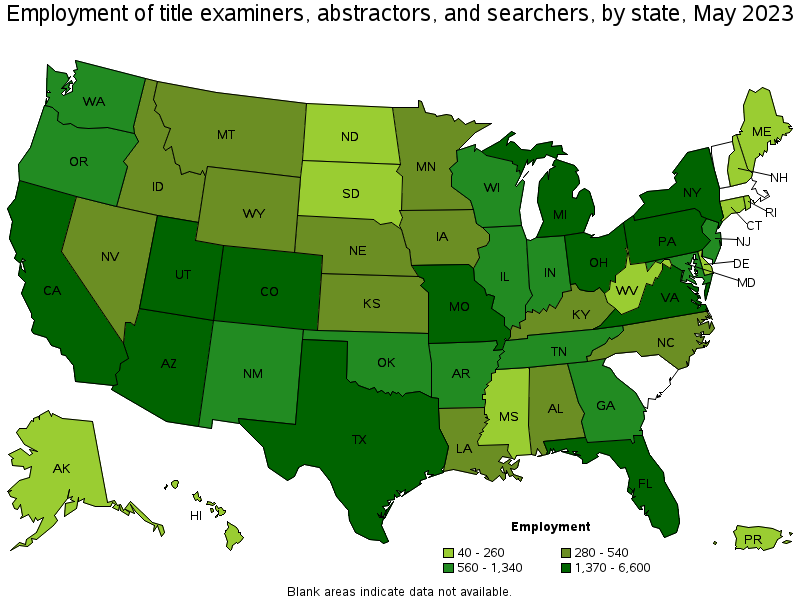
States with the highest employment level in Title Examiners, Abstractors, and Searchers:
| State | Employment (1) | Employment per thousand jobs | Location quotient (9) | Hourly mean wage | Annual mean wage (2) |
|---|---|---|---|---|---|
| Texas | 6,600 | 0.49 | 1.49 | $ 28.24 | $ 58,730 |
| Florida | 4,850 | 0.51 | 1.55 | $ 26.97 | $ 56,090 |
| California | 4,270 | 0.24 | 0.73 | $ 40.64 | $ 84,540 |
| Pennsylvania | 2,780 | 0.47 | 1.43 | $ 24.45 | $ 50,850 |
| Michigan | 2,240 | 0.52 | 1.57 | $ 25.40 | $ 52,830 |
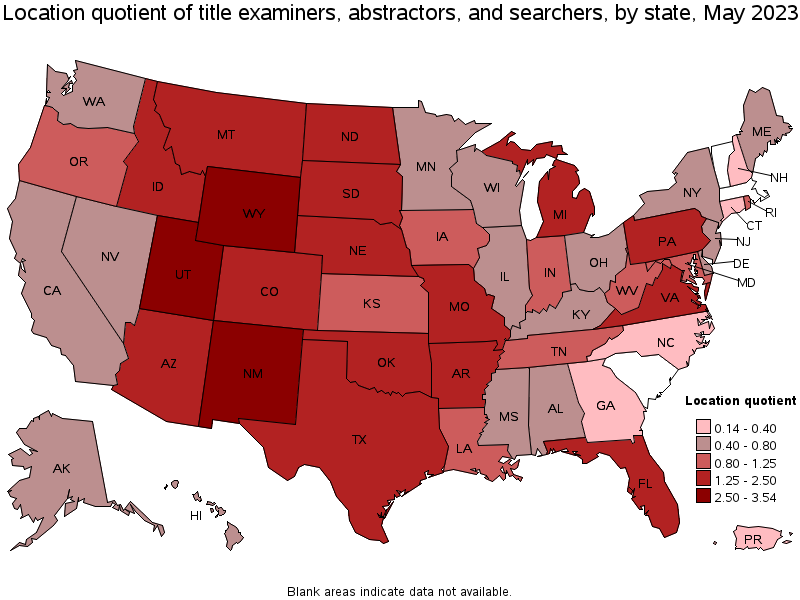
States with the highest concentration of jobs and location quotients in Title Examiners, Abstractors, and Searchers:
| State | Employment (1) | Employment per thousand jobs | Location quotient (9) | Hourly mean wage | Annual mean wage (2) |
|---|---|---|---|---|---|
| Wyoming | 320 | 1.16 | 3.54 | $ 24.88 | $ 51,750 |
| Utah | 1,490 | 0.88 | 2.70 | $ 29.61 | $ 61,590 |
| New Mexico | 730 | 0.86 | 2.62 | $ 25.69 | $ 53,440 |
| Oklahoma | 1,340 | 0.80 | 2.45 | $ 23.14 | $ 48,120 |
| Idaho | 500 | 0.61 | 1.87 | $ 27.55 | $ 57,300 |
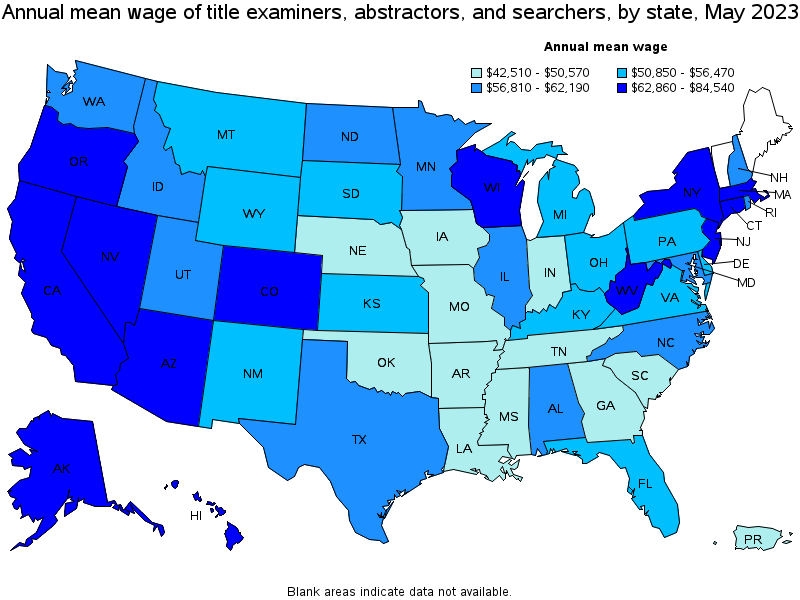
Top paying states for Title Examiners, Abstractors, and Searchers:
| State | Employment (1) | Employment per thousand jobs | Location quotient (9) | Hourly mean wage | Annual mean wage (2) |
|---|---|---|---|---|---|
| California | 4,270 | 0.24 | 0.73 | $ 40.64 | $ 84,540 |
| Hawaii | 160 | 0.25 | 0.77 | $ 38.70 | $ 80,490 |
| Oregon | 560 | 0.29 | 0.87 | $ 37.65 | $ 78,310 |
| New York | 2,230 | 0.24 | 0.72 | $ 37.12 | $ 77,210 |
| Colorado | 1,640 | 0.58 | 1.76 | $ 34.89 | $ 72,560 |
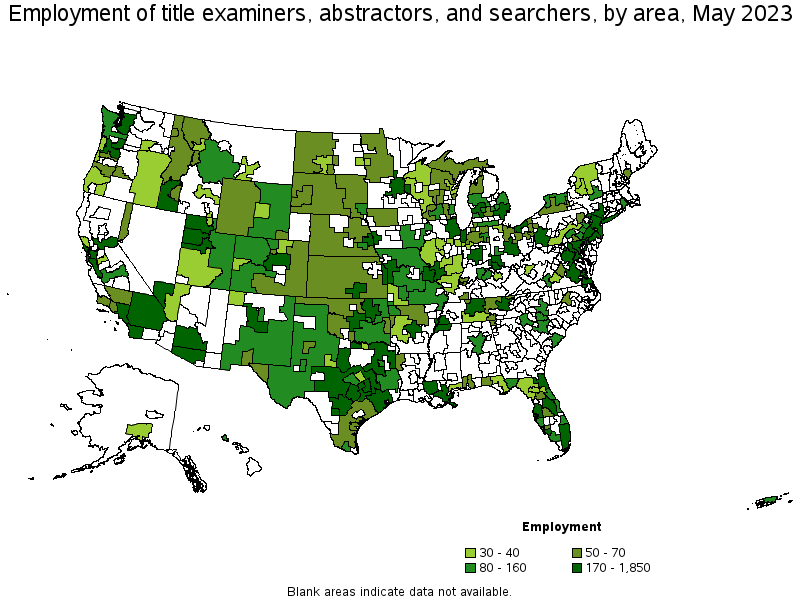
Metropolitan areas with the highest employment level in Title Examiners, Abstractors, and Searchers:
| Metropolitan area | Employment (1) | Employment per thousand jobs | Location quotient (9) | Hourly mean wage | Annual mean wage (2) |
|---|---|---|---|---|---|
| New York-Newark-Jersey City, NY-NJ-PA | 1,850 | 0.19 | 0.59 | $ 39.14 | $ 81,410 |
| Los Angeles-Long Beach-Anaheim, CA | 1,580 | 0.26 | 0.78 | $ 37.82 | $ 78,660 |
| Phoenix-Mesa-Scottsdale, AZ | 1,480 | 0.65 | 1.98 | $ 31.32 | $ 65,150 |
| Houston-The Woodlands-Sugar Land, TX | 1,430 | 0.45 | 1.37 | $ 32.46 | $ 67,510 |
| Miami-Fort Lauderdale-West Palm Beach, FL | 1,160 | 0.43 | 1.31 | $ 27.82 | $ 57,870 |
| Philadelphia-Camden-Wilmington, PA-NJ-DE-MD | 1,140 | 0.40 | 1.23 | $ 25.04 | $ 52,090 |
| Washington-Arlington-Alexandria, DC-VA-MD-WV | 1,120 | 0.36 | 1.10 | $ 28.68 | $ 59,660 |
| Detroit-Warren-Dearborn, MI | 1,050 | 0.55 | 1.69 | $ 25.36 | $ 52,750 |
| Denver-Aurora-Lakewood, CO | 980 | 0.62 | 1.88 | $ 34.95 | $ 72,700 |
| Tampa-St. Petersburg-Clearwater, FL | 910 | 0.64 | 1.96 | $ 26.98 | $ 56,120 |
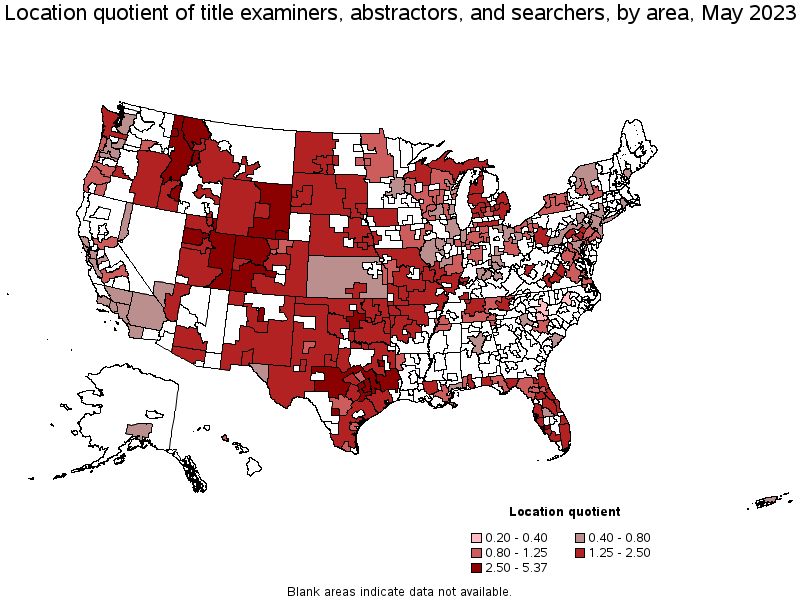
Metropolitan areas with the highest concentration of jobs and location quotients in Title Examiners, Abstractors, and Searchers:
| Metropolitan area | Employment (1) | Employment per thousand jobs | Location quotient (9) | Hourly mean wage | Annual mean wage (2) |
|---|---|---|---|---|---|
| College Station-Bryan, TX | 230 | 1.76 | 5.37 | $ 20.51 | $ 42,670 |
| Cheyenne, WY | 70 | 1.52 | 4.64 | $ 26.98 | $ 56,110 |
| Santa Fe, NM | 80 | 1.27 | 3.89 | $ 27.33 | $ 56,850 |
| Coeur d'Alene, ID | 70 | 1.06 | 3.24 | $ 26.59 | $ 55,300 |
| Tyler, TX | 110 | 0.99 | 3.03 | $ 26.00 | $ 54,090 |
| Salt Lake City, UT | 780 | 0.97 | 2.96 | $ 29.67 | $ 61,710 |
| Punta Gorda, FL | 50 | 0.86 | 2.62 | $ 26.45 | $ 55,020 |
| Oklahoma City, OK | 550 | 0.84 | 2.56 | $ 23.31 | $ 48,490 |
| Casper, WY | 30 | 0.80 | 2.44 | $ 25.62 | $ 53,280 |
| Midland, TX | 90 | 0.79 | 2.41 | $ 40.30 | $ 83,820 |
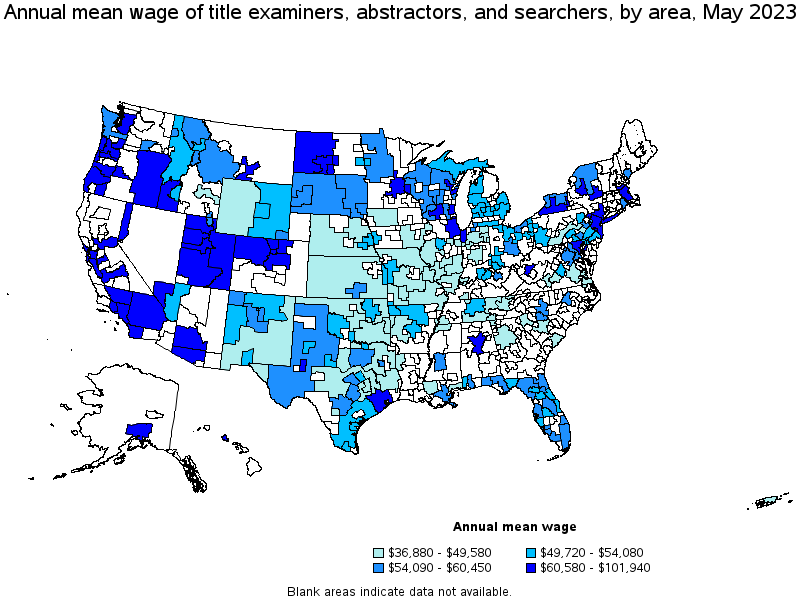
Top paying metropolitan areas for Title Examiners, Abstractors, and Searchers:
| Metropolitan area | Employment (1) | Employment per thousand jobs | Location quotient (9) | Hourly mean wage | Annual mean wage (2) |
|---|---|---|---|---|---|
| San Jose-Sunnyvale-Santa Clara, CA | 200 | 0.18 | 0.54 | $ 49.01 | $ 101,940 |
| San Francisco-Oakland-Hayward, CA | 580 | 0.24 | 0.73 | $ 46.14 | $ 95,980 |
| Modesto, CA | 30 | 0.16 | 0.48 | $ 43.58 | $ 90,640 |
| San Diego-Carlsbad, CA | 310 | 0.21 | 0.63 | $ 41.05 | $ 85,390 |
| Greeley, CO | 40 | 0.40 | 1.21 | $ 40.71 | $ 84,680 |
| Sacramento--Roseville--Arden-Arcade, CA | 420 | 0.40 | 1.22 | $ 40.65 | $ 84,550 |
| Bakersfield, CA | 60 | 0.18 | 0.55 | $ 40.57 | $ 84,390 |
| Midland, TX | 90 | 0.79 | 2.41 | $ 40.30 | $ 83,820 |
| Fresno, CA | 110 | 0.27 | 0.81 | $ 39.78 | $ 82,740 |
| Riverside-San Bernardino-Ontario, CA | 280 | 0.17 | 0.51 | $ 39.40 | $ 81,950 |
Nonmetropolitan areas with the highest employment in Title Examiners, Abstractors, and Searchers:
| Nonmetropolitan area | Employment (1) | Employment per thousand jobs | Location quotient (9) | Hourly mean wage | Annual mean wage (2) |
|---|---|---|---|---|---|
| North Texas Region of Texas nonmetropolitan area | 200 | 0.70 | 2.14 | $ 23.44 | $ 48,760 |
| Hill Country Region of Texas nonmetropolitan area | 170 | 0.86 | 2.64 | $ 22.90 | $ 47,630 |
| Eastern Wyoming nonmetropolitan area | 140 | 1.66 | 5.06 | $ 24.45 | $ 50,860 |
| Big Thicket Region of Texas nonmetropolitan area | 130 | 1.21 | 3.70 | $ 23.49 | $ 48,860 |
| Eastern Utah nonmetropolitan area | 130 | 1.46 | 4.45 | $ 29.12 | $ 60,580 |
Nonmetropolitan areas with the highest concentration of jobs and location quotients in Title Examiners, Abstractors, and Searchers:
| Nonmetropolitan area | Employment (1) | Employment per thousand jobs | Location quotient (9) | Hourly mean wage | Annual mean wage (2) |
|---|---|---|---|---|---|
| Eastern Wyoming nonmetropolitan area | 140 | 1.66 | 5.06 | $ 24.45 | $ 50,860 |
| Eastern Utah nonmetropolitan area | 130 | 1.46 | 4.45 | $ 29.12 | $ 60,580 |
| Big Thicket Region of Texas nonmetropolitan area | 130 | 1.21 | 3.70 | $ 23.49 | $ 48,860 |
| Southwest Colorado nonmetropolitan area | 100 | 0.96 | 2.94 | (8) | (8) |
| Northwest Colorado nonmetropolitan area | 120 | 0.95 | 2.89 | $ 36.15 | $ 75,190 |
Top paying nonmetropolitan areas for Title Examiners, Abstractors, and Searchers:
| Nonmetropolitan area | Employment (1) | Employment per thousand jobs | Location quotient (9) | Hourly mean wage | Annual mean wage (2) |
|---|---|---|---|---|---|
| Eastern Oregon nonmetropolitan area | 30 | 0.43 | 1.31 | $ 38.11 | $ 79,270 |
| Coast Oregon nonmetropolitan area | 30 | 0.30 | 0.91 | $ 36.92 | $ 76,790 |
| Northwest Colorado nonmetropolitan area | 120 | 0.95 | 2.89 | $ 36.15 | $ 75,190 |
| West North Dakota nonmetropolitan area | 70 | 0.57 | 1.74 | $ 31.70 | $ 65,930 |
| Southwest New York nonmetropolitan area | 50 | 0.29 | 0.89 | $ 31.05 | $ 64,590 |
These estimates are calculated with data collected from employers in all industry sectors, all metropolitan and nonmetropolitan areas, and all states and the District of Columbia. The top employment and wage figures are provided above. The complete list is available in the downloadable XLS files.
The percentile wage estimate is the value of a wage below which a certain percent of workers fall. The median wage is the 50th percentile wage estimate—50 percent of workers earn less than the median and 50 percent of workers earn more than the median. More about percentile wages.
(1) Estimates for detailed occupations do not sum to the totals because the totals include occupations not shown separately. Estimates do not include self-employed workers.
(2) Annual wages have been calculated by multiplying the hourly mean wage by a "year-round, full-time" hours figure of 2,080 hours; for those occupations where there is not an hourly wage published, the annual wage has been directly calculated from the reported survey data.
(3) The relative standard error (RSE) is a measure of the reliability of a survey statistic. The smaller the relative standard error, the more precise the estimate.
(8) Estimate not released.
(9) The location quotient is the ratio of the area concentration of occupational employment to the national average concentration. A location quotient greater than one indicates the occupation has a higher share of employment than average, and a location quotient less than one indicates the occupation is less prevalent in the area than average.
Other OEWS estimates and related information:
May 2023 National Occupational Employment and Wage Estimates
May 2023 State Occupational Employment and Wage Estimates
May 2023 Metropolitan and Nonmetropolitan Area Occupational Employment and Wage Estimates
May 2023 National Industry-Specific Occupational Employment and Wage Estimates
Last Modified Date: April 3, 2024