
An official website of the United States government
An official website of the United States government
The .gov means it's official.
Federal government websites often end in .gov or .mil. Before sharing sensitive information,
make sure you're on a federal government site.
The site is secure.
The
https:// ensures that you are connecting to the official website and that any
information you provide is encrypted and transmitted securely.
Care for individuals with mental or emotional conditions or disabilities, following the instructions of physicians or other health practitioners. Monitor patients� physical and emotional well-being and report to medical staff. May participate in rehabilitation and treatment programs, help with personal hygiene, and administer oral or injectable medications.
Employment estimate and mean wage estimates for Psychiatric Technicians:
| Employment (1) | Employment RSE (3) |
Mean hourly wage |
Mean annual wage (2) |
Wage RSE (3) |
|---|---|---|---|---|
| 115,940 | 2.0 % | $ 20.99 | $ 43,650 | 0.5 % |
Percentile wage estimates for Psychiatric Technicians:
| Percentile | 10% | 25% | 50% (Median) |
75% | 90% |
|---|---|---|---|---|---|
| Hourly Wage | $ 14.98 | $ 17.18 | $ 19.09 | $ 23.06 | $ 28.84 |
| Annual Wage (2) | $ 31,150 | $ 35,730 | $ 39,700 | $ 47,960 | $ 59,990 |
Industries with the highest published employment and wages for Psychiatric Technicians are provided. For a list of all industries with employment in Psychiatric Technicians, see the Create Customized Tables function.
Industries with the highest levels of employment in Psychiatric Technicians:
| Industry | Employment (1) | Percent of industry employment | Hourly mean wage | Annual mean wage (2) |
|---|---|---|---|---|
| Psychiatric and Substance Abuse Hospitals | 28,950 | 12.34 | $ 21.21 | $ 44,110 |
| Offices of Other Health Practitioners | 21,990 | 1.93 | $ 20.92 | $ 43,510 |
| General Medical and Surgical Hospitals | 15,920 | 0.28 | $ 21.40 | $ 44,510 |
| Residential Intellectual and Developmental Disability, Mental Health, and Substance Abuse Facilities | 12,430 | 2.00 | $ 17.70 | $ 36,810 |
| Outpatient Care Centers | 10,030 | 0.94 | $ 19.59 | $ 40,740 |
Industries with the highest concentration of employment in Psychiatric Technicians:
| Industry | Employment (1) | Percent of industry employment | Hourly mean wage | Annual mean wage (2) |
|---|---|---|---|---|
| Psychiatric and Substance Abuse Hospitals | 28,950 | 12.34 | $ 21.21 | $ 44,110 |
| Residential Intellectual and Developmental Disability, Mental Health, and Substance Abuse Facilities | 12,430 | 2.00 | $ 17.70 | $ 36,810 |
| Offices of Other Health Practitioners | 21,990 | 1.93 | $ 20.92 | $ 43,510 |
| Outpatient Care Centers | 10,030 | 0.94 | $ 19.59 | $ 40,740 |
| Other Residential Care Facilities | 1,000 | 0.65 | $ 18.22 | $ 37,890 |
Top paying industries for Psychiatric Technicians:
| Industry | Employment (1) | Percent of industry employment | Hourly mean wage | Annual mean wage (2) |
|---|---|---|---|---|
| State Government, excluding Schools and Hospitals (OEWS Designation) | 5,570 | 0.26 | $ 28.34 | $ 58,950 |
| Offices of Physicians | 1,240 | 0.04 | $ 23.58 | $ 49,040 |
| Educational Support Services | (8) | (8) | $ 22.91 | $ 47,640 |
| Employment Services | 1,690 | 0.05 | $ 22.41 | $ 46,600 |
| Home Health Care Services | 300 | 0.02 | $ 21.90 | $ 45,550 |
States and areas with the highest published employment, location quotients, and wages for Psychiatric Technicians are provided. For a list of all areas with employment in Psychiatric Technicians, see the Create Customized Tables function.
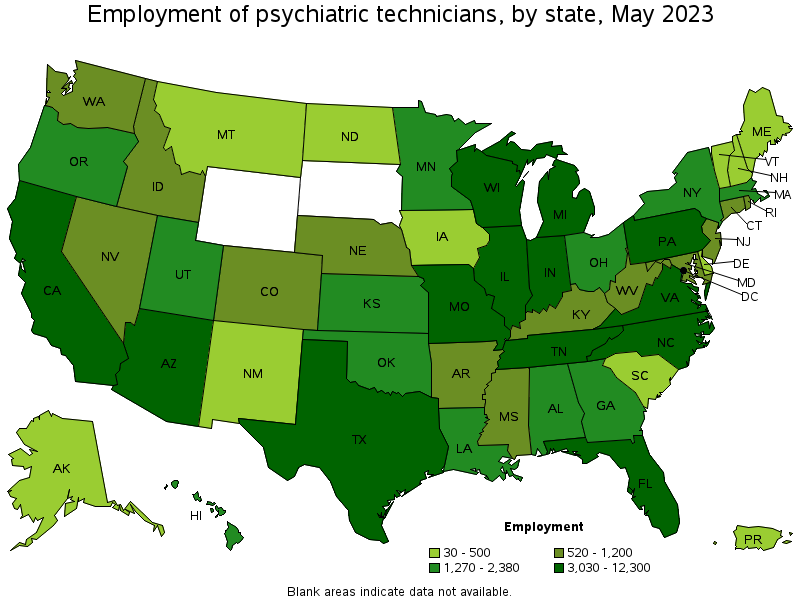
States with the highest employment level in Psychiatric Technicians:
| State | Employment (1) | Employment per thousand jobs | Location quotient (9) | Hourly mean wage | Annual mean wage (2) |
|---|---|---|---|---|---|
| Florida | 12,300 | 1.29 | 1.68 | $ 20.09 | $ 41,790 |
| Texas | 9,820 | 0.72 | 0.95 | $ 18.41 | $ 38,290 |
| California | 9,650 | 0.54 | 0.70 | $ 31.16 | $ 64,820 |
| Arizona | 6,940 | 2.22 | 2.90 | $ 20.07 | $ 41,740 |
| Pennsylvania | 5,880 | 0.99 | 1.29 | $ 19.91 | $ 41,420 |
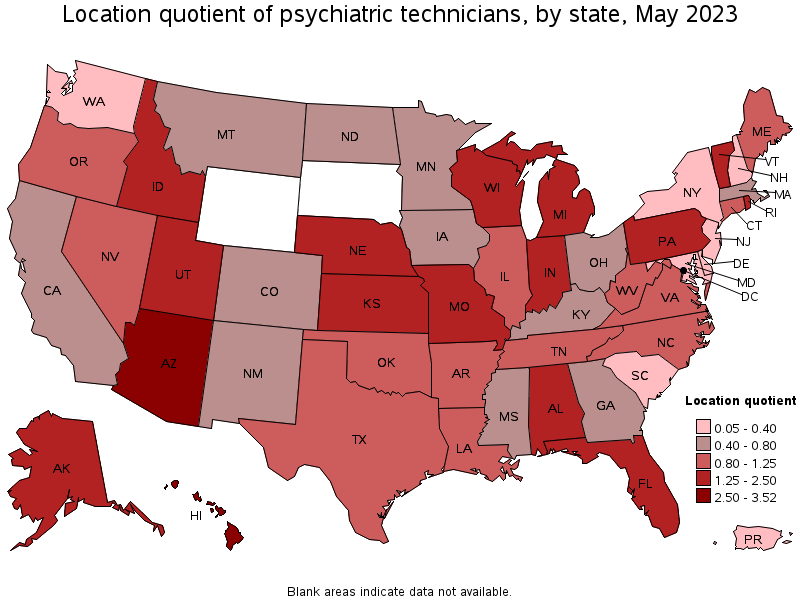
States with the highest concentration of jobs and location quotients in Psychiatric Technicians:
| State | Employment (1) | Employment per thousand jobs | Location quotient (9) | Hourly mean wage | Annual mean wage (2) |
|---|---|---|---|---|---|
| Hawaii | 1,660 | 2.69 | 3.52 | $ 23.95 | $ 49,810 |
| Arizona | 6,940 | 2.22 | 2.90 | $ 20.07 | $ 41,740 |
| Indiana | 5,400 | 1.71 | 2.24 | $ 19.42 | $ 40,390 |
| Vermont | 460 | 1.52 | 1.99 | $ 22.19 | $ 46,160 |
| Idaho | 1,200 | 1.46 | 1.91 | $ 19.91 | $ 41,400 |
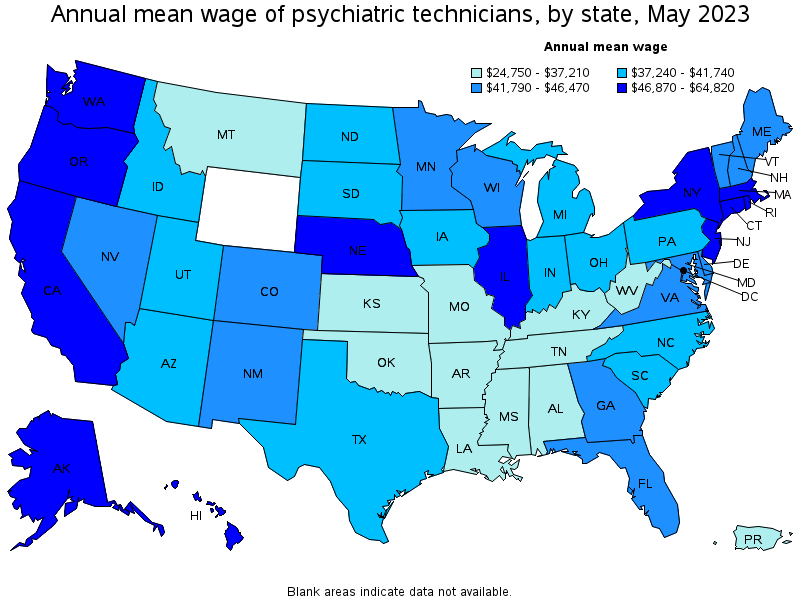
Top paying states for Psychiatric Technicians:
| State | Employment (1) | Employment per thousand jobs | Location quotient (9) | Hourly mean wage | Annual mean wage (2) |
|---|---|---|---|---|---|
| California | 9,650 | 0.54 | 0.70 | $ 31.16 | $ 64,820 |
| District of Columbia | 460 | 0.65 | 0.86 | $ 27.97 | $ 58,180 |
| Connecticut | 1,130 | 0.68 | 0.89 | $ 26.76 | $ 55,670 |
| New Jersey | 1,060 | 0.25 | 0.33 | $ 26.23 | $ 54,550 |
| New York | 2,380 | 0.25 | 0.33 | $ 25.99 | $ 54,060 |
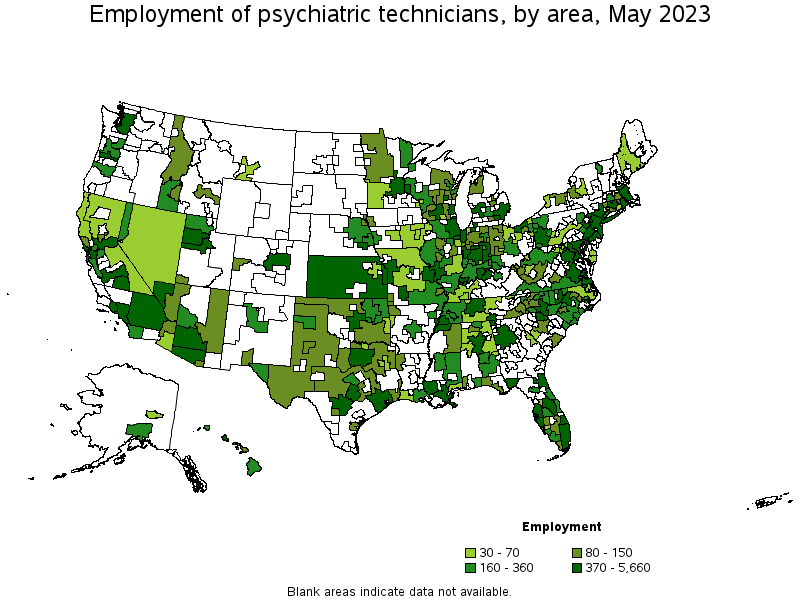
Metropolitan areas with the highest employment level in Psychiatric Technicians:
| Metropolitan area | Employment (1) | Employment per thousand jobs | Location quotient (9) | Hourly mean wage | Annual mean wage (2) |
|---|---|---|---|---|---|
| Phoenix-Mesa-Scottsdale, AZ | 5,660 | 2.47 | 3.24 | $ 20.41 | $ 42,450 |
| Miami-Fort Lauderdale-West Palm Beach, FL | 3,990 | 1.46 | 1.92 | $ 20.25 | $ 42,120 |
| Chicago-Naperville-Elgin, IL-IN-WI | 3,730 | 0.83 | 1.08 | $ 22.48 | $ 46,760 |
| Houston-The Woodlands-Sugar Land, TX | 2,900 | 0.91 | 1.19 | $ 19.00 | $ 39,520 |
| Los Angeles-Long Beach-Anaheim, CA | 2,690 | 0.43 | 0.57 | $ 27.30 | $ 56,780 |
| New York-Newark-Jersey City, NY-NJ-PA | 2,600 | 0.27 | 0.36 | $ 26.85 | $ 55,850 |
| Philadelphia-Camden-Wilmington, PA-NJ-DE-MD | 2,470 | 0.87 | 1.14 | $ 21.32 | $ 44,340 |
| Dallas-Fort Worth-Arlington, TX | 2,350 | 0.59 | 0.78 | $ 19.65 | $ 40,870 |
| Detroit-Warren-Dearborn, MI | 2,000 | 1.05 | 1.38 | $ 19.09 | $ 39,700 |
| Indianapolis-Carmel-Anderson, IN | 1,970 | 1.82 | 2.38 | $ 21.33 | $ 44,370 |
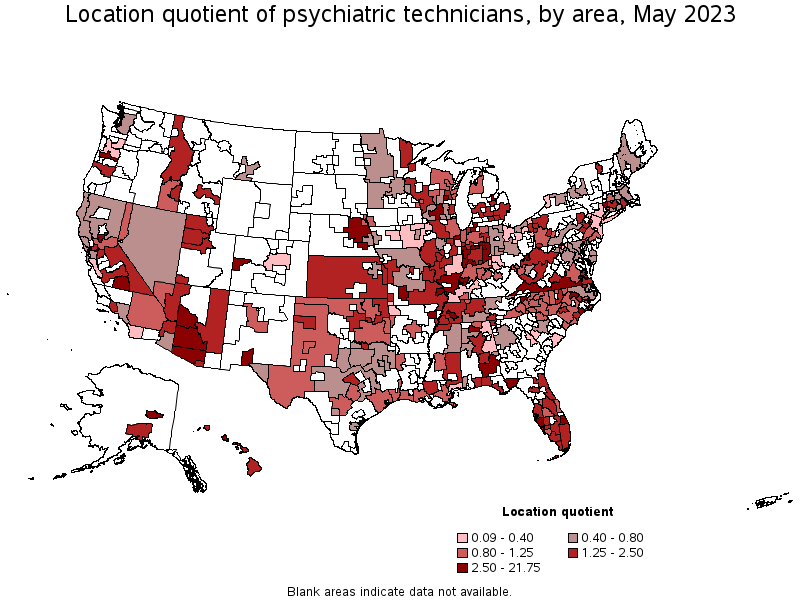
Metropolitan areas with the highest concentration of jobs and location quotients in Psychiatric Technicians:
| Metropolitan area | Employment (1) | Employment per thousand jobs | Location quotient (9) | Hourly mean wage | Annual mean wage (2) |
|---|---|---|---|---|---|
| Kankakee, IL | 690 | 16.60 | 21.75 | $ 24.23 | $ 50,400 |
| Springfield, MO | 1,260 | 5.79 | 7.58 | $ 16.64 | $ 34,620 |
| Oshkosh-Neenah, WI | 470 | 5.03 | 6.58 | $ 25.21 | $ 52,440 |
| Jacksonville, NC | 250 | 4.82 | 6.32 | $ 15.23 | $ 31,680 |
| Visalia-Porterville, CA | 760 | 4.52 | 5.92 | $ 33.91 | $ 70,540 |
| Salem, OR | 640 | 3.50 | 4.59 | $ 26.55 | $ 55,230 |
| Bay City, MI | 120 | 3.47 | 4.54 | $ 19.01 | $ 39,530 |
| Evansville, IN-KY | 520 | 3.40 | 4.46 | $ 17.03 | $ 35,410 |
| South Bend-Mishawaka, IN-MI | 430 | 3.34 | 4.37 | $ 18.42 | $ 38,320 |
| Jonesboro, AR | 190 | 3.28 | 4.29 | $ 16.47 | $ 34,260 |
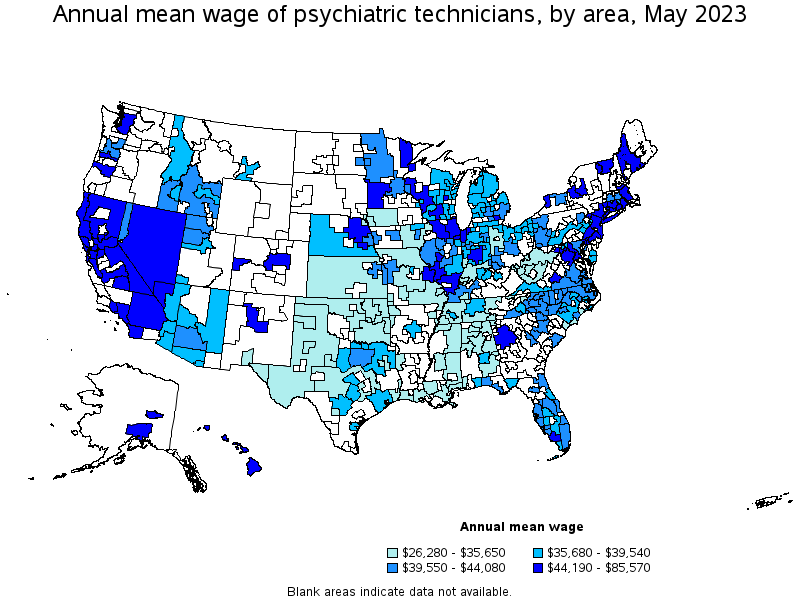
Top paying metropolitan areas for Psychiatric Technicians:
| Metropolitan area | Employment (1) | Employment per thousand jobs | Location quotient (9) | Hourly mean wage | Annual mean wage (2) |
|---|---|---|---|---|---|
| Stockton-Lodi, CA | 340 | 1.21 | 1.59 | $ 41.14 | $ 85,570 |
| Oxnard-Thousand Oaks-Ventura, CA | 420 | 1.32 | 1.73 | $ 38.53 | $ 80,140 |
| Vallejo-Fairfield, CA | 190 | 1.35 | 1.76 | $ 35.12 | $ 73,040 |
| Utica-Rome, NY | 40 | 0.32 | 0.42 | $ 34.66 | $ 72,100 |
| Visalia-Porterville, CA | 760 | 4.52 | 5.92 | $ 33.91 | $ 70,540 |
| San Francisco-Oakland-Hayward, CA | 730 | 0.30 | 0.40 | $ 33.08 | $ 68,800 |
| Santa Rosa, CA | 90 | 0.46 | 0.60 | $ 32.88 | $ 68,390 |
| San Jose-Sunnyvale-Santa Clara, CA | 200 | 0.17 | 0.23 | $ 31.32 | $ 65,150 |
| Fresno, CA | 420 | 1.02 | 1.33 | $ 31.03 | $ 64,540 |
| Riverside-San Bernardino-Ontario, CA | 1,190 | 0.71 | 0.93 | $ 30.53 | $ 63,490 |
Nonmetropolitan areas with the highest employment in Psychiatric Technicians:
| Nonmetropolitan area | Employment (1) | Employment per thousand jobs | Location quotient (9) | Hourly mean wage | Annual mean wage (2) |
|---|---|---|---|---|---|
| Kansas nonmetropolitan area | 520 | 1.35 | 1.76 | $ 16.44 | $ 34,190 |
| Central Indiana nonmetropolitan area | 460 | 2.93 | 3.84 | $ 17.29 | $ 35,970 |
| South Illinois nonmetropolitan area | 330 | 3.83 | 5.01 | $ 21.31 | $ 44,320 |
| Southside Virginia nonmetropolitan area | 310 | 3.01 | 3.94 | $ 19.17 | $ 39,880 |
| West Tennessee nonmetropolitan area | 250 | 1.88 | 2.46 | $ 14.22 | $ 29,570 |
Nonmetropolitan areas with the highest concentration of jobs and location quotients in Psychiatric Technicians:
| Nonmetropolitan area | Employment (1) | Employment per thousand jobs | Location quotient (9) | Hourly mean wage | Annual mean wage (2) |
|---|---|---|---|---|---|
| South Illinois nonmetropolitan area | 330 | 3.83 | 5.01 | $ 21.31 | $ 44,320 |
| Southside Virginia nonmetropolitan area | 310 | 3.01 | 3.94 | $ 19.17 | $ 39,880 |
| Central Indiana nonmetropolitan area | 460 | 2.93 | 3.84 | $ 17.29 | $ 35,970 |
| Northeast Nebraska nonmetropolitan area | 230 | 2.48 | 3.25 | $ 22.18 | $ 46,130 |
| Connecticut nonmetropolitan area | 80 | 2.40 | 3.14 | $ 25.51 | $ 53,060 |
Top paying nonmetropolitan areas for Psychiatric Technicians:
| Nonmetropolitan area | Employment (1) | Employment per thousand jobs | Location quotient (9) | Hourly mean wage | Annual mean wage (2) |
|---|---|---|---|---|---|
| Eastern Sierra-Mother Lode Region of California nonmetropolitan area | 70 | 1.17 | 1.54 | $ 37.26 | $ 77,510 |
| North Coast Region of California nonmetropolitan area | 40 | 0.42 | 0.55 | $ 32.37 | $ 67,330 |
| North Valley-Northern Mountains Region of California nonmetropolitan area | 50 | 0.45 | 0.59 | $ 29.59 | $ 61,550 |
| Western Wisconsin nonmetropolitan area | 230 | 1.66 | 2.17 | $ 26.23 | $ 54,570 |
| Connecticut nonmetropolitan area | 80 | 2.40 | 3.14 | $ 25.51 | $ 53,060 |
These estimates are calculated with data collected from employers in all industry sectors, all metropolitan and nonmetropolitan areas, and all states and the District of Columbia. The top employment and wage figures are provided above. The complete list is available in the downloadable XLS files.
The percentile wage estimate is the value of a wage below which a certain percent of workers fall. The median wage is the 50th percentile wage estimate—50 percent of workers earn less than the median and 50 percent of workers earn more than the median. More about percentile wages.
(1) Estimates for detailed occupations do not sum to the totals because the totals include occupations not shown separately. Estimates do not include self-employed workers.
(2) Annual wages have been calculated by multiplying the hourly mean wage by a "year-round, full-time" hours figure of 2,080 hours; for those occupations where there is not an hourly wage published, the annual wage has been directly calculated from the reported survey data.
(3) The relative standard error (RSE) is a measure of the reliability of a survey statistic. The smaller the relative standard error, the more precise the estimate.
(8) Estimate not released.
(9) The location quotient is the ratio of the area concentration of occupational employment to the national average concentration. A location quotient greater than one indicates the occupation has a higher share of employment than average, and a location quotient less than one indicates the occupation is less prevalent in the area than average.
Other OEWS estimates and related information:
May 2023 National Occupational Employment and Wage Estimates
May 2023 State Occupational Employment and Wage Estimates
May 2023 Metropolitan and Nonmetropolitan Area Occupational Employment and Wage Estimates
May 2023 National Industry-Specific Occupational Employment and Wage Estimates
Last Modified Date: April 3, 2024