
An official website of the United States government
An official website of the United States government
The .gov means it's official.
Federal government websites often end in .gov or .mil. Before sharing sensitive information,
make sure you're on a federal government site.
The site is secure.
The
https:// ensures that you are connecting to the official website and that any
information you provide is encrypted and transmitted securely.
Evaluate and treat musculoskeletal injuries or illnesses. Provide preventive, therapeutic, emergency, and rehabilitative care. Excludes �Physical Therapists� (29-1123).
Employment estimate and mean wage estimates for Athletic Trainers:
| Employment (1) | Employment RSE (3) |
Mean hourly wage |
Mean annual wage (2) |
Mean wage RSE (3) |
|---|---|---|---|---|
| 28,480 | 2.1 % | (4) | $ 61,540 | 0.5 % |
Percentile wage estimates for Athletic Trainers:
| Percentile | 10% | 25% | 50% (Median) |
75% | 90% |
|---|---|---|---|---|---|
| Annual Wage (2) | $ 43,180 | $ 49,750 | $ 57,930 | $ 66,580 | $ 80,640 |
Industries with the highest published employment and wages for Athletic Trainers are provided. For a list of all industries with employment in Athletic Trainers, see the Create Customized Tables function.
Industries with the highest levels of employment in Athletic Trainers:
| Industry | Employment (1) | Percent of industry employment | Hourly mean wage | Annual mean wage (2) |
|---|---|---|---|---|
| Colleges, Universities, and Professional Schools | 6,590 | 0.21 | (4) | $ 58,820 |
| Offices of Physicians | 4,750 | 0.17 | (4) | $ 58,750 |
| General Medical and Surgical Hospitals | 4,430 | 0.08 | (4) | $ 58,850 |
| Elementary and Secondary Schools | 4,200 | 0.05 | (4) | $ 70,470 |
| Offices of Other Health Practitioners | 3,540 | 0.31 | (4) | $ 55,220 |
Industries with the highest concentration of employment in Athletic Trainers:
| Industry | Employment (1) | Percent of industry employment | Hourly mean wage | Annual mean wage (2) |
|---|---|---|---|---|
| Spectator Sports | 1,450 | 0.96 | (4) | $ 87,190 |
| Specialty (except Psychiatric and Substance Abuse) Hospitals | 990 | 0.35 | (4) | $ 56,410 |
| Offices of Other Health Practitioners | 3,540 | 0.31 | (4) | $ 55,220 |
| Colleges, Universities, and Professional Schools | 6,590 | 0.21 | (4) | $ 58,820 |
| Offices of Physicians | 4,750 | 0.17 | (4) | $ 58,750 |
Top paying industries for Athletic Trainers:
| Industry | Employment (1) | Percent of industry employment | Hourly mean wage | Annual mean wage (2) |
|---|---|---|---|---|
| Civic and Social Organizations | 30 | 0.01 | (4) | $ 98,820 |
| Spectator Sports | 1,450 | 0.96 | (4) | $ 87,190 |
| Promoters of Performing Arts, Sports, and Similar Events | 30 | 0.02 | (4) | $ 83,220 |
| Elementary and Secondary Schools | 4,200 | 0.05 | (4) | $ 70,470 |
| Junior Colleges | 500 | 0.08 | (4) | $ 67,500 |
States and areas with the highest published employment, location quotients, and wages for Athletic Trainers are provided. For a list of all areas with employment in Athletic Trainers, see the Create Customized Tables function.
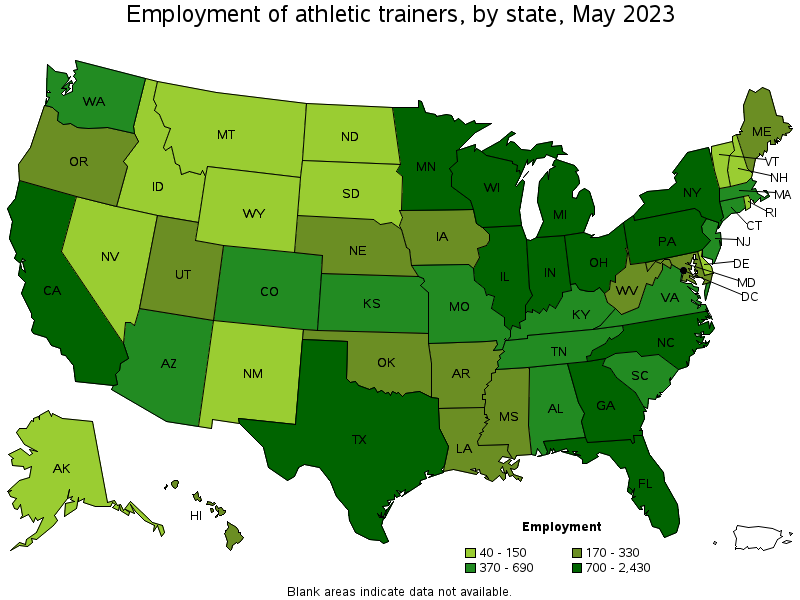
States with the highest employment level in Athletic Trainers:
| State | Employment (1) | Employment per thousand jobs | Location quotient (9) | Hourly mean wage | Annual mean wage (2) |
|---|---|---|---|---|---|
| Texas | 2,430 | 0.18 | 0.96 | (4) | $ 64,040 |
| Pennsylvania | 2,310 | 0.39 | 2.07 | (4) | $ 56,780 |
| California | 1,760 | 0.10 | 0.52 | (4) | $ 72,840 |
| Ohio | 1,750 | 0.32 | 1.71 | (4) | $ 58,550 |
| Florida | 1,410 | 0.15 | 0.78 | (4) | $ 56,480 |
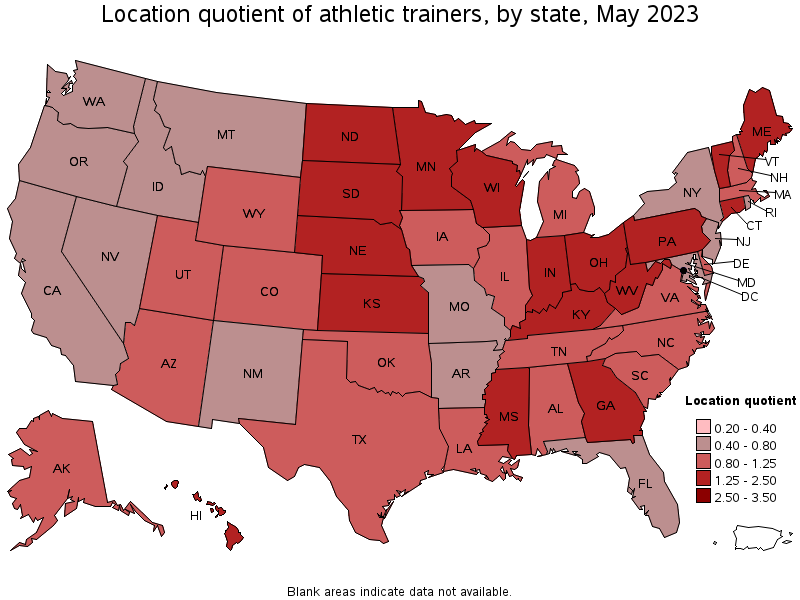
States with the highest concentration of jobs and location quotients in Athletic Trainers:
| State | Employment (1) | Employment per thousand jobs | Location quotient (9) | Hourly mean wage | Annual mean wage (2) |
|---|---|---|---|---|---|
| Minnesota | 1,310 | 0.45 | 2.42 | (4) | $ 62,050 |
| Vermont | 130 | 0.44 | 2.37 | (4) | $ 59,960 |
| Pennsylvania | 2,310 | 0.39 | 2.07 | (4) | $ 56,780 |
| South Dakota | 150 | 0.34 | 1.81 | (4) | $ 52,720 |
| Ohio | 1,750 | 0.32 | 1.71 | (4) | $ 58,550 |
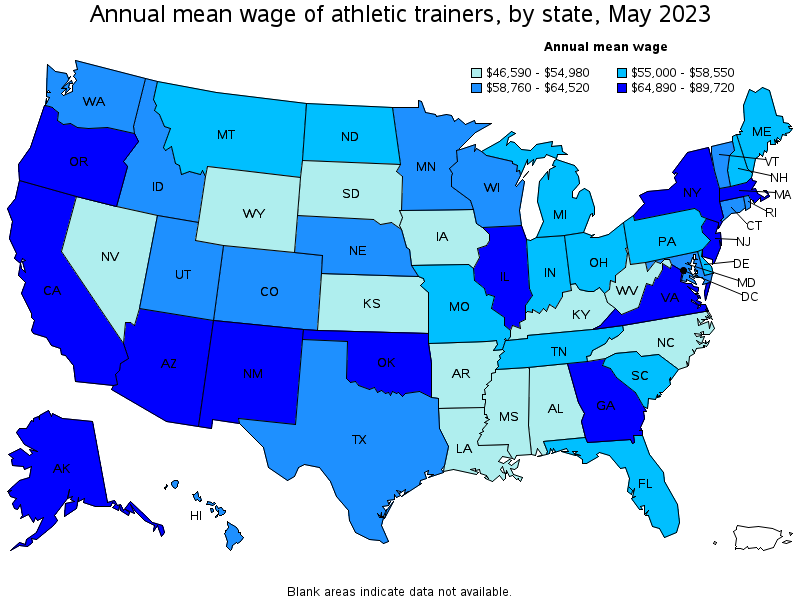
Top paying states for Athletic Trainers:
| State | Employment (1) | Employment per thousand jobs | Location quotient (9) | Hourly mean wage | Annual mean wage (2) |
|---|---|---|---|---|---|
| District of Columbia | 120 | 0.17 | 0.91 | (4) | $ 89,720 |
| New Jersey | 600 | 0.14 | 0.76 | (4) | $ 77,540 |
| California | 1,760 | 0.10 | 0.52 | (4) | $ 72,840 |
| Illinois | 1,000 | 0.17 | 0.88 | (4) | $ 72,320 |
| New York | 960 | 0.10 | 0.54 | (4) | $ 71,410 |
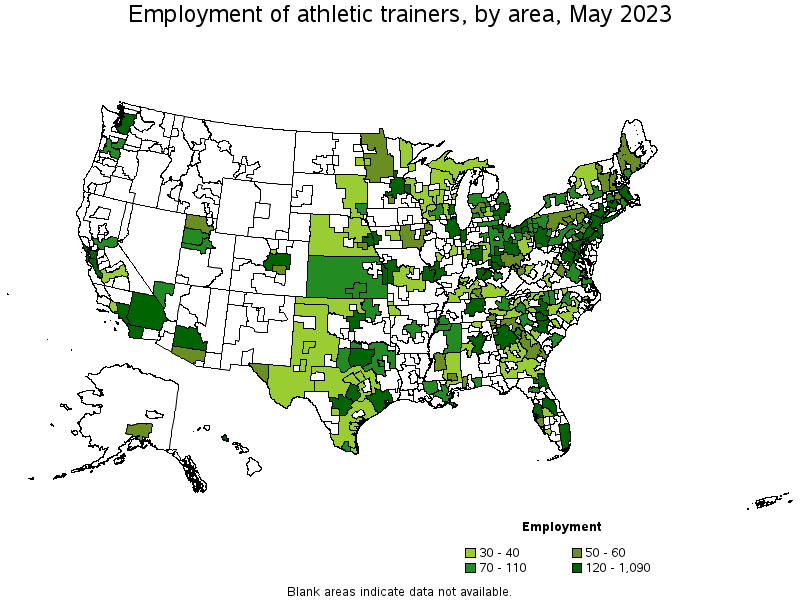
Metropolitan areas with the highest employment level in Athletic Trainers:
| Metropolitan area | Employment (1) | Employment per thousand jobs | Location quotient (9) | Hourly mean wage | Annual mean wage (2) |
|---|---|---|---|---|---|
| Philadelphia-Camden-Wilmington, PA-NJ-DE-MD | 1,090 | 0.38 | 2.05 | (4) | $ 62,260 |
| New York-Newark-Jersey City, NY-NJ-PA | 870 | 0.09 | 0.49 | (4) | $ 78,590 |
| Chicago-Naperville-Elgin, IL-IN-WI | 830 | 0.18 | 0.98 | (4) | $ 74,210 |
| Atlanta-Sandy Springs-Roswell, GA | 790 | 0.28 | 1.50 | (4) | $ 67,680 |
| Dallas-Fort Worth-Arlington, TX | 750 | 0.19 | 1.01 | (4) | $ 65,590 |
| Los Angeles-Long Beach-Anaheim, CA | 670 | 0.11 | 0.58 | (4) | $ 72,220 |
| Minneapolis-St. Paul-Bloomington, MN-WI | 660 | 0.35 | 1.85 | (4) | $ 63,120 |
| Phoenix-Mesa-Scottsdale, AZ | 570 | 0.25 | 1.32 | (4) | $ 66,500 |
| Houston-The Woodlands-Sugar Land, TX | 500 | 0.16 | 0.85 | (4) | $ 65,850 |
| Boston-Cambridge-Nashua, MA-NH | 420 | 0.15 | 0.80 | (4) | $ 67,810 |
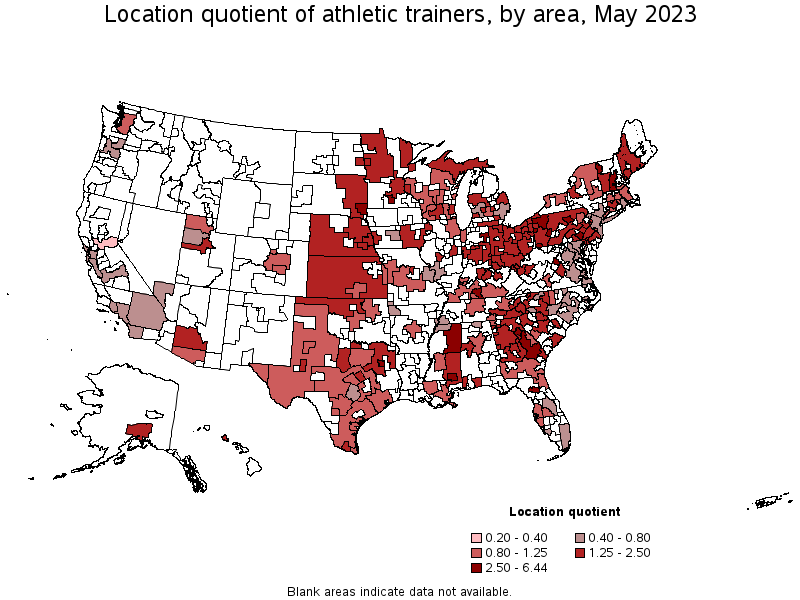
Metropolitan areas with the highest concentration of jobs and location quotients in Athletic Trainers:
| Metropolitan area | Employment (1) | Employment per thousand jobs | Location quotient (9) | Hourly mean wage | Annual mean wage (2) |
|---|---|---|---|---|---|
| Athens-Clarke County, GA | 110 | 1.21 | 6.44 | (4) | $ 62,730 |
| Williamsport, PA | 50 | 0.92 | 4.88 | (4) | $ 56,670 |
| Harrisonburg, VA | 60 | 0.88 | 4.69 | (4) | $ 55,870 |
| Mankato-North Mankato, MN | 50 | 0.86 | 4.58 | (4) | $ 58,180 |
| Hattiesburg, MS | 50 | 0.73 | 3.90 | (4) | $ 52,760 |
| Bowling Green, KY | 50 | 0.68 | 3.61 | (4) | $ 50,870 |
| Lancaster, PA | 160 | 0.64 | 3.41 | (4) | $ 51,980 |
| Tyler, TX | 70 | 0.61 | 3.26 | (4) | $ 54,550 |
| Gainesville, FL | 80 | 0.57 | 3.03 | (4) | $ 57,990 |
| Burlington-South Burlington, VT | 60 | 0.54 | 2.88 | (4) | $ 63,090 |
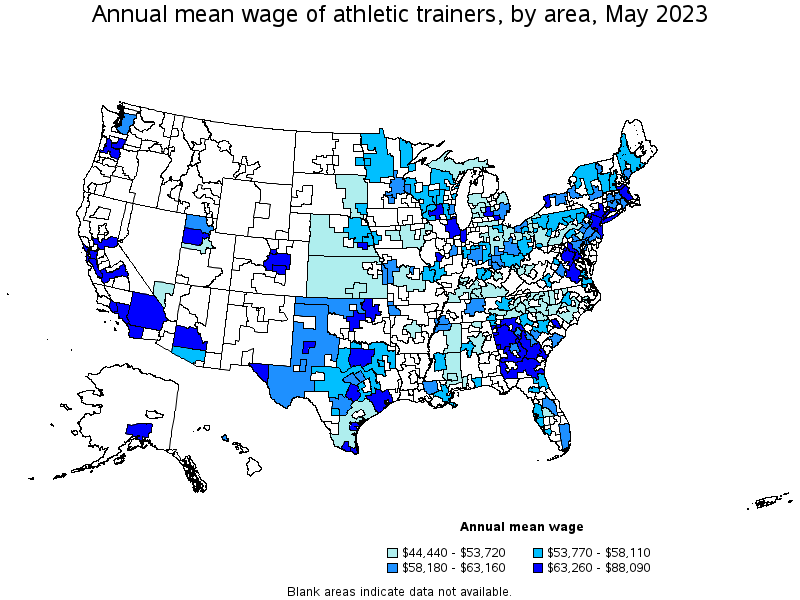
Top paying metropolitan areas for Athletic Trainers:
| Metropolitan area | Employment (1) | Employment per thousand jobs | Location quotient (9) | Hourly mean wage | Annual mean wage (2) |
|---|---|---|---|---|---|
| Buffalo-Cheektowaga-Niagara Falls, NY | 90 | 0.17 | 0.89 | (4) | $ 88,090 |
| San Jose-Sunnyvale-Santa Clara, CA | 140 | 0.13 | 0.67 | (4) | $ 82,400 |
| Washington-Arlington-Alexandria, DC-VA-MD-WV | 410 | 0.13 | 0.71 | (4) | $ 81,210 |
| New York-Newark-Jersey City, NY-NJ-PA | 870 | 0.09 | 0.49 | (4) | $ 78,590 |
| San Francisco-Oakland-Hayward, CA | 240 | 0.10 | 0.53 | (4) | $ 78,240 |
| Ann Arbor, MI | 90 | 0.41 | 2.20 | (4) | $ 77,660 |
| Oklahoma City, OK | 140 | 0.21 | 1.15 | (4) | $ 76,010 |
| Richmond, VA | 90 | 0.13 | 0.71 | (4) | $ 75,030 |
| Trenton, NJ | 40 | 0.16 | 0.88 | (4) | $ 74,980 |
| Chicago-Naperville-Elgin, IL-IN-WI | 830 | 0.18 | 0.98 | (4) | $ 74,210 |
Nonmetropolitan areas with the highest employment in Athletic Trainers:
| Nonmetropolitan area | Employment (1) | Employment per thousand jobs | Location quotient (9) | Hourly mean wage | Annual mean wage (2) |
|---|---|---|---|---|---|
| Kansas nonmetropolitan area | 110 | 0.29 | 1.57 | (4) | $ 53,720 |
| Northeast Mississippi nonmetropolitan area | 110 | 0.49 | 2.59 | (4) | $ 52,980 |
| North Northeastern Ohio nonmetropolitan area (noncontiguous) | 110 | 0.33 | 1.75 | (4) | $ 53,200 |
| Balance of Lower Peninsula of Michigan nonmetropolitan area | 100 | 0.37 | 1.99 | (4) | $ 47,650 |
| North Texas Region of Texas nonmetropolitan area | 90 | 0.32 | 1.70 | (4) | $ 57,190 |
Nonmetropolitan areas with the highest concentration of jobs and location quotients in Athletic Trainers:
| Nonmetropolitan area | Employment (1) | Employment per thousand jobs | Location quotient (9) | Hourly mean wage | Annual mean wage (2) |
|---|---|---|---|---|---|
| East Georgia nonmetropolitan area | 50 | 0.54 | 2.85 | (4) | $ 67,560 |
| Northeast Mississippi nonmetropolitan area | 110 | 0.49 | 2.59 | (4) | $ 52,980 |
| Western Pennsylvania nonmetropolitan area | 70 | 0.48 | 2.57 | (4) | $ 55,610 |
| West Central-Southwest New Hampshire nonmetropolitan area | 50 | 0.48 | 2.56 | (4) | $ 57,680 |
| Southern Vermont nonmetropolitan area | 50 | 0.46 | 2.48 | (4) | $ 57,850 |
Top paying nonmetropolitan areas for Athletic Trainers:
| Nonmetropolitan area | Employment (1) | Employment per thousand jobs | Location quotient (9) | Hourly mean wage | Annual mean wage (2) |
|---|---|---|---|---|---|
| South Georgia nonmetropolitan area | 40 | 0.19 | 1.02 | (4) | $ 70,940 |
| East Georgia nonmetropolitan area | 50 | 0.54 | 2.85 | (4) | $ 67,560 |
| North Georgia nonmetropolitan area | 60 | 0.33 | 1.78 | (4) | $ 66,420 |
| Middle Georgia nonmetropolitan area | 40 | 0.32 | 1.70 | (4) | $ 64,860 |
| West Texas Region of Texas nonmetropolitan area | 30 | 0.16 | 0.85 | (4) | $ 62,750 |
These estimates are calculated with data collected from employers in all industry sectors, all metropolitan and nonmetropolitan areas, and all states and the District of Columbia. The top employment and wage figures are provided above. The complete list is available in the downloadable XLS files.
The percentile wage estimate is the value of a wage below which a certain percent of workers fall. The median wage is the 50th percentile wage estimate—50 percent of workers earn less than the median and 50 percent of workers earn more than the median. More about percentile wages.
(1) Estimates for detailed occupations do not sum to the totals because the totals include occupations not shown separately. Estimates do not include self-employed workers.
(2) Annual wages have been calculated by multiplying the hourly mean wage by a "year-round, full-time" hours figure of 2,080 hours; for those occupations where there is not an hourly wage published, the annual wage has been directly calculated from the reported survey data.
(3) The relative standard error (RSE) is a measure of the reliability of a survey statistic. The smaller the relative standard error, the more precise the estimate.
(4) Wages for some occupations that do not generally work year-round, full time, are reported either as hourly wages or annual salaries depending on how they are typically paid.
(9) The location quotient is the ratio of the area concentration of occupational employment to the national average concentration. A location quotient greater than one indicates the occupation has a higher share of employment than average, and a location quotient less than one indicates the occupation is less prevalent in the area than average.
Other OEWS estimates and related information:
May 2023 National Occupational Employment and Wage Estimates
May 2023 State Occupational Employment and Wage Estimates
May 2023 Metropolitan and Nonmetropolitan Area Occupational Employment and Wage Estimates
May 2023 National Industry-Specific Occupational Employment and Wage Estimates
Last Modified Date: April 3, 2024