
An official website of the United States government
An official website of the United States government
The .gov means it's official.
Federal government websites often end in .gov or .mil. Before sharing sensitive information,
make sure you're on a federal government site.
The site is secure.
The
https:// ensures that you are connecting to the official website and that any
information you provide is encrypted and transmitted securely.
Sell or solicit advertising space, time, or media in publications, signage, TV, radio, or Internet establishments or public spaces.
Employment estimate and mean wage estimates for Advertising Sales Agents:
| Employment (1) | Employment RSE (3) |
Mean hourly wage |
Mean annual wage (2) |
Wage RSE (3) |
|---|---|---|---|---|
| 108,100 | 2.0 % | $ 36.45 | $ 75,820 | 1.3 % |
Percentile wage estimates for Advertising Sales Agents:
| Percentile | 10% | 25% | 50% (Median) |
75% | 90% |
|---|---|---|---|---|---|
| Hourly Wage | $ 15.00 | $ 21.03 | $ 29.46 | $ 43.72 | $ 64.02 |
| Annual Wage (2) | $ 31,200 | $ 43,740 | $ 61,270 | $ 90,930 | $ 133,150 |
Industries with the highest published employment and wages for Advertising Sales Agents are provided. For a list of all industries with employment in Advertising Sales Agents, see the Create Customized Tables function.
Industries with the highest levels of employment in Advertising Sales Agents:
| Industry | Employment (1) | Percent of industry employment | Hourly mean wage | Annual mean wage (2) |
|---|---|---|---|---|
| Advertising, Public Relations, and Related Services | 48,890 | 9.78 | $ 39.26 | $ 81,650 |
| Newspaper, Periodical, Book, and Directory Publishers | 19,640 | 6.72 | $ 28.61 | $ 59,520 |
| Radio and Television Broadcasting Stations | 12,700 | 10.42 | $ 33.73 | $ 70,150 |
| Media Streaming Distribution Services, Social Networks, and Other Media Networks and Content Providers | 6,930 | 2.97 | $ 43.40 | $ 90,280 |
| Management, Scientific, and Technical Consulting Services | 4,150 | 0.22 | $ 28.57 | $ 59,430 |
Industries with the highest concentration of employment in Advertising Sales Agents:
| Industry | Employment (1) | Percent of industry employment | Hourly mean wage | Annual mean wage (2) |
|---|---|---|---|---|
| Radio and Television Broadcasting Stations | 12,700 | 10.42 | $ 33.73 | $ 70,150 |
| Advertising, Public Relations, and Related Services | 48,890 | 9.78 | $ 39.26 | $ 81,650 |
| Newspaper, Periodical, Book, and Directory Publishers | 19,640 | 6.72 | $ 28.61 | $ 59,520 |
| Media Streaming Distribution Services, Social Networks, and Other Media Networks and Content Providers | 6,930 | 2.97 | $ 43.40 | $ 90,280 |
| Web Search Portals, Libraries, Archives, and Other Information Services | 3,540 | 1.92 | (8) | (8) |
Top paying industries for Advertising Sales Agents:
| Industry | Employment (1) | Percent of industry employment | Hourly mean wage | Annual mean wage (2) |
|---|---|---|---|---|
| Merchant Wholesalers, Durable Goods (4232, 4233, 4235, 4236, 4237, and 4239 only) | 160 | 0.01 | $ 62.20 | $ 129,380 |
| Management of Companies and Enterprises | 1,130 | 0.04 | $ 61.21 | $ 127,310 |
| Computer Systems Design and Related Services | 710 | 0.03 | $ 49.69 | $ 103,350 |
| Motion Picture and Video Industries | 1,590 | 0.39 | $ 48.95 | $ 101,810 |
| Specialized Design Services | 130 | 0.08 | $ 44.84 | $ 93,270 |
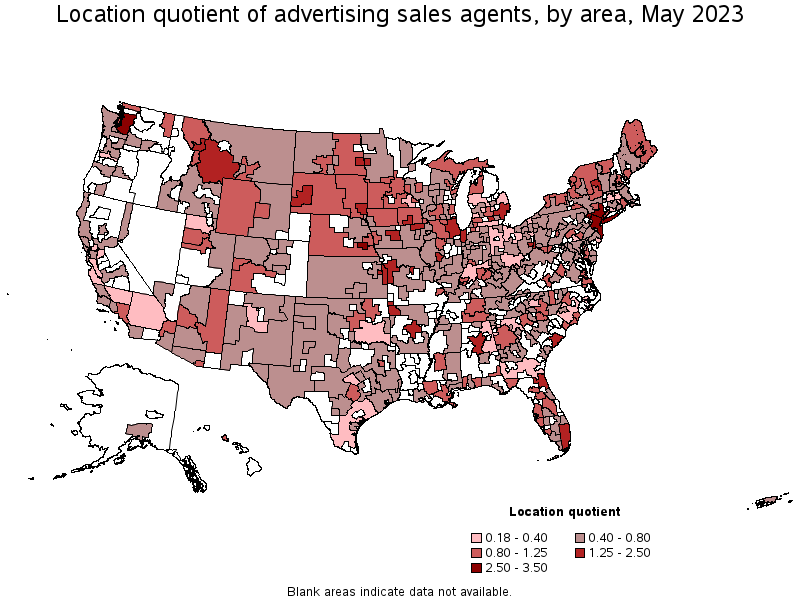
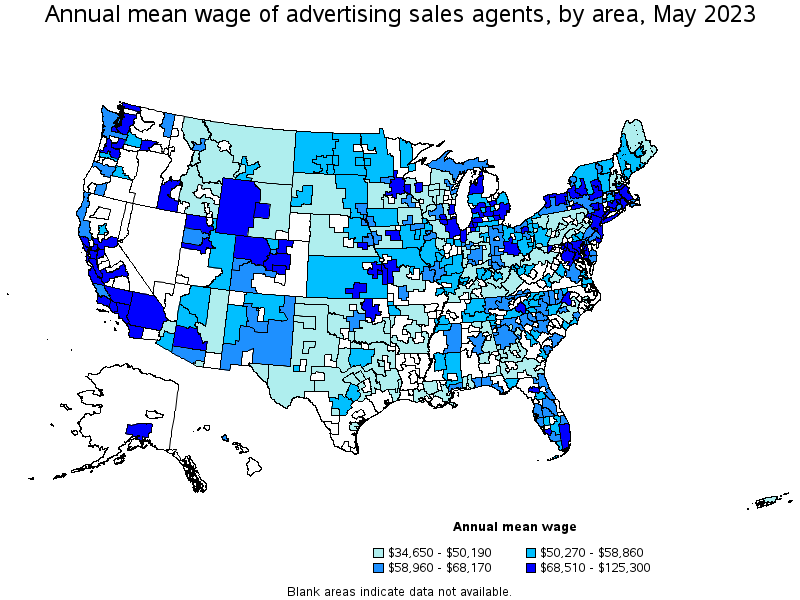
States and areas with the highest published employment, location quotients, and wages for Advertising Sales Agents are provided. For a list of all areas with employment in Advertising Sales Agents, see the Create Customized Tables function.
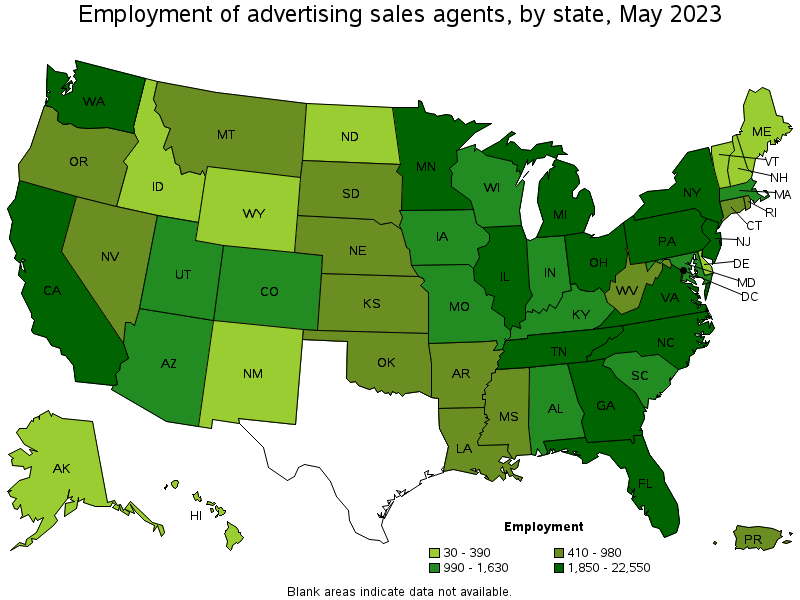
States with the highest employment level in Advertising Sales Agents:
| State | Employment (1) | Employment per thousand jobs | Location quotient (9) | Hourly mean wage | Annual mean wage (2) |
|---|---|---|---|---|---|
| New York | 22,550 | 2.40 | 3.37 | $ 51.95 | $ 108,050 |
| California | 8,590 | 0.48 | 0.67 | $ 39.82 | $ 82,820 |
| Florida | 7,160 | 0.75 | 1.05 | $ 31.88 | $ 66,310 |
| Illinois | 5,530 | 0.92 | 1.29 | $ 33.27 | $ 69,190 |
| Washington | 5,000 | 1.43 | 2.01 | $ 40.54 | $ 84,320 |
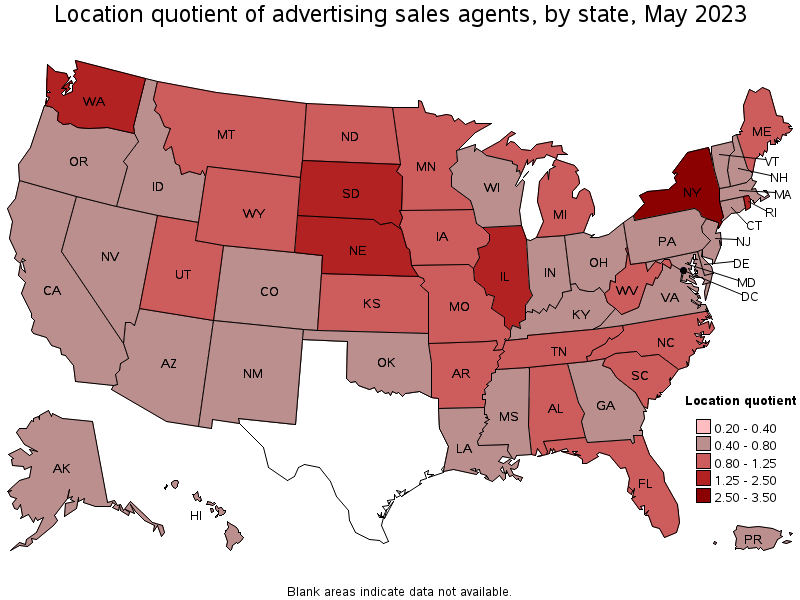
States with the highest concentration of jobs and location quotients in Advertising Sales Agents:
| State | Employment (1) | Employment per thousand jobs | Location quotient (9) | Hourly mean wage | Annual mean wage (2) |
|---|---|---|---|---|---|
| New York | 22,550 | 2.40 | 3.37 | $ 51.95 | $ 108,050 |
| Washington | 5,000 | 1.43 | 2.01 | $ 40.54 | $ 84,320 |
| Nebraska | 980 | 0.98 | 1.37 | $ 39.24 | $ 81,620 |
| Rhode Island | 470 | 0.97 | 1.36 | $ 37.96 | $ 78,960 |
| Illinois | 5,530 | 0.92 | 1.29 | $ 33.27 | $ 69,190 |
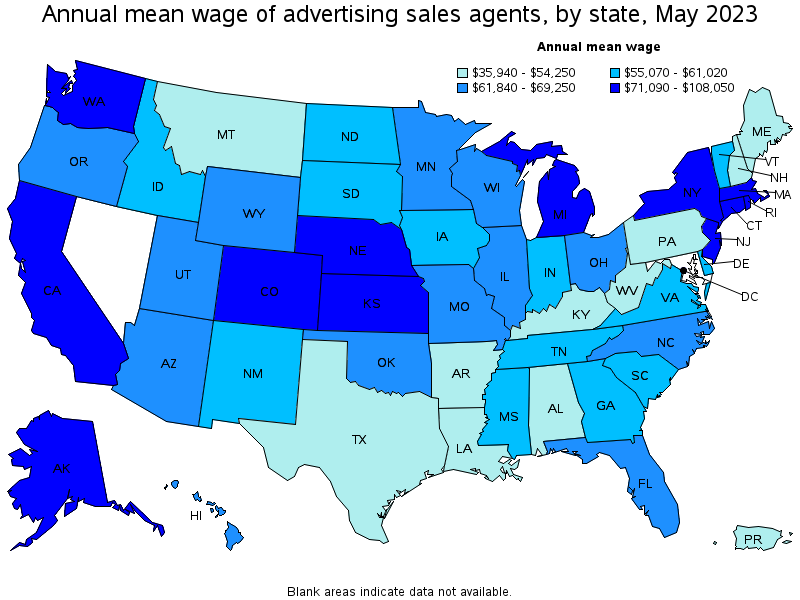
Top paying states for Advertising Sales Agents:
| State | Employment (1) | Employment per thousand jobs | Location quotient (9) | Hourly mean wage | Annual mean wage (2) |
|---|---|---|---|---|---|
| New York | 22,550 | 2.40 | 3.37 | $ 51.95 | $ 108,050 |
| Michigan | 3,650 | 0.84 | 1.18 | $ 41.18 | $ 85,650 |
| Washington | 5,000 | 1.43 | 2.01 | $ 40.54 | $ 84,320 |
| California | 8,590 | 0.48 | 0.67 | $ 39.82 | $ 82,820 |
| Nebraska | 980 | 0.98 | 1.37 | $ 39.24 | $ 81,620 |
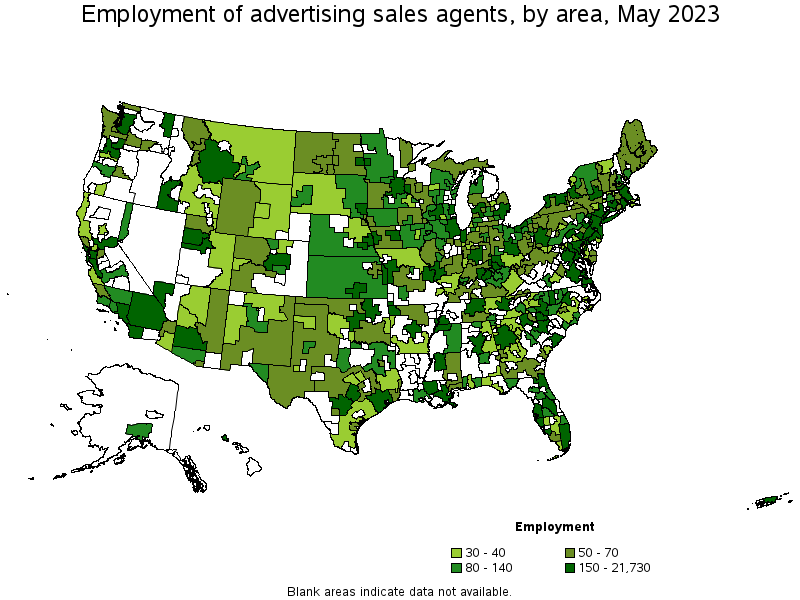
Metropolitan areas with the highest employment level in Advertising Sales Agents:
| Metropolitan area | Employment (1) | Employment per thousand jobs | Location quotient (9) | Hourly mean wage | Annual mean wage (2) |
|---|---|---|---|---|---|
| New York-Newark-Jersey City, NY-NJ-PA | 21,730 | 2.29 | 3.21 | $ 52.61 | $ 109,430 |
| Los Angeles-Long Beach-Anaheim, CA | 4,310 | 0.70 | 0.98 | $ 38.99 | $ 81,090 |
| Seattle-Tacoma-Bellevue, WA | 4,160 | 2.00 | 2.81 | $ 42.43 | $ 88,260 |
| Chicago-Naperville-Elgin, IL-IN-WI | 4,130 | 0.92 | 1.29 | $ 35.36 | $ 73,540 |
| Miami-Fort Lauderdale-West Palm Beach, FL | 2,440 | 0.90 | 1.26 | $ 33.49 | $ 69,650 |
| Atlanta-Sandy Springs-Roswell, GA | 1,730 | 0.61 | 0.86 | $ 29.64 | $ 61,650 |
| Detroit-Warren-Dearborn, MI | 1,700 | 0.89 | 1.25 | $ 40.71 | $ 84,670 |
| Houston-The Woodlands-Sugar Land, TX | 1,540 | 0.48 | 0.68 | (8) | (8) |
| Washington-Arlington-Alexandria, DC-VA-MD-WV | 1,400 | 0.45 | 0.64 | $ 38.10 | $ 79,240 |
| Philadelphia-Camden-Wilmington, PA-NJ-DE-MD | 1,340 | 0.47 | 0.66 | $ 29.73 | $ 61,830 |
Metropolitan areas with the highest concentration of jobs and location quotients in Advertising Sales Agents:
| Metropolitan area | Employment (1) | Employment per thousand jobs | Location quotient (9) | Hourly mean wage | Annual mean wage (2) |
|---|---|---|---|---|---|
| New York-Newark-Jersey City, NY-NJ-PA | 21,730 | 2.29 | 3.21 | $ 52.61 | $ 109,430 |
| Lincoln, NE | 370 | 2.05 | 2.87 | $ 56.82 | $ 118,180 |
| Seattle-Tacoma-Bellevue, WA | 4,160 | 2.00 | 2.81 | $ 42.43 | $ 88,260 |
| Rapid City, SD | 90 | 1.26 | 1.77 | $ 27.57 | $ 57,340 |
| Fargo, ND-MN | 180 | 1.23 | 1.73 | $ 26.59 | $ 55,320 |
| Des Moines-West Des Moines, IA | 470 | 1.21 | 1.70 | $ 33.77 | $ 70,250 |
| Springfield, IL | 130 | 1.21 | 1.70 | $ 26.59 | $ 55,300 |
| Glens Falls, NY | 50 | 1.07 | 1.51 | $ 41.26 | $ 85,830 |
| Fayetteville-Springdale-Rogers, AR-MO | 290 | 1.07 | 1.50 | $ 24.59 | $ 51,140 |
| Lawrence, KS | 50 | 1.03 | 1.44 | $ 39.66 | $ 82,490 |
Top paying metropolitan areas for Advertising Sales Agents:
| Metropolitan area | Employment (1) | Employment per thousand jobs | Location quotient (9) | Hourly mean wage | Annual mean wage (2) |
|---|---|---|---|---|---|
| Baltimore-Columbia-Towson, MD | 470 | 0.36 | 0.51 | $ 60.24 | $ 125,300 |
| Lincoln, NE | 370 | 2.05 | 2.87 | $ 56.82 | $ 118,180 |
| New York-Newark-Jersey City, NY-NJ-PA | 21,730 | 2.29 | 3.21 | $ 52.61 | $ 109,430 |
| San Jose-Sunnyvale-Santa Clara, CA | 310 | 0.27 | 0.39 | $ 46.26 | $ 96,220 |
| San Francisco-Oakland-Hayward, CA | 1,190 | 0.49 | 0.69 | $ 44.66 | $ 92,900 |
| Sacramento--Roseville--Arden-Arcade, CA | 360 | 0.34 | 0.48 | $ 43.60 | $ 90,690 |
| Santa Rosa, CA | 60 | 0.31 | 0.44 | $ 43.60 | $ 90,690 |
| Santa Maria-Santa Barbara, CA | 100 | 0.47 | 0.67 | $ 43.21 | $ 89,880 |
| Seattle-Tacoma-Bellevue, WA | 4,160 | 2.00 | 2.81 | $ 42.43 | $ 88,260 |
| Albany-Schenectady-Troy, NY | 310 | 0.70 | 0.99 | $ 42.32 | $ 88,020 |
Nonmetropolitan areas with the highest employment in Advertising Sales Agents:
| Nonmetropolitan area | Employment (1) | Employment per thousand jobs | Location quotient (9) | Hourly mean wage | Annual mean wage (2) |
|---|---|---|---|---|---|
| Southwest Montana nonmetropolitan area | 150 | 1.02 | 1.43 | $ 21.58 | $ 44,880 |
| Kansas nonmetropolitan area | 140 | 0.37 | 0.52 | $ 27.00 | $ 56,170 |
| Southeast Iowa nonmetropolitan area | 120 | 0.55 | 0.78 | $ 25.11 | $ 52,230 |
| Northwest Iowa nonmetropolitan area | 110 | 0.85 | 1.20 | $ 24.74 | $ 51,460 |
| Northwest Illinois nonmetropolitan area | 110 | 0.87 | 1.23 | $ 22.90 | $ 47,630 |
Nonmetropolitan areas with the highest concentration of jobs and location quotients in Advertising Sales Agents:
| Nonmetropolitan area | Employment (1) | Employment per thousand jobs | Location quotient (9) | Hourly mean wage | Annual mean wage (2) |
|---|---|---|---|---|---|
| Southwest Montana nonmetropolitan area | 150 | 1.02 | 1.43 | $ 21.58 | $ 44,880 |
| Northwest Illinois nonmetropolitan area | 110 | 0.87 | 1.23 | $ 22.90 | $ 47,630 |
| Central New Hampshire nonmetropolitan area | 80 | 0.87 | 1.22 | $ 19.54 | $ 40,640 |
| Northwest Iowa nonmetropolitan area | 110 | 0.85 | 1.20 | $ 24.74 | $ 51,460 |
| East North Dakota nonmetropolitan area | 50 | 0.82 | 1.15 | $ 27.79 | $ 57,800 |
Top paying nonmetropolitan areas for Advertising Sales Agents:
| Nonmetropolitan area | Employment (1) | Employment per thousand jobs | Location quotient (9) | Hourly mean wage | Annual mean wage (2) |
|---|---|---|---|---|---|
| Maryland nonmetropolitan area | 40 | 0.62 | 0.86 | $ 36.68 | $ 76,300 |
| Northwest Colorado nonmetropolitan area | 60 | 0.50 | 0.71 | $ 36.56 | $ 76,050 |
| Northwest Lower Peninsula of Michigan nonmetropolitan area | 90 | 0.74 | 1.04 | $ 33.54 | $ 69,770 |
| Western Wyoming nonmetropolitan area | 60 | 0.61 | 0.86 | $ 33.08 | $ 68,800 |
| North Coast Region of California nonmetropolitan area | 30 | 0.32 | 0.45 | $ 32.35 | $ 67,280 |
These estimates are calculated with data collected from employers in all industry sectors, all metropolitan and nonmetropolitan areas, and all states and the District of Columbia. The top employment and wage figures are provided above. The complete list is available in the downloadable XLS files.
The percentile wage estimate is the value of a wage below which a certain percent of workers fall. The median wage is the 50th percentile wage estimate—50 percent of workers earn less than the median and 50 percent of workers earn more than the median. More about percentile wages.
(1) Estimates for detailed occupations do not sum to the totals because the totals include occupations not shown separately. Estimates do not include self-employed workers.
(2) Annual wages have been calculated by multiplying the hourly mean wage by a "year-round, full-time" hours figure of 2,080 hours; for those occupations where there is not an hourly wage published, the annual wage has been directly calculated from the reported survey data.
(3) The relative standard error (RSE) is a measure of the reliability of a survey statistic. The smaller the relative standard error, the more precise the estimate.
(8) Estimate not released.
(9) The location quotient is the ratio of the area concentration of occupational employment to the national average concentration. A location quotient greater than one indicates the occupation has a higher share of employment than average, and a location quotient less than one indicates the occupation is less prevalent in the area than average.
Other OEWS estimates and related information:
May 2023 National Occupational Employment and Wage Estimates
May 2023 State Occupational Employment and Wage Estimates
May 2023 Metropolitan and Nonmetropolitan Area Occupational Employment and Wage Estimates
May 2023 National Industry-Specific Occupational Employment and Wage Estimates
Last Modified Date: April 3, 2024