
An official website of the United States government
An official website of the United States government
The .gov means it's official.
Federal government websites often end in .gov or .mil. Before sharing sensitive information,
make sure you're on a federal government site.
The site is secure.
The
https:// ensures that you are connecting to the official website and that any
information you provide is encrypted and transmitted securely.
Compose letters or electronic correspondence in reply to requests for merchandise, damage claims, credit and other information, delinquent accounts, incorrect billings, or unsatisfactory services. Duties may include gathering data to formulate reply and preparing correspondence.
Employment estimate and mean wage estimates for Correspondence Clerks:
| Employment (1) | Employment RSE (3) |
Mean hourly wage |
Mean annual wage (2) |
Wage RSE (3) |
|---|---|---|---|---|
| 4,650 | 15.0 % | $ 22.57 | $ 46,940 | 6.1 % |
Percentile wage estimates for Correspondence Clerks:
| Percentile | 10% | 25% | 50% (Median) |
75% | 90% |
|---|---|---|---|---|---|
| Hourly Wage | $ 15.00 | $ 17.43 | $ 20.25 | $ 27.72 | $ 33.00 |
| Annual Wage (2) | $ 31,200 | $ 36,250 | $ 42,120 | $ 57,660 | $ 68,650 |
Industries with the highest published employment and wages for Correspondence Clerks are provided. For a list of all industries with employment in Correspondence Clerks, see the Create Customized Tables function.
Industries with the highest levels of employment in Correspondence Clerks:
| Industry | Employment (1) | Percent of industry employment | Hourly mean wage | Annual mean wage (2) |
|---|---|---|---|---|
| Management of Companies and Enterprises | 420 | 0.02 | $ 23.15 | $ 48,160 |
| Automobile Dealers | 250 | 0.02 | $ 19.15 | $ 39,830 |
| Insurance Carriers | 210 | 0.02 | $ 22.21 | $ 46,200 |
| General Medical and Surgical Hospitals | 210 | 0.00 | $ 21.36 | $ 44,430 |
| Credit Intermediation and Related Activities (5221 and 5223 only) | 170 | 0.01 | $ 26.70 | $ 55,540 |
Industries with the highest concentration of employment in Correspondence Clerks:
| Industry | Employment (1) | Percent of industry employment | Hourly mean wage | Annual mean wage (2) |
|---|---|---|---|---|
| Automobile Dealers | 250 | 0.02 | $ 19.15 | $ 39,830 |
| Insurance Carriers | 210 | 0.02 | $ 22.21 | $ 46,200 |
| Management of Companies and Enterprises | 420 | 0.02 | $ 23.15 | $ 48,160 |
| Office Administrative Services | 90 | 0.02 | $ 18.81 | $ 39,130 |
| Computing Infrastructure Providers, Data Processing, Web Hosting, and Related Services | 50 | 0.01 | (8) | (8) |
Top paying industries for Correspondence Clerks:
| Industry | Employment (1) | Percent of industry employment | Hourly mean wage | Annual mean wage (2) |
|---|---|---|---|---|
| Accounting, Tax Preparation, Bookkeeping, and Payroll Services | (8) | (8) | $ 30.71 | $ 63,870 |
| Securities, Commodity Contracts, and Other Financial Investments and Related Activities | 60 | 0.01 | $ 28.69 | $ 59,670 |
| Credit Intermediation and Related Activities (5221 and 5223 only) | 170 | 0.01 | $ 26.70 | $ 55,540 |
| Merchant Wholesalers, Durable Goods (4232, 4233, 4235, 4236, 4237, and 4239 only) | (8) | (8) | $ 25.04 | $ 52,080 |
| Other Professional, Scientific, and Technical Services | 70 | 0.01 | $ 23.61 | $ 49,110 |
States and areas with the highest published employment, location quotients, and wages for Correspondence Clerks are provided. For a list of all areas with employment in Correspondence Clerks, see the Create Customized Tables function.
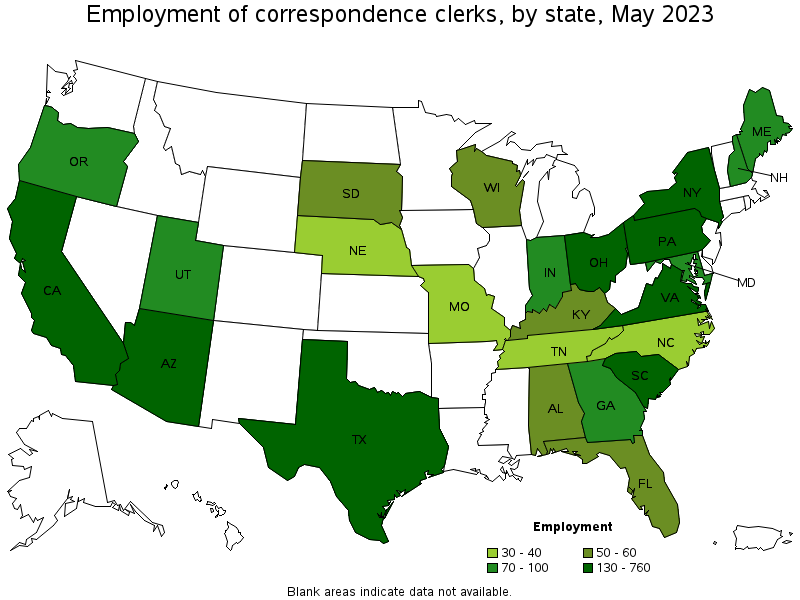
States with the highest employment level in Correspondence Clerks:
| State | Employment (1) | Employment per thousand jobs | Location quotient (9) | Hourly mean wage | Annual mean wage (2) |
|---|---|---|---|---|---|
| Texas | 760 | 0.06 | 1.84 | $ 19.24 | $ 40,030 |
| New York | 490 | 0.05 | 1.70 | $ 24.84 | $ 51,670 |
| California | 330 | 0.02 | 0.60 | $ 25.44 | $ 52,900 |
| South Carolina | 230 | 0.10 | 3.42 | $ 19.42 | $ 40,400 |
| Arizona | 230 | 0.07 | 2.39 | $ 21.23 | $ 44,170 |
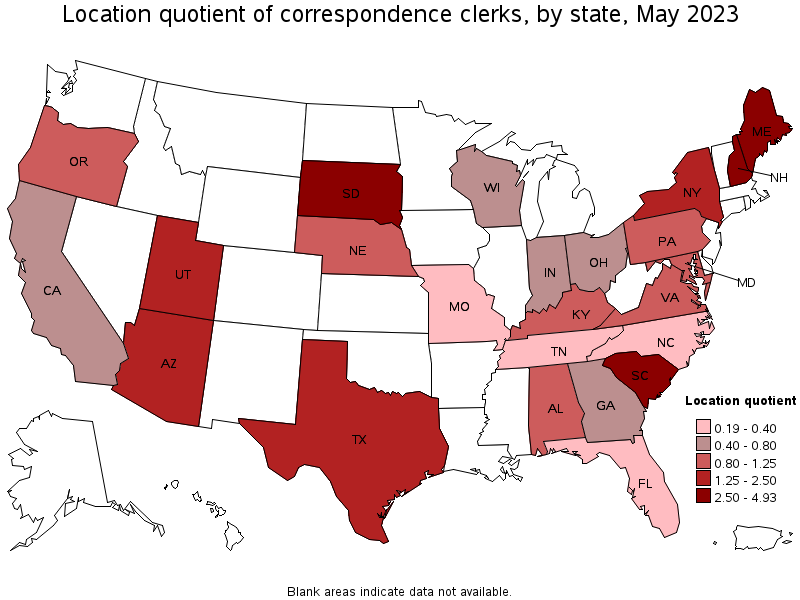
States with the highest concentration of jobs and location quotients in Correspondence Clerks:
| State | Employment (1) | Employment per thousand jobs | Location quotient (9) | Hourly mean wage | Annual mean wage (2) |
|---|---|---|---|---|---|
| New Hampshire | 100 | 0.15 | 4.93 | $ 22.15 | $ 46,080 |
| South Dakota | 50 | 0.12 | 3.95 | (8) | (8) |
| Maine | 70 | 0.11 | 3.43 | $ 20.26 | $ 42,150 |
| South Carolina | 230 | 0.10 | 3.42 | $ 19.42 | $ 40,400 |
| Arizona | 230 | 0.07 | 2.39 | $ 21.23 | $ 44,170 |
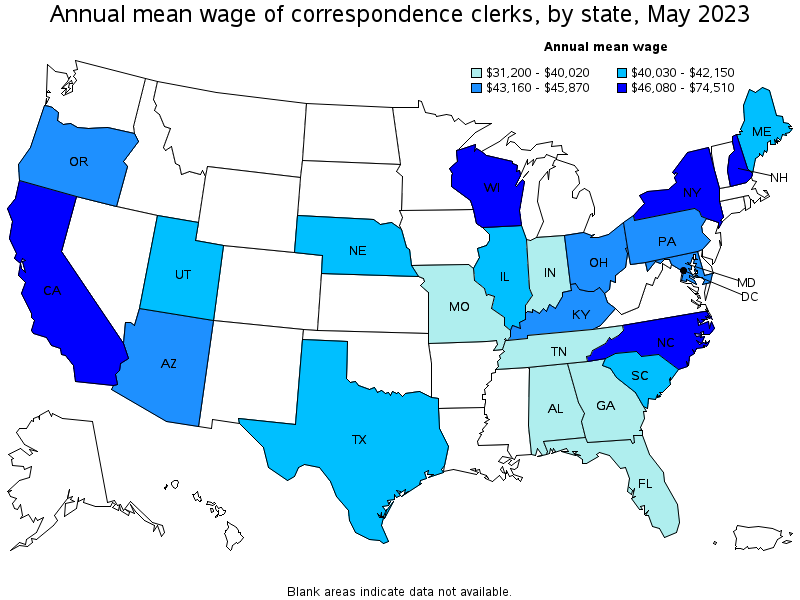
Top paying states for Correspondence Clerks:
| State | Employment (1) | Employment per thousand jobs | Location quotient (9) | Hourly mean wage | Annual mean wage (2) |
|---|---|---|---|---|---|
| District of Columbia | (8) | (8) | (8) | $ 35.82 | $ 74,510 |
| California | 330 | 0.02 | 0.60 | $ 25.44 | $ 52,900 |
| New York | 490 | 0.05 | 1.70 | $ 24.84 | $ 51,670 |
| North Carolina | 40 | 0.01 | 0.27 | $ 24.69 | $ 51,360 |
| Wisconsin | 50 | 0.02 | 0.56 | $ 22.27 | $ 46,320 |
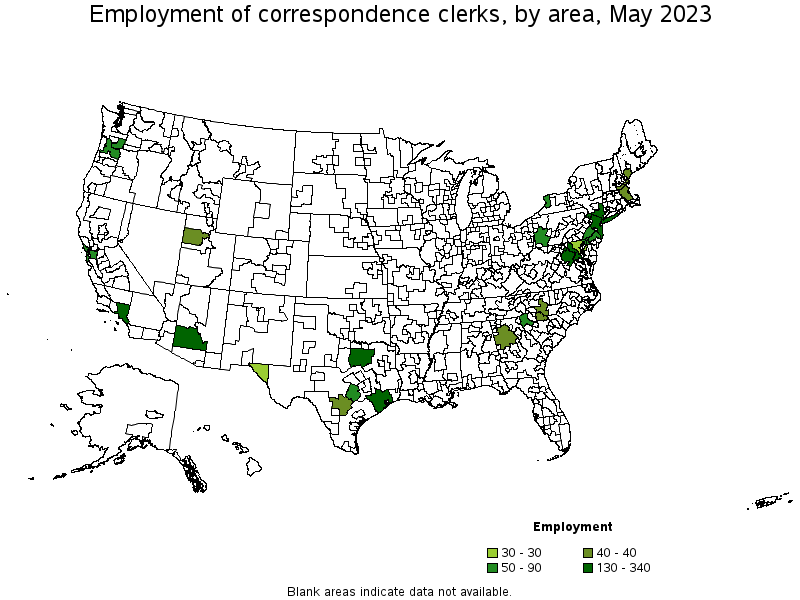
Metropolitan areas with the highest employment level in Correspondence Clerks:
| Metropolitan area | Employment (1) | Employment per thousand jobs | Location quotient (9) | Hourly mean wage | Annual mean wage (2) |
|---|---|---|---|---|---|
| New York-Newark-Jersey City, NY-NJ-PA | 340 | 0.04 | 1.18 | $ 26.81 | $ 55,760 |
| Dallas-Fort Worth-Arlington, TX | 270 | 0.07 | 2.23 | $ 20.34 | $ 42,310 |
| Houston-The Woodlands-Sugar Land, TX | 200 | 0.06 | 2.04 | $ 19.05 | $ 39,630 |
| Phoenix-Mesa-Scottsdale, AZ | 170 | 0.07 | 2.41 | $ 22.21 | $ 46,190 |
| Washington-Arlington-Alexandria, DC-VA-MD-WV | 160 | 0.05 | 1.66 | $ 24.84 | $ 51,670 |
| Los Angeles-Long Beach-Anaheim, CA | 130 | 0.02 | 0.71 | $ 24.46 | $ 50,870 |
| Greenville-Anderson-Mauldin, SC | 90 | 0.22 | 7.24 | $ 19.14 | $ 39,820 |
| Philadelphia-Camden-Wilmington, PA-NJ-DE-MD | 70 | 0.03 | 0.85 | $ 25.80 | $ 53,660 |
| San Francisco-Oakland-Hayward, CA | 70 | 0.03 | 0.95 | $ 31.94 | $ 66,440 |
| Pittsburgh, PA | 60 | 0.06 | 1.86 | $ 18.74 | $ 38,970 |
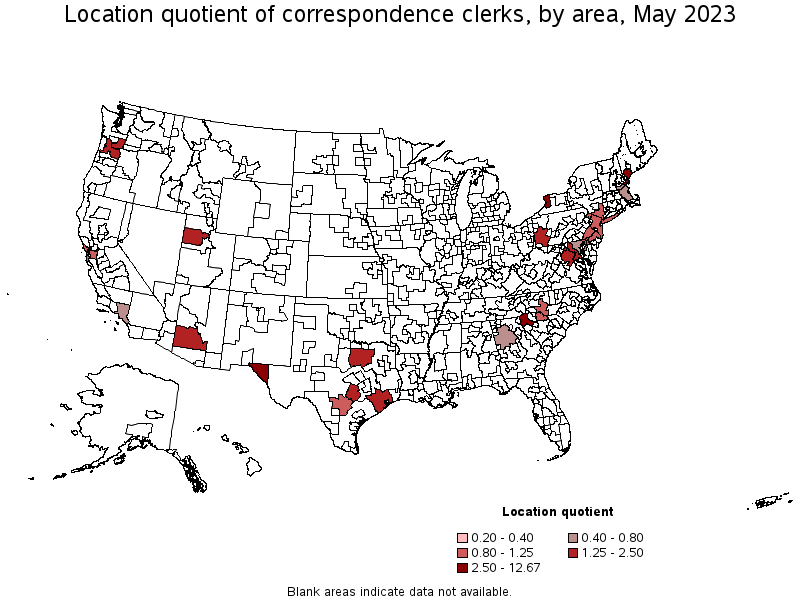
Metropolitan areas with the highest concentration of jobs and location quotients in Correspondence Clerks:
| Metropolitan area | Employment (1) | Employment per thousand jobs | Location quotient (9) | Hourly mean wage | Annual mean wage (2) |
|---|---|---|---|---|---|
| Portsmouth, NH-ME | 40 | 0.39 | 12.67 | $ 24.08 | $ 50,090 |
| Greenville-Anderson-Mauldin, SC | 90 | 0.22 | 7.24 | $ 19.14 | $ 39,820 |
| Portland-South Portland, ME | 40 | 0.19 | 6.10 | $ 21.33 | $ 44,360 |
| Buffalo-Cheektowaga-Niagara Falls, NY | 60 | 0.11 | 3.60 | $ 20.96 | $ 43,600 |
| El Paso, TX | 30 | 0.10 | 3.40 | $ 16.35 | $ 34,000 |
| Phoenix-Mesa-Scottsdale, AZ | 170 | 0.07 | 2.41 | $ 22.21 | $ 46,190 |
| Dallas-Fort Worth-Arlington, TX | 270 | 0.07 | 2.23 | $ 20.34 | $ 42,310 |
| Houston-The Woodlands-Sugar Land, TX | 200 | 0.06 | 2.04 | $ 19.05 | $ 39,630 |
| Pittsburgh, PA | 60 | 0.06 | 1.86 | $ 18.74 | $ 38,970 |
| Salt Lake City, UT | 40 | 0.05 | 1.68 | $ 19.73 | $ 41,050 |
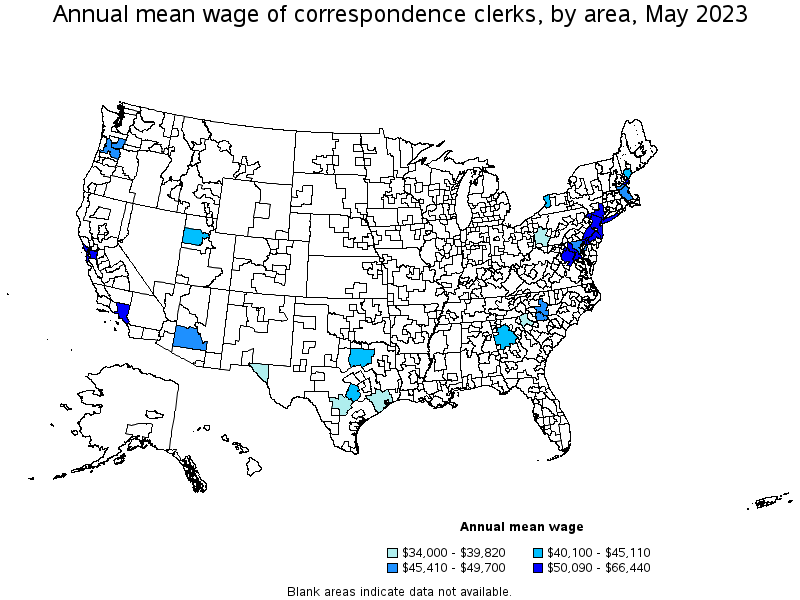
Top paying metropolitan areas for Correspondence Clerks:
| Metropolitan area | Employment (1) | Employment per thousand jobs | Location quotient (9) | Hourly mean wage | Annual mean wage (2) |
|---|---|---|---|---|---|
| San Francisco-Oakland-Hayward, CA | 70 | 0.03 | 0.95 | $ 31.94 | $ 66,440 |
| New York-Newark-Jersey City, NY-NJ-PA | 340 | 0.04 | 1.18 | $ 26.81 | $ 55,760 |
| Philadelphia-Camden-Wilmington, PA-NJ-DE-MD | 70 | 0.03 | 0.85 | $ 25.80 | $ 53,660 |
| Washington-Arlington-Alexandria, DC-VA-MD-WV | 160 | 0.05 | 1.66 | $ 24.84 | $ 51,670 |
| Los Angeles-Long Beach-Anaheim, CA | 130 | 0.02 | 0.71 | $ 24.46 | $ 50,870 |
| Portsmouth, NH-ME | 40 | 0.39 | 12.67 | $ 24.08 | $ 50,090 |
| Charlotte-Concord-Gastonia, NC-SC | 40 | 0.03 | 0.95 | $ 23.89 | $ 49,700 |
| Boston-Cambridge-Nashua, MA-NH | 40 | 0.01 | 0.46 | $ 22.59 | $ 46,990 |
| Baltimore-Columbia-Towson, MD | 30 | 0.02 | 0.78 | $ 22.27 | $ 46,310 |
| Phoenix-Mesa-Scottsdale, AZ | 170 | 0.07 | 2.41 | $ 22.21 | $ 46,190 |
These estimates are calculated with data collected from employers in all industry sectors, all metropolitan and nonmetropolitan areas, and all states and the District of Columbia. The top employment and wage figures are provided above. The complete list is available in the downloadable XLS files.
The percentile wage estimate is the value of a wage below which a certain percent of workers fall. The median wage is the 50th percentile wage estimate—50 percent of workers earn less than the median and 50 percent of workers earn more than the median. More about percentile wages.
(1) Estimates for detailed occupations do not sum to the totals because the totals include occupations not shown separately. Estimates do not include self-employed workers.
(2) Annual wages have been calculated by multiplying the hourly mean wage by a "year-round, full-time" hours figure of 2,080 hours; for those occupations where there is not an hourly wage published, the annual wage has been directly calculated from the reported survey data.
(3) The relative standard error (RSE) is a measure of the reliability of a survey statistic. The smaller the relative standard error, the more precise the estimate.
(8) Estimate not released.
(9) The location quotient is the ratio of the area concentration of occupational employment to the national average concentration. A location quotient greater than one indicates the occupation has a higher share of employment than average, and a location quotient less than one indicates the occupation is less prevalent in the area than average.
Other OEWS estimates and related information:
May 2023 National Occupational Employment and Wage Estimates
May 2023 State Occupational Employment and Wage Estimates
May 2023 Metropolitan and Nonmetropolitan Area Occupational Employment and Wage Estimates
May 2023 National Industry-Specific Occupational Employment and Wage Estimates
Last Modified Date: April 3, 2024