
An official website of the United States government
An official website of the United States government
The .gov means it's official.
Federal government websites often end in .gov or .mil. Before sharing sensitive information,
make sure you're on a federal government site.
The site is secure.
The
https:// ensures that you are connecting to the official website and that any
information you provide is encrypted and transmitted securely.
Lay and bind building materials, such as brick, structural tile, concrete block, cinder block, glass block, and terra-cotta block, with mortar and other substances, to construct or repair walls, partitions, arches, sewers, and other structures. Installers of mortarless segmental concrete masonry wall units are classified in �Landscaping and Groundskeeping Workers� (37-3011). Excludes �Stonemasons� (47-2022).
Employment estimate and mean wage estimates for Brickmasons and Blockmasons:
| Employment (1) | Employment RSE (3) |
Mean hourly wage |
Mean annual wage (2) |
Wage RSE (3) |
|---|---|---|---|---|
| 56,830 | 2.0 % | $ 30.50 | $ 63,430 | 0.8 % |
Percentile wage estimates for Brickmasons and Blockmasons:
| Percentile | 10% | 25% | 50% (Median) |
75% | 90% |
|---|---|---|---|---|---|
| Hourly Wage | $ 18.44 | $ 23.20 | $ 28.67 | $ 36.01 | $ 45.30 |
| Annual Wage (2) | $ 38,360 | $ 48,250 | $ 59,640 | $ 74,900 | $ 94,220 |
Industries with the highest published employment and wages for Brickmasons and Blockmasons are provided. For a list of all industries with employment in Brickmasons and Blockmasons, see the Create Customized Tables function.
Industries with the highest levels of employment in Brickmasons and Blockmasons:
| Industry | Employment (1) | Percent of industry employment | Hourly mean wage | Annual mean wage (2) |
|---|---|---|---|---|
| Foundation, Structure, and Building Exterior Contractors | 44,930 | 4.59 | $ 30.33 | $ 63,090 |
| Nonresidential Building Construction | 4,260 | 0.50 | $ 31.74 | $ 66,020 |
| Other Specialty Trade Contractors | 1,600 | 0.21 | $ 24.90 | $ 51,790 |
| Building Finishing Contractors | 1,520 | 0.18 | $ 30.74 | $ 63,940 |
| Residential Building Construction | 1,200 | 0.13 | $ 38.40 | $ 79,870 |
Industries with the highest concentration of employment in Brickmasons and Blockmasons:
| Industry | Employment (1) | Percent of industry employment | Hourly mean wage | Annual mean wage (2) |
|---|---|---|---|---|
| Foundation, Structure, and Building Exterior Contractors | 44,930 | 4.59 | $ 30.33 | $ 63,090 |
| Nonresidential Building Construction | 4,260 | 0.50 | $ 31.74 | $ 66,020 |
| Iron and Steel Mills and Ferroalloy Manufacturing | 190 | 0.23 | $ 24.74 | $ 51,460 |
| Other Specialty Trade Contractors | 1,600 | 0.21 | $ 24.90 | $ 51,790 |
| Building Finishing Contractors | 1,520 | 0.18 | $ 30.74 | $ 63,940 |
Top paying industries for Brickmasons and Blockmasons:
| Industry | Employment (1) | Percent of industry employment | Hourly mean wage | Annual mean wage (2) |
|---|---|---|---|---|
| Other Heavy and Civil Engineering Construction | 50 | 0.04 | $ 40.99 | $ 85,260 |
| Building Equipment Contractors | 330 | 0.01 | $ 39.39 | $ 81,930 |
| Highway, Street, and Bridge Construction | 140 | 0.04 | $ 39.38 | $ 81,920 |
| Residential Building Construction | 1,200 | 0.13 | $ 38.40 | $ 79,870 |
| Utility System Construction | 40 | 0.01 | $ 37.02 | $ 77,000 |
States and areas with the highest published employment, location quotients, and wages for Brickmasons and Blockmasons are provided. For a list of all areas with employment in Brickmasons and Blockmasons, see the Create Customized Tables function.
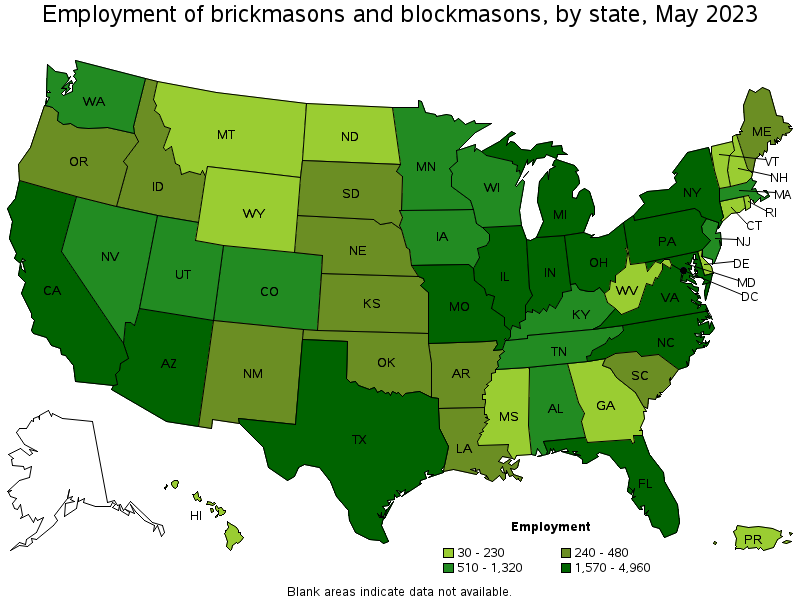
States with the highest employment level in Brickmasons and Blockmasons:
| State | Employment (1) | Employment per thousand jobs | Location quotient (9) | Hourly mean wage | Annual mean wage (2) |
|---|---|---|---|---|---|
| Texas | 4,960 | 0.37 | 0.98 | $ 24.35 | $ 50,650 |
| Florida | 4,820 | 0.50 | 1.35 | $ 22.73 | $ 47,280 |
| New York | 4,160 | 0.44 | 1.18 | $ 40.34 | $ 83,910 |
| Pennsylvania | 3,310 | 0.56 | 1.49 | $ 33.69 | $ 70,060 |
| Illinois | 3,160 | 0.52 | 1.40 | $ 39.52 | $ 82,200 |
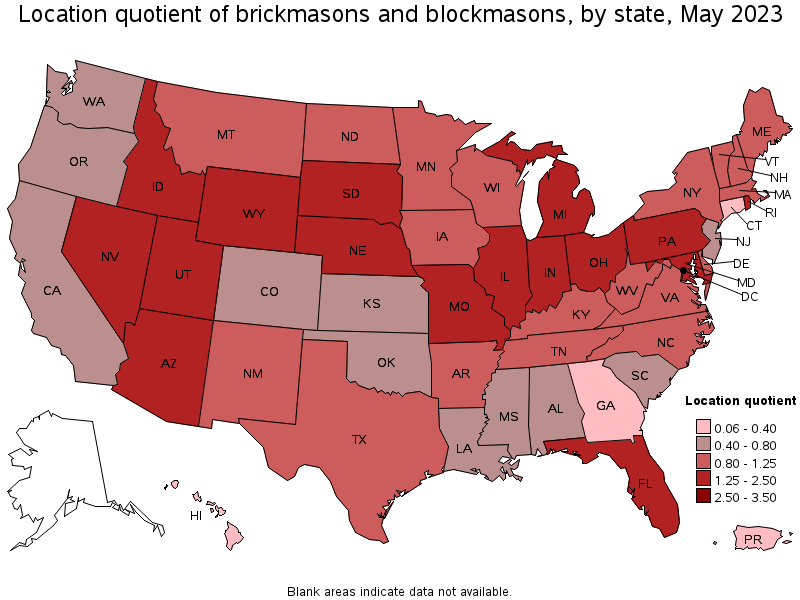
States with the highest concentration of jobs and location quotients in Brickmasons and Blockmasons:
| State | Employment (1) | Employment per thousand jobs | Location quotient (9) | Hourly mean wage | Annual mean wage (2) |
|---|---|---|---|---|---|
| Utah | 1,290 | 0.77 | 2.05 | $ 28.69 | $ 59,680 |
| Wyoming | 200 | 0.73 | 1.95 | $ 30.76 | $ 63,980 |
| Michigan | 2,760 | 0.63 | 1.69 | $ 28.59 | $ 59,470 |
| Indiana | 1,910 | 0.60 | 1.61 | $ 31.65 | $ 65,840 |
| Maryland | 1,570 | 0.59 | 1.57 | $ 26.66 | $ 55,440 |
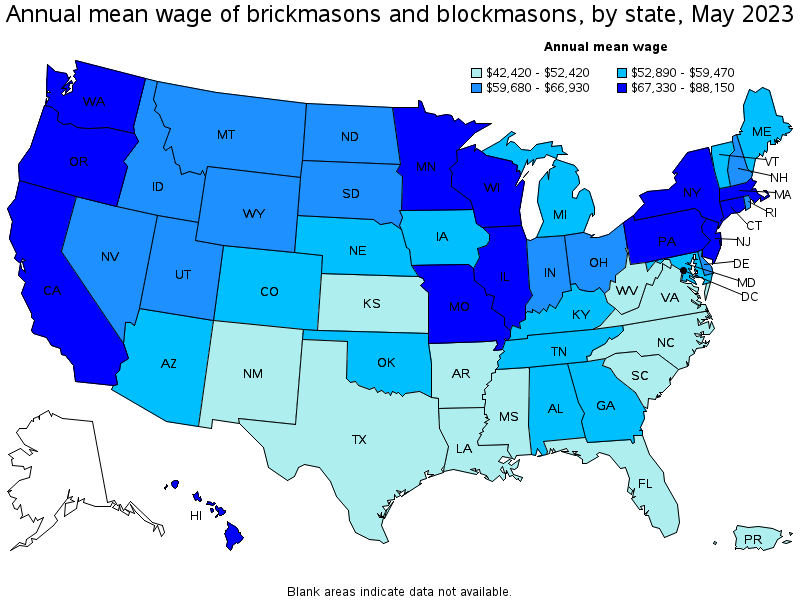
Top paying states for Brickmasons and Blockmasons:
| State | Employment (1) | Employment per thousand jobs | Location quotient (9) | Hourly mean wage | Annual mean wage (2) |
|---|---|---|---|---|---|
| Massachusetts | 1,290 | 0.35 | 0.94 | $ 42.38 | $ 88,150 |
| Washington | 830 | 0.24 | 0.63 | $ 42.25 | $ 87,880 |
| New York | 4,160 | 0.44 | 1.18 | $ 40.34 | $ 83,910 |
| Illinois | 3,160 | 0.52 | 1.40 | $ 39.52 | $ 82,200 |
| New Jersey | 660 | 0.16 | 0.42 | $ 39.08 | $ 81,290 |
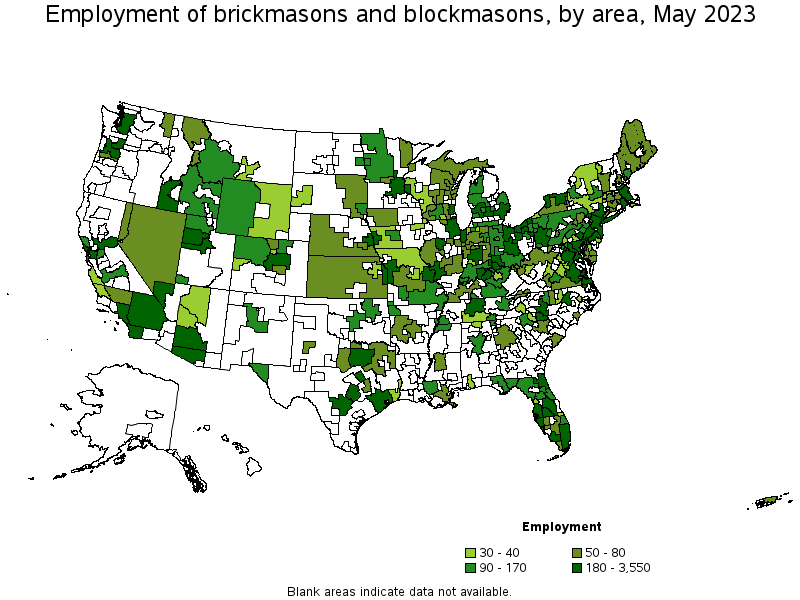
Metropolitan areas with the highest employment level in Brickmasons and Blockmasons:
| Metropolitan area | Employment (1) | Employment per thousand jobs | Location quotient (9) | Hourly mean wage | Annual mean wage (2) |
|---|---|---|---|---|---|
| New York-Newark-Jersey City, NY-NJ-PA | 3,550 | 0.37 | 1.00 | $ 42.59 | $ 88,580 |
| Chicago-Naperville-Elgin, IL-IN-WI | 2,440 | 0.54 | 1.45 | $ 40.30 | $ 83,820 |
| Washington-Arlington-Alexandria, DC-VA-MD-WV | 1,840 | 0.60 | 1.59 | $ 29.05 | $ 60,430 |
| Dallas-Fort Worth-Arlington, TX | 1,770 | 0.45 | 1.19 | $ 25.56 | $ 53,170 |
| Detroit-Warren-Dearborn, MI | 1,580 | 0.83 | 2.22 | $ 28.41 | $ 59,080 |
| Philadelphia-Camden-Wilmington, PA-NJ-DE-MD | 1,220 | 0.43 | 1.15 | $ 36.74 | $ 76,430 |
| Houston-The Woodlands-Sugar Land, TX | 1,210 | 0.38 | 1.02 | $ 24.62 | $ 51,210 |
| Phoenix-Mesa-Scottsdale, AZ | 1,150 | 0.50 | 1.35 | $ 28.03 | $ 58,310 |
| Minneapolis-St. Paul-Bloomington, MN-WI | 970 | 0.51 | 1.36 | $ 39.34 | $ 81,830 |
| Miami-Fort Lauderdale-West Palm Beach, FL | 900 | 0.33 | 0.88 | $ 23.78 | $ 49,450 |
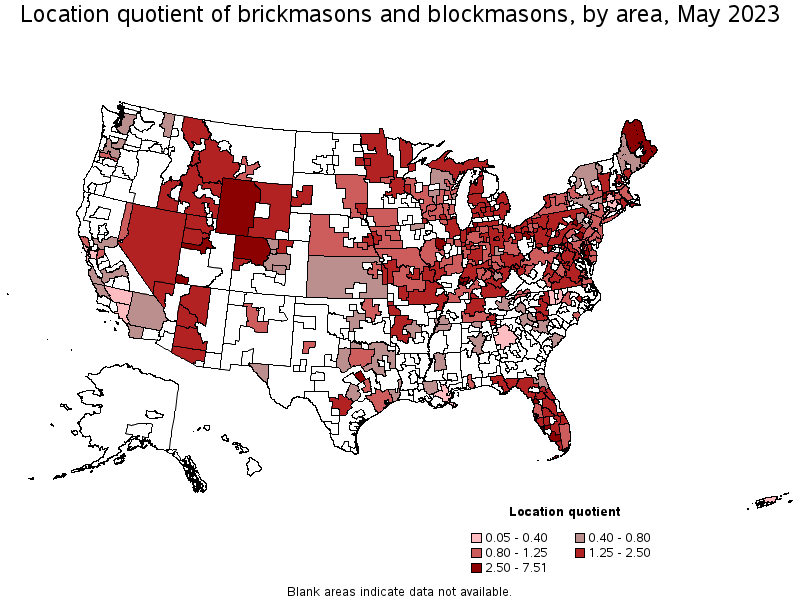
Metropolitan areas with the highest concentration of jobs and location quotients in Brickmasons and Blockmasons:
| Metropolitan area | Employment (1) | Employment per thousand jobs | Location quotient (9) | Hourly mean wage | Annual mean wage (2) |
|---|---|---|---|---|---|
| Peoria, IL | 460 | 2.81 | 7.51 | $ 40.45 | $ 84,140 |
| Waco, TX | 300 | 2.39 | 6.37 | $ 23.15 | $ 48,150 |
| Naples-Immokalee-Marco Island, FL | 310 | 1.89 | 5.05 | $ 23.15 | $ 48,160 |
| Provo-Orem, UT | 470 | 1.61 | 4.31 | $ 29.28 | $ 60,900 |
| Lancaster, PA | 360 | 1.45 | 3.88 | $ 30.19 | $ 62,790 |
| Bloomsburg-Berwick, PA | 50 | 1.25 | 3.33 | $ 34.12 | $ 70,980 |
| Homosassa Springs, FL | 40 | 1.19 | 3.18 | $ 22.54 | $ 46,890 |
| St. George, UT | 90 | 1.13 | 3.02 | $ 25.35 | $ 52,730 |
| Pittsfield, MA | 40 | 1.08 | 2.90 | $ 42.07 | $ 87,510 |
| Michigan City-La Porte, IN | 40 | 1.06 | 2.84 | $ 28.91 | $ 60,140 |
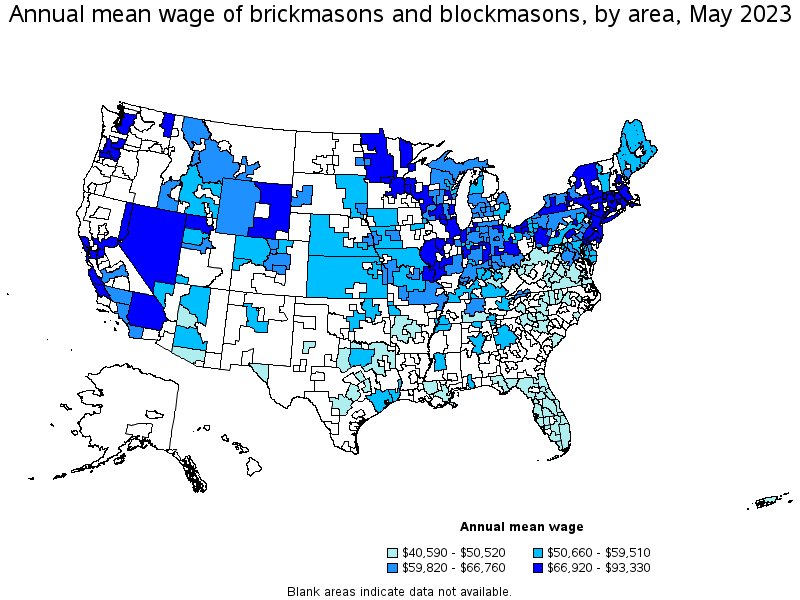
Top paying metropolitan areas for Brickmasons and Blockmasons:
| Metropolitan area | Employment (1) | Employment per thousand jobs | Location quotient (9) | Hourly mean wage | Annual mean wage (2) |
|---|---|---|---|---|---|
| Seattle-Tacoma-Bellevue, WA | 490 | 0.24 | 0.63 | $ 44.87 | $ 93,330 |
| Boston-Cambridge-Nashua, MA-NH | 850 | 0.31 | 0.83 | $ 43.55 | $ 90,580 |
| New York-Newark-Jersey City, NY-NJ-PA | 3,550 | 0.37 | 1.00 | $ 42.59 | $ 88,580 |
| Pittsfield, MA | 40 | 1.08 | 2.90 | $ 42.07 | $ 87,510 |
| Atlantic City-Hammonton, NJ | 40 | 0.30 | 0.81 | $ 41.34 | $ 85,990 |
| Hartford-West Hartford-East Hartford, CT | 70 | 0.12 | 0.32 | $ 40.93 | $ 85,130 |
| New Haven, CT | 50 | 0.18 | 0.48 | $ 40.46 | $ 84,160 |
| Peoria, IL | 460 | 2.81 | 7.51 | $ 40.45 | $ 84,140 |
| Chicago-Naperville-Elgin, IL-IN-WI | 2,440 | 0.54 | 1.45 | $ 40.30 | $ 83,820 |
| Minneapolis-St. Paul-Bloomington, MN-WI | 970 | 0.51 | 1.36 | $ 39.34 | $ 81,830 |
Nonmetropolitan areas with the highest employment in Brickmasons and Blockmasons:
| Nonmetropolitan area | Employment (1) | Employment per thousand jobs | Location quotient (9) | Hourly mean wage | Annual mean wage (2) |
|---|---|---|---|---|---|
| North Northeastern Ohio nonmetropolitan area (noncontiguous) | 220 | 0.67 | 1.79 | $ 28.45 | $ 59,170 |
| West Northwestern Ohio nonmetropolitan area | 160 | 0.66 | 1.76 | $ 29.96 | $ 62,310 |
| Southern Pennsylvania nonmetropolitan area | 140 | 0.74 | 1.99 | $ 27.99 | $ 58,220 |
| Balance of Lower Peninsula of Michigan nonmetropolitan area | 140 | 0.53 | 1.41 | $ 29.28 | $ 60,910 |
| Western Wyoming nonmetropolitan area | 130 | 1.34 | 3.59 | $ 29.20 | $ 60,730 |
Nonmetropolitan areas with the highest concentration of jobs and location quotients in Brickmasons and Blockmasons:
| Nonmetropolitan area | Employment (1) | Employment per thousand jobs | Location quotient (9) | Hourly mean wage | Annual mean wage (2) |
|---|---|---|---|---|---|
| Western Wyoming nonmetropolitan area | 130 | 1.34 | 3.59 | $ 29.20 | $ 60,730 |
| Maryland nonmetropolitan area | 60 | 1.01 | 2.69 | $ 25.48 | $ 53,000 |
| Northeast Maine nonmetropolitan area | 70 | 1.00 | 2.69 | $ 26.47 | $ 55,060 |
| Northwest Colorado nonmetropolitan area | 120 | 0.97 | 2.60 | $ 25.69 | $ 53,440 |
| Southeast-Central Idaho nonmetropolitan area | 90 | 0.92 | 2.46 | $ 27.55 | $ 57,300 |
Top paying nonmetropolitan areas for Brickmasons and Blockmasons:
| Nonmetropolitan area | Employment (1) | Employment per thousand jobs | Location quotient (9) | Hourly mean wage | Annual mean wage (2) |
|---|---|---|---|---|---|
| Western Wisconsin nonmetropolitan area | 40 | 0.33 | 0.87 | $ 39.54 | $ 82,240 |
| Nevada nonmetropolitan area | 70 | 0.66 | 1.77 | $ 38.89 | $ 80,890 |
| Capital/Northern New York nonmetropolitan area | 40 | 0.26 | 0.70 | $ 37.97 | $ 78,980 |
| Massachusetts nonmetropolitan area | 40 | 0.58 | 1.56 | $ 35.89 | $ 74,640 |
| Eastern Wyoming nonmetropolitan area | 40 | 0.53 | 1.41 | $ 34.50 | $ 71,760 |
These estimates are calculated with data collected from employers in all industry sectors, all metropolitan and nonmetropolitan areas, and all states and the District of Columbia. The top employment and wage figures are provided above. The complete list is available in the downloadable XLS files.
The percentile wage estimate is the value of a wage below which a certain percent of workers fall. The median wage is the 50th percentile wage estimate—50 percent of workers earn less than the median and 50 percent of workers earn more than the median. More about percentile wages.
(1) Estimates for detailed occupations do not sum to the totals because the totals include occupations not shown separately. Estimates do not include self-employed workers.
(2) Annual wages have been calculated by multiplying the hourly mean wage by a "year-round, full-time" hours figure of 2,080 hours; for those occupations where there is not an hourly wage published, the annual wage has been directly calculated from the reported survey data.
(3) The relative standard error (RSE) is a measure of the reliability of a survey statistic. The smaller the relative standard error, the more precise the estimate.
(9) The location quotient is the ratio of the area concentration of occupational employment to the national average concentration. A location quotient greater than one indicates the occupation has a higher share of employment than average, and a location quotient less than one indicates the occupation is less prevalent in the area than average.
Other OEWS estimates and related information:
May 2023 National Occupational Employment and Wage Estimates
May 2023 State Occupational Employment and Wage Estimates
May 2023 Metropolitan and Nonmetropolitan Area Occupational Employment and Wage Estimates
May 2023 National Industry-Specific Occupational Employment and Wage Estimates
Last Modified Date: April 3, 2024