
An official website of the United States government
An official website of the United States government
The .gov means it's official.
Federal government websites often end in .gov or .mil. Before sharing sensitive information,
make sure you're on a federal government site.
The site is secure.
The
https:// ensures that you are connecting to the official website and that any
information you provide is encrypted and transmitted securely.
Perform tasks involving physical labor at construction sites. May operate hand and power tools of all types: air hammers, earth tampers, cement mixers, small mechanical hoists, surveying and measuring equipment, and a variety of other equipment and instruments. May clean and prepare sites, dig trenches, set braces to support the sides of excavations, erect scaffolding, and clean up rubble, debris, and other waste materials. May assist other craft workers. Construction laborers who primarily assist a particular craft worker are classified under �Helpers, Construction Trades� (47-3010). Excludes �Hazardous Materials Removal Workers� (47-4041).
Employment estimate and mean wage estimates for Construction Laborers:
| Employment (1) | Employment RSE (3) |
Mean hourly wage |
Mean annual wage (2) |
Wage RSE (3) |
|---|---|---|---|---|
| 1,019,090 | 1.3 % | $ 23.69 | $ 49,280 | 0.4 % |
Percentile wage estimates for Construction Laborers:
| Percentile | 10% | 25% | 50% (Median) |
75% | 90% |
|---|---|---|---|---|---|
| Hourly Wage | $ 15.15 | $ 17.82 | $ 21.78 | $ 27.30 | $ 36.54 |
| Annual Wage (2) | $ 31,510 | $ 37,070 | $ 45,300 | $ 56,780 | $ 76,010 |
Industries with the highest published employment and wages for Construction Laborers are provided. For a list of all industries with employment in Construction Laborers, see the Create Customized Tables function.
Industries with the highest levels of employment in Construction Laborers:
| Industry | Employment (1) | Percent of industry employment | Hourly mean wage | Annual mean wage (2) |
|---|---|---|---|---|
| Other Specialty Trade Contractors | 177,760 | 22.87 | $ 23.30 | $ 48,450 |
| Residential Building Construction | 132,700 | 14.32 | $ 22.34 | $ 46,460 |
| Utility System Construction | 121,530 | 21.05 | $ 24.72 | $ 51,420 |
| Nonresidential Building Construction | 113,670 | 13.24 | $ 25.40 | $ 52,830 |
| Foundation, Structure, and Building Exterior Contractors | 104,840 | 10.71 | $ 23.63 | $ 49,150 |
Industries with the highest concentration of employment in Construction Laborers:
| Industry | Employment (1) | Percent of industry employment | Hourly mean wage | Annual mean wage (2) |
|---|---|---|---|---|
| Other Heavy and Civil Engineering Construction | 31,750 | 25.11 | $ 24.82 | $ 51,620 |
| Highway, Street, and Bridge Construction | 85,820 | 23.35 | $ 27.50 | $ 57,210 |
| Other Specialty Trade Contractors | 177,760 | 22.87 | $ 23.30 | $ 48,450 |
| Utility System Construction | 121,530 | 21.05 | $ 24.72 | $ 51,420 |
| Residential Building Construction | 132,700 | 14.32 | $ 22.34 | $ 46,460 |
Top paying industries for Construction Laborers:
| Industry | Employment (1) | Percent of industry employment | Hourly mean wage | Annual mean wage (2) |
|---|---|---|---|---|
| Pipeline Transportation of Natural Gas | (8) | (8) | $ 45.50 | $ 94,640 |
| Scientific Research and Development Services | (8) | (8) | $ 32.69 | $ 68,000 |
| Other Miscellaneous Manufacturing | 80 | 0.03 | $ 31.22 | $ 64,930 |
| Other Support Services | 1,080 | 0.33 | $ 30.84 | $ 64,140 |
| Machinery, Equipment, and Supplies Merchant Wholesalers | (8) | (8) | $ 30.81 | $ 64,080 |
States and areas with the highest published employment, location quotients, and wages for Construction Laborers are provided. For a list of all areas with employment in Construction Laborers, see the Create Customized Tables function.
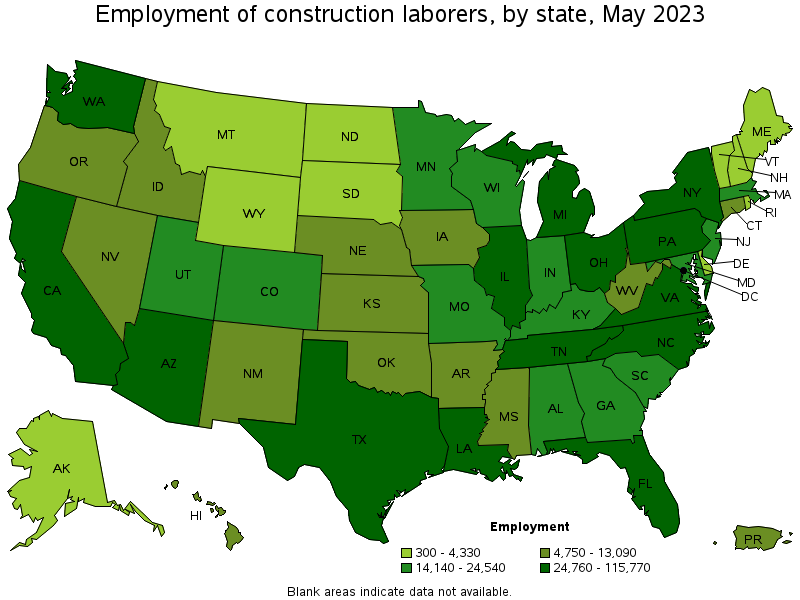
States with the highest employment level in Construction Laborers:
| State | Employment (1) | Employment per thousand jobs | Location quotient (9) | Hourly mean wage | Annual mean wage (2) |
|---|---|---|---|---|---|
| Texas | 115,770 | 8.54 | 1.27 | $ 18.74 | $ 38,990 |
| California | 89,950 | 5.01 | 0.75 | $ 29.67 | $ 61,710 |
| Florida | 69,690 | 7.28 | 1.09 | $ 19.56 | $ 40,680 |
| New York | 49,080 | 5.23 | 0.78 | $ 30.69 | $ 63,830 |
| Pennsylvania | 39,370 | 6.62 | 0.99 | $ 25.14 | $ 52,290 |
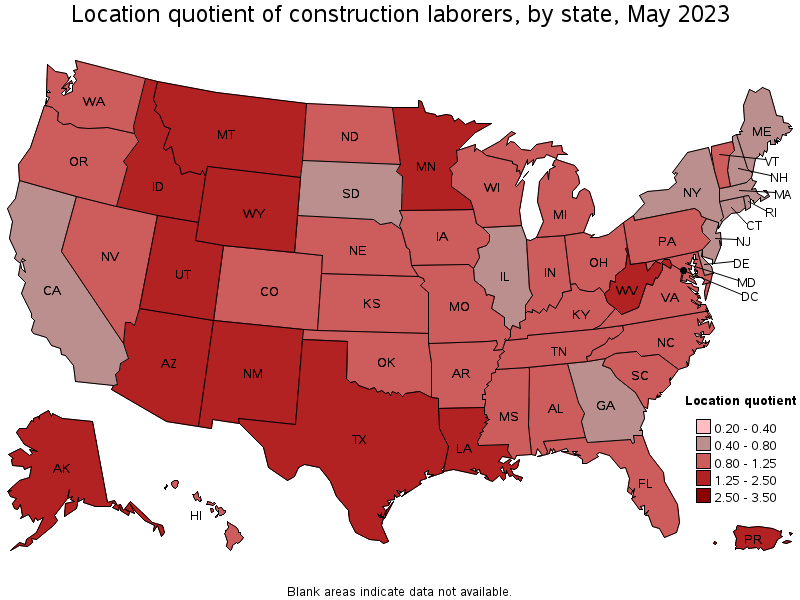
States with the highest concentration of jobs and location quotients in Construction Laborers:
| State | Employment (1) | Employment per thousand jobs | Location quotient (9) | Hourly mean wage | Annual mean wage (2) |
|---|---|---|---|---|---|
| Louisiana | 24,760 | 13.37 | 1.99 | $ 20.98 | $ 43,640 |
| New Mexico | 10,930 | 12.93 | 1.93 | $ 19.04 | $ 39,610 |
| Utah | 20,320 | 12.11 | 1.80 | $ 23.04 | $ 47,910 |
| Idaho | 9,590 | 11.66 | 1.74 | $ 21.28 | $ 44,260 |
| West Virginia | 7,580 | 11.01 | 1.64 | $ 19.87 | $ 41,330 |
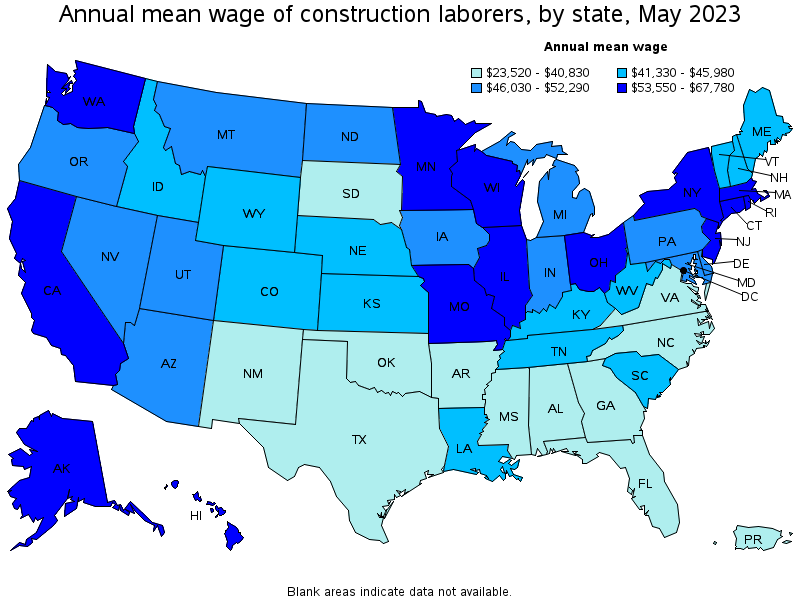
Top paying states for Construction Laborers:
| State | Employment (1) | Employment per thousand jobs | Location quotient (9) | Hourly mean wage | Annual mean wage (2) |
|---|---|---|---|---|---|
| Massachusetts | 18,280 | 5.02 | 0.75 | $ 32.59 | $ 67,780 |
| New Jersey | 20,230 | 4.82 | 0.72 | $ 32.35 | $ 67,280 |
| Illinois | 29,930 | 4.98 | 0.74 | $ 32.06 | $ 66,670 |
| Hawaii | 4,750 | 7.70 | 1.15 | $ 31.52 | $ 65,570 |
| New York | 49,080 | 5.23 | 0.78 | $ 30.69 | $ 63,830 |
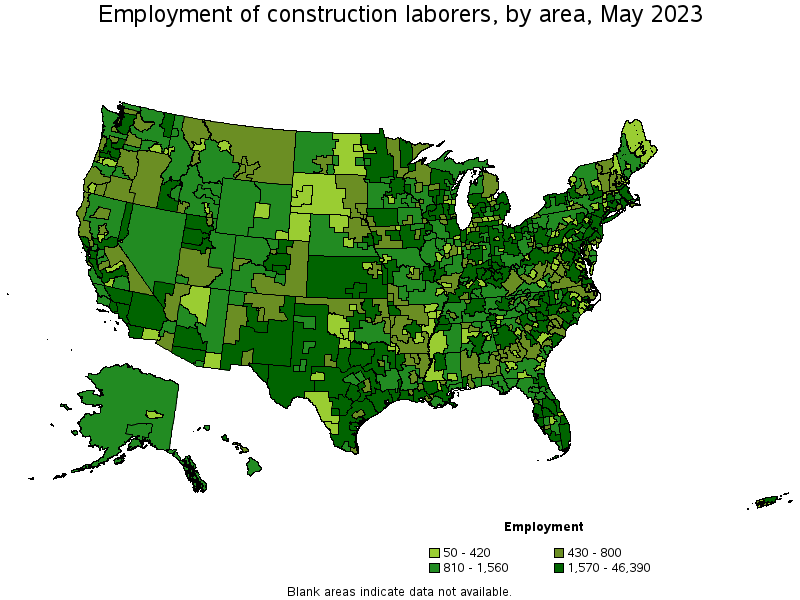
Metropolitan areas with the highest employment level in Construction Laborers:
| Metropolitan area | Employment (1) | Employment per thousand jobs | Location quotient (9) | Hourly mean wage | Annual mean wage (2) |
|---|---|---|---|---|---|
| New York-Newark-Jersey City, NY-NJ-PA | 46,390 | 4.89 | 0.73 | $ 32.80 | $ 68,210 |
| Houston-The Woodlands-Sugar Land, TX | 33,950 | 10.68 | 1.59 | $ 19.08 | $ 39,690 |
| Dallas-Fort Worth-Arlington, TX | 27,850 | 7.02 | 1.05 | $ 19.47 | $ 40,490 |
| Los Angeles-Long Beach-Anaheim, CA | 25,380 | 4.10 | 0.61 | $ 29.14 | $ 60,600 |
| Chicago-Naperville-Elgin, IL-IN-WI | 21,930 | 4.87 | 0.73 | $ 33.35 | $ 69,370 |
| Phoenix-Mesa-Scottsdale, AZ | 21,870 | 9.56 | 1.42 | $ 22.65 | $ 47,120 |
| Washington-Arlington-Alexandria, DC-VA-MD-WV | 18,660 | 6.03 | 0.90 | $ 22.18 | $ 46,130 |
| Seattle-Tacoma-Bellevue, WA | 15,010 | 7.22 | 1.08 | $ 30.65 | $ 63,760 |
| Philadelphia-Camden-Wilmington, PA-NJ-DE-MD | 14,490 | 5.12 | 0.76 | $ 27.82 | $ 57,870 |
| Minneapolis-St. Paul-Bloomington, MN-WI | 14,180 | 7.42 | 1.11 | $ 29.82 | $ 62,020 |
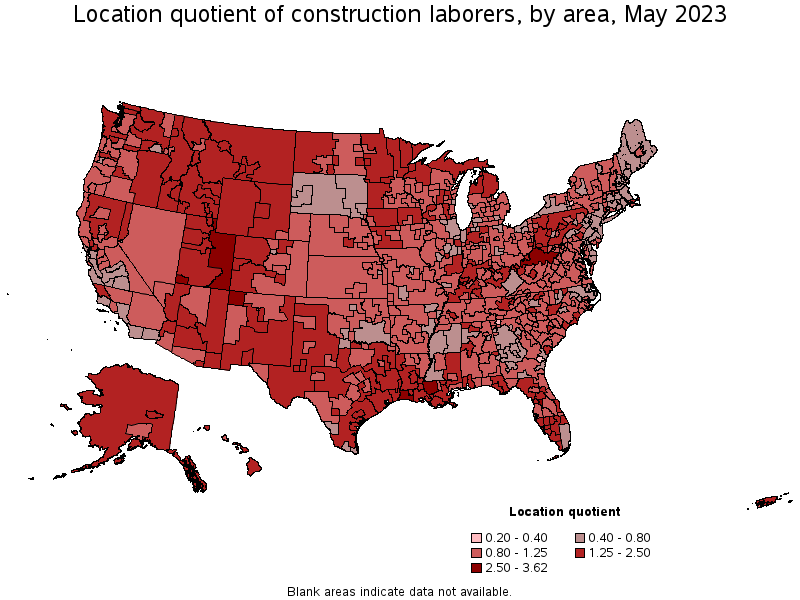
Metropolitan areas with the highest concentration of jobs and location quotients in Construction Laborers:
| Metropolitan area | Employment (1) | Employment per thousand jobs | Location quotient (9) | Hourly mean wage | Annual mean wage (2) |
|---|---|---|---|---|---|
| Lake Charles, LA | 2,210 | 24.27 | 3.62 | $ 22.92 | $ 47,680 |
| The Villages, FL | 840 | 22.16 | 3.30 | $ 19.58 | $ 40,730 |
| Farmington, NM | 980 | 21.54 | 3.21 | $ 18.30 | $ 38,070 |
| Baton Rouge, LA | 7,570 | 19.54 | 2.91 | $ 22.14 | $ 46,050 |
| St. George, UT | 1,500 | 17.98 | 2.68 | $ 21.46 | $ 44,630 |
| Prescott, AZ | 1,010 | 14.60 | 2.18 | $ 21.05 | $ 43,790 |
| Houma-Thibodaux, LA | 1,170 | 14.56 | 2.17 | $ 23.17 | $ 48,190 |
| Longview, TX | 1,410 | 14.55 | 2.17 | $ 17.34 | $ 36,060 |
| Decatur, IL | 670 | 14.55 | 2.17 | $ 25.35 | $ 52,720 |
| Greeley, CO | 1,570 | 14.14 | 2.11 | $ 21.53 | $ 44,780 |
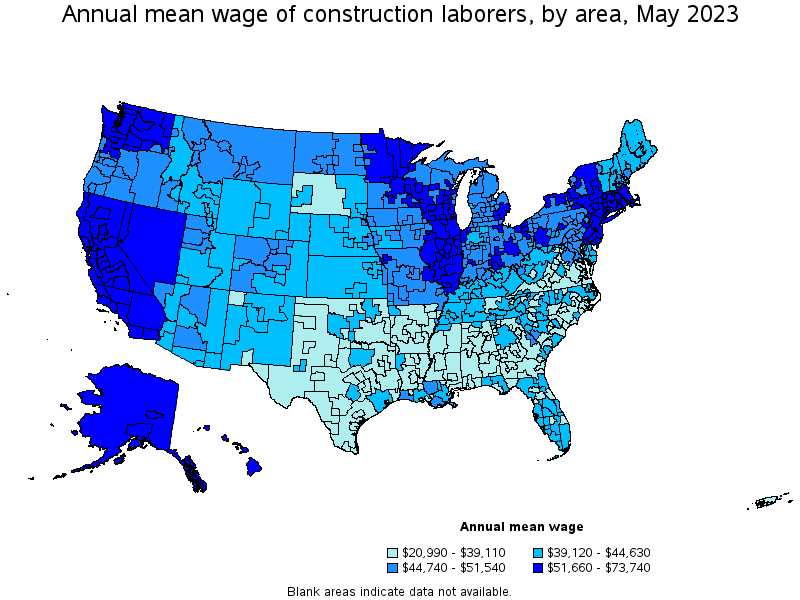
Top paying metropolitan areas for Construction Laborers:
| Metropolitan area | Employment (1) | Employment per thousand jobs | Location quotient (9) | Hourly mean wage | Annual mean wage (2) |
|---|---|---|---|---|---|
| Trenton, NJ | 950 | 3.96 | 0.59 | $ 35.45 | $ 73,740 |
| San Francisco-Oakland-Hayward, CA | 11,450 | 4.73 | 0.70 | $ 34.19 | $ 71,110 |
| Chicago-Naperville-Elgin, IL-IN-WI | 21,930 | 4.87 | 0.73 | $ 33.35 | $ 69,370 |
| Boston-Cambridge-Nashua, MA-NH | 12,690 | 4.59 | 0.68 | $ 33.26 | $ 69,180 |
| San Jose-Sunnyvale-Santa Clara, CA | 4,470 | 3.92 | 0.58 | $ 33.21 | $ 69,080 |
| New York-Newark-Jersey City, NY-NJ-PA | 46,390 | 4.89 | 0.73 | $ 32.80 | $ 68,210 |
| Atlantic City-Hammonton, NJ | 710 | 5.68 | 0.85 | $ 32.76 | $ 68,150 |
| Vineland-Bridgeton, NJ | 500 | 8.12 | 1.21 | $ 32.40 | $ 67,390 |
| Urban Honolulu, HI | 3,180 | 7.26 | 1.08 | $ 31.84 | $ 66,230 |
| Kahului-Wailuku-Lahaina, HI | 650 | 8.58 | 1.28 | $ 31.78 | $ 66,100 |
Nonmetropolitan areas with the highest employment in Construction Laborers:
| Nonmetropolitan area | Employment (1) | Employment per thousand jobs | Location quotient (9) | Hourly mean wage | Annual mean wage (2) |
|---|---|---|---|---|---|
| North Texas Region of Texas nonmetropolitan area | 3,290 | 11.83 | 1.76 | $ 17.82 | $ 37,060 |
| Hill Country Region of Texas nonmetropolitan area | 3,080 | 15.20 | 2.26 | $ 18.44 | $ 38,360 |
| North Northeastern Ohio nonmetropolitan area (noncontiguous) | 2,670 | 8.22 | 1.23 | $ 24.47 | $ 50,900 |
| West Texas Region of Texas nonmetropolitan area | 2,630 | 13.36 | 1.99 | $ 18.08 | $ 37,610 |
| Kansas nonmetropolitan area | 2,460 | 6.34 | 0.94 | $ 19.76 | $ 41,090 |
Nonmetropolitan areas with the highest concentration of jobs and location quotients in Construction Laborers:
| Nonmetropolitan area | Employment (1) | Employment per thousand jobs | Location quotient (9) | Hourly mean wage | Annual mean wage (2) |
|---|---|---|---|---|---|
| Eastern Utah nonmetropolitan area | 1,560 | 17.64 | 2.63 | $ 20.66 | $ 42,980 |
| Northern West Virginia nonmetropolitan area | 2,280 | 16.87 | 2.51 | $ 19.33 | $ 40,200 |
| Eastern New Mexico nonmetropolitan area | 2,450 | 15.46 | 2.30 | $ 19.01 | $ 39,530 |
| Hill Country Region of Texas nonmetropolitan area | 3,080 | 15.20 | 2.26 | $ 18.44 | $ 38,360 |
| Northwestern Idaho nonmetropolitan area | 1,070 | 14.64 | 2.18 | $ 20.87 | $ 43,420 |
Top paying nonmetropolitan areas for Construction Laborers:
| Nonmetropolitan area | Employment (1) | Employment per thousand jobs | Location quotient (9) | Hourly mean wage | Annual mean wage (2) |
|---|---|---|---|---|---|
| Northwest Illinois nonmetropolitan area | 1,010 | 7.85 | 1.17 | $ 31.22 | $ 64,940 |
| Hawaii / Kauai nonmetropolitan area | 910 | 9.00 | 1.34 | $ 30.22 | $ 62,860 |
| North Valley-Northern Mountains Region of California nonmetropolitan area | 910 | 8.93 | 1.33 | $ 28.92 | $ 60,150 |
| South Illinois nonmetropolitan area | 530 | 6.05 | 0.90 | $ 28.92 | $ 60,150 |
| North Coast Region of California nonmetropolitan area | 670 | 6.29 | 0.94 | $ 28.53 | $ 59,330 |
These estimates are calculated with data collected from employers in all industry sectors, all metropolitan and nonmetropolitan areas, and all states and the District of Columbia. The top employment and wage figures are provided above. The complete list is available in the downloadable XLS files.
The percentile wage estimate is the value of a wage below which a certain percent of workers fall. The median wage is the 50th percentile wage estimate—50 percent of workers earn less than the median and 50 percent of workers earn more than the median. More about percentile wages.
(1) Estimates for detailed occupations do not sum to the totals because the totals include occupations not shown separately. Estimates do not include self-employed workers.
(2) Annual wages have been calculated by multiplying the hourly mean wage by a "year-round, full-time" hours figure of 2,080 hours; for those occupations where there is not an hourly wage published, the annual wage has been directly calculated from the reported survey data.
(3) The relative standard error (RSE) is a measure of the reliability of a survey statistic. The smaller the relative standard error, the more precise the estimate.
(8) Estimate not released.
(9) The location quotient is the ratio of the area concentration of occupational employment to the national average concentration. A location quotient greater than one indicates the occupation has a higher share of employment than average, and a location quotient less than one indicates the occupation is less prevalent in the area than average.
Other OEWS estimates and related information:
May 2023 National Occupational Employment and Wage Estimates
May 2023 State Occupational Employment and Wage Estimates
May 2023 Metropolitan and Nonmetropolitan Area Occupational Employment and Wage Estimates
May 2023 National Industry-Specific Occupational Employment and Wage Estimates
Last Modified Date: April 3, 2024