
An official website of the United States government
An official website of the United States government
The .gov means it's official.
Federal government websites often end in .gov or .mil. Before sharing sensitive information,
make sure you're on a federal government site.
The site is secure.
The
https:// ensures that you are connecting to the official website and that any
information you provide is encrypted and transmitted securely.
Repair, adjust, or install all types of electric or gas household appliances, such as refrigerators, washers, dryers, and ovens.
Employment estimate and mean wage estimates for Home Appliance Repairers:
| Employment (1) | Employment RSE (3) |
Mean hourly wage |
Mean annual wage (2) |
Wage RSE (3) |
|---|---|---|---|---|
| 29,950 | 2.6 % | $ 24.35 | $ 50,640 | 1.7 % |
Percentile wage estimates for Home Appliance Repairers:
| Percentile | 10% | 25% | 50% (Median) |
75% | 90% |
|---|---|---|---|---|---|
| Hourly Wage | $ 14.95 | $ 18.11 | $ 22.68 | $ 28.48 | $ 34.93 |
| Annual Wage (2) | $ 31,100 | $ 37,660 | $ 47,170 | $ 59,240 | $ 72,660 |
Industries with the highest published employment and wages for Home Appliance Repairers are provided. For a list of all industries with employment in Home Appliance Repairers, see the Create Customized Tables function.
Industries with the highest levels of employment in Home Appliance Repairers:
| Industry | Employment (1) | Percent of industry employment | Hourly mean wage | Annual mean wage (2) |
|---|---|---|---|---|
| Personal and Household Goods Repair and Maintenance | 12,310 | 14.44 | $ 25.73 | $ 53,520 |
| Electronics and Appliance Retailers | 8,780 | 2.13 | $ 22.15 | $ 46,070 |
| Building Equipment Contractors | 1,400 | 0.06 | $ 26.18 | $ 54,450 |
| Commercial and Industrial Machinery and Equipment (except Automotive and Electronic) Repair and Maintenance | 580 | 0.25 | $ 27.21 | $ 56,600 |
| Machinery, Equipment, and Supplies Merchant Wholesalers | 520 | 0.07 | $ 29.04 | $ 60,390 |
Industries with the highest concentration of employment in Home Appliance Repairers:
| Industry | Employment (1) | Percent of industry employment | Hourly mean wage | Annual mean wage (2) |
|---|---|---|---|---|
| Personal and Household Goods Repair and Maintenance | 12,310 | 14.44 | $ 25.73 | $ 53,520 |
| Electronics and Appliance Retailers | 8,780 | 2.13 | $ 22.15 | $ 46,070 |
| Electronic and Precision Equipment Repair and Maintenance | 340 | 0.33 | $ 20.07 | $ 41,740 |
| Fuel Dealers | 220 | 0.31 | $ 24.18 | $ 50,290 |
| Commercial and Industrial Machinery and Equipment (except Automotive and Electronic) Repair and Maintenance | 580 | 0.25 | $ 27.21 | $ 56,600 |
Top paying industries for Home Appliance Repairers:
| Industry | Employment (1) | Percent of industry employment | Hourly mean wage | Annual mean wage (2) |
|---|---|---|---|---|
| Natural Gas Distribution | (8) | (8) | $ 43.01 | $ 89,460 |
| Management of Companies and Enterprises | 80 | (7) | $ 31.87 | $ 66,300 |
| Machinery, Equipment, and Supplies Merchant Wholesalers | 520 | 0.07 | $ 29.04 | $ 60,390 |
| Facilities Support Services | 50 | 0.03 | $ 28.98 | $ 60,270 |
| Real Estate | 150 | 0.01 | $ 28.08 | $ 58,410 |
States and areas with the highest published employment, location quotients, and wages for Home Appliance Repairers are provided. For a list of all areas with employment in Home Appliance Repairers, see the Create Customized Tables function.
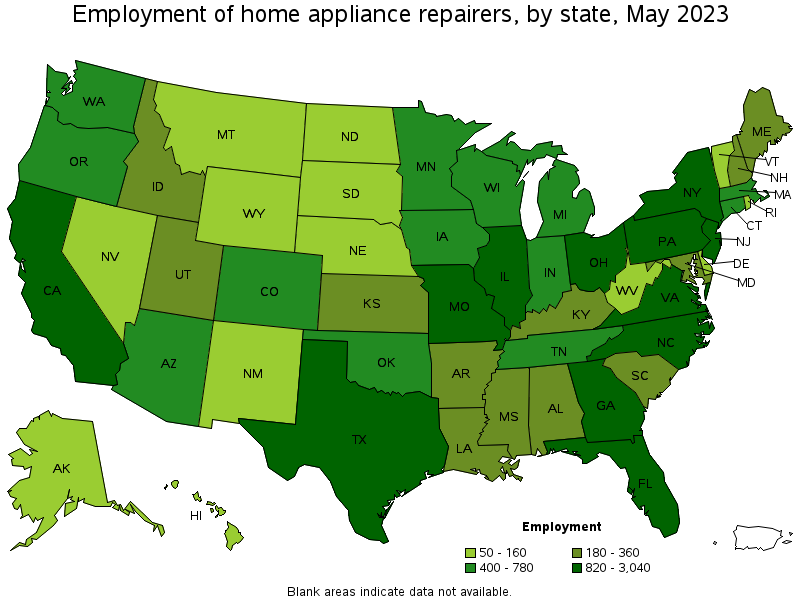
States with the highest employment level in Home Appliance Repairers:
| State | Employment (1) | Employment per thousand jobs | Location quotient (9) | Hourly mean wage | Annual mean wage (2) |
|---|---|---|---|---|---|
| Florida | 3,040 | 0.32 | 1.61 | $ 22.92 | $ 47,670 |
| California | 2,450 | 0.14 | 0.69 | $ 24.28 | $ 50,500 |
| Texas | 2,160 | 0.16 | 0.81 | $ 24.73 | $ 51,440 |
| Illinois | 1,470 | 0.25 | 1.24 | $ 22.76 | $ 47,330 |
| New Jersey | 1,310 | 0.31 | 1.59 | $ 28.91 | $ 60,140 |
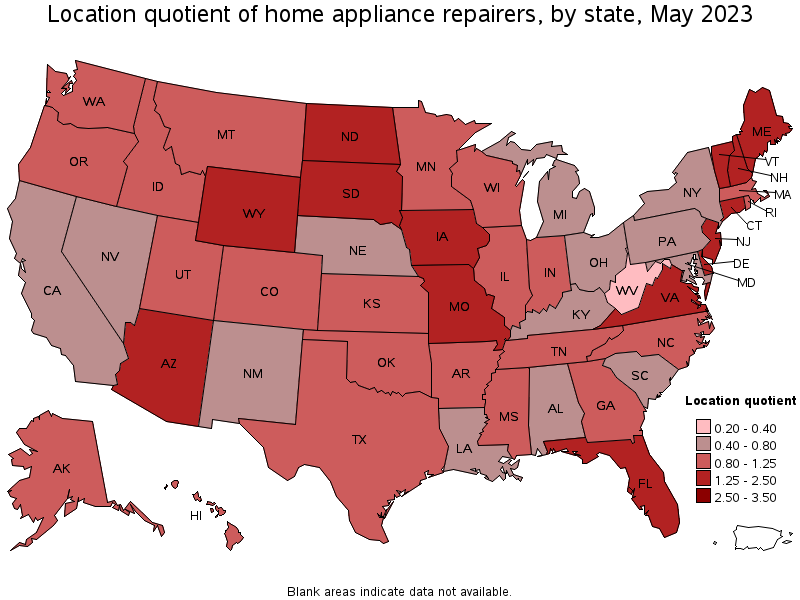
States with the highest concentration of jobs and location quotients in Home Appliance Repairers:
| State | Employment (1) | Employment per thousand jobs | Location quotient (9) | Hourly mean wage | Annual mean wage (2) |
|---|---|---|---|---|---|
| Connecticut | 710 | 0.43 | 2.16 | $ 24.32 | $ 50,580 |
| North Dakota | 160 | 0.39 | 2.00 | $ 22.64 | $ 47,080 |
| Wyoming | 100 | 0.38 | 1.90 | $ 22.21 | $ 46,190 |
| Iowa | 550 | 0.35 | 1.80 | $ 22.69 | $ 47,200 |
| South Dakota | 160 | 0.35 | 1.79 | $ 18.54 | $ 38,550 |
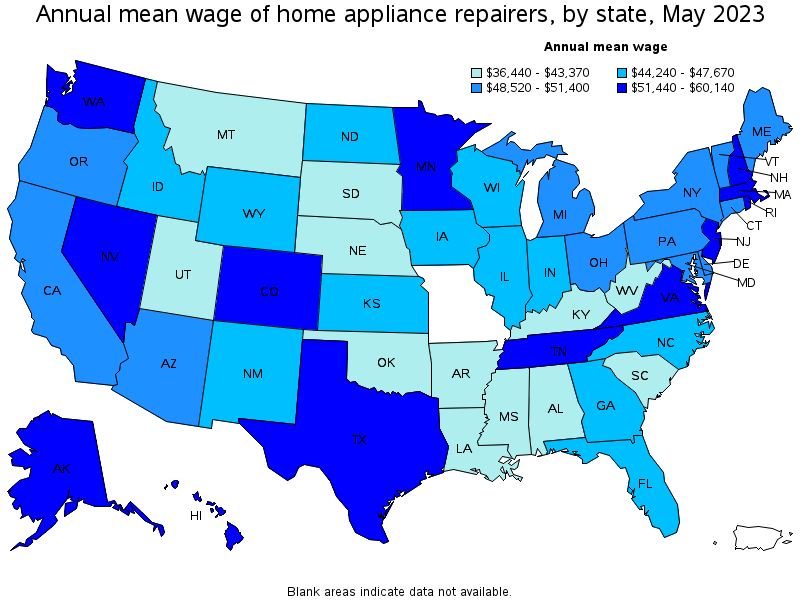
Top paying states for Home Appliance Repairers:
| State | Employment (1) | Employment per thousand jobs | Location quotient (9) | Hourly mean wage | Annual mean wage (2) |
|---|---|---|---|---|---|
| New Jersey | 1,310 | 0.31 | 1.59 | $ 28.91 | $ 60,140 |
| Hawaii | 120 | 0.20 | 1.02 | $ 28.20 | $ 58,650 |
| Minnesota | 620 | 0.22 | 1.10 | $ 27.60 | $ 57,420 |
| Massachusetts | 660 | 0.18 | 0.91 | $ 27.27 | $ 56,730 |
| Washington | 760 | 0.22 | 1.10 | $ 27.05 | $ 56,260 |
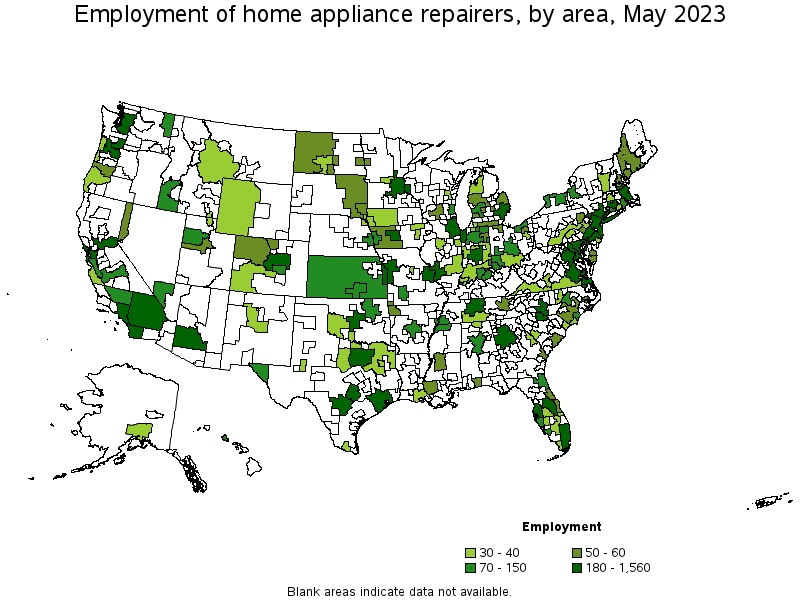
Metropolitan areas with the highest employment level in Home Appliance Repairers:
| Metropolitan area | Employment (1) | Employment per thousand jobs | Location quotient (9) | Hourly mean wage | Annual mean wage (2) |
|---|---|---|---|---|---|
| New York-Newark-Jersey City, NY-NJ-PA | 1,560 | 0.16 | 0.83 | $ 27.96 | $ 58,160 |
| Chicago-Naperville-Elgin, IL-IN-WI | 1,190 | 0.26 | 1.34 | $ 22.76 | $ 47,340 |
| Miami-Fort Lauderdale-West Palm Beach, FL | 1,180 | 0.43 | 2.20 | $ 22.87 | $ 47,570 |
| Dallas-Fort Worth-Arlington, TX | 930 | 0.24 | 1.19 | $ 27.12 | $ 56,410 |
| Los Angeles-Long Beach-Anaheim, CA | 720 | 0.12 | 0.59 | $ 23.80 | $ 49,500 |
| Atlanta-Sandy Springs-Roswell, GA | 700 | 0.25 | 1.27 | $ 22.56 | $ 46,910 |
| Boston-Cambridge-Nashua, MA-NH | 560 | 0.20 | 1.03 | $ 27.39 | $ 56,980 |
| Phoenix-Mesa-Scottsdale, AZ | 560 | 0.24 | 1.23 | $ 25.11 | $ 52,220 |
| Tampa-St. Petersburg-Clearwater, FL | 530 | 0.38 | 1.92 | $ 23.35 | $ 48,570 |
| Minneapolis-St. Paul-Bloomington, MN-WI | 470 | 0.24 | 1.23 | $ 28.51 | $ 59,290 |
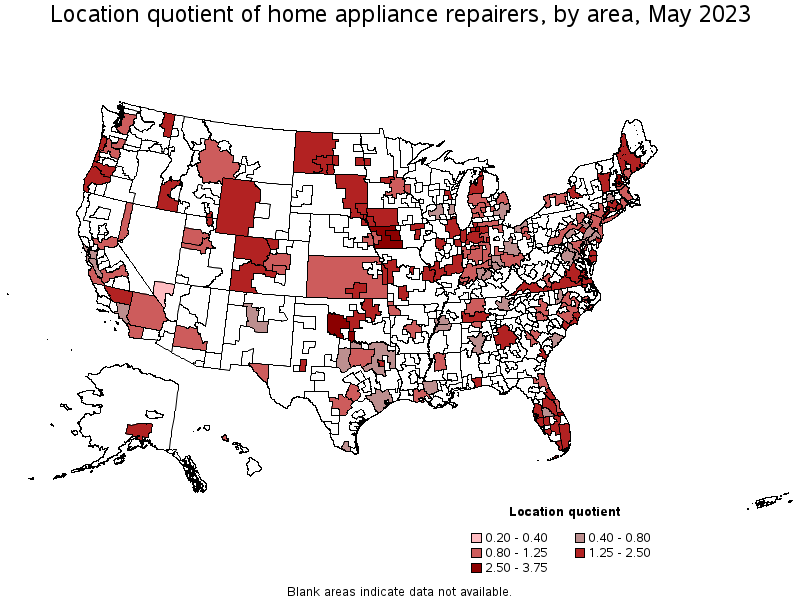
Metropolitan areas with the highest concentration of jobs and location quotients in Home Appliance Repairers:
| Metropolitan area | Employment (1) | Employment per thousand jobs | Location quotient (9) | Hourly mean wage | Annual mean wage (2) |
|---|---|---|---|---|---|
| Sebastian-Vero Beach, FL | 40 | 0.74 | 3.75 | $ 21.91 | $ 45,570 |
| Elkhart-Goshen, IN | 100 | 0.71 | 3.62 | $ 16.30 | $ 33,900 |
| Des Moines-West Des Moines, IA | 240 | 0.62 | 3.16 | $ 24.93 | $ 51,850 |
| Waterbury, CT | 40 | 0.56 | 2.84 | $ 22.24 | $ 46,260 |
| Bridgeport-Stamford-Norwalk, CT | 220 | 0.56 | 2.83 | $ 26.45 | $ 55,010 |
| Wilmington, NC | 70 | 0.46 | 2.35 | $ 23.44 | $ 48,760 |
| Logan, UT-ID | 30 | 0.46 | 2.31 | $ 18.67 | $ 38,840 |
| Spokane-Spokane Valley, WA | 110 | 0.43 | 2.20 | $ 23.69 | $ 49,270 |
| Miami-Fort Lauderdale-West Palm Beach, FL | 1,180 | 0.43 | 2.20 | $ 22.87 | $ 47,570 |
| Bismarck, ND | 30 | 0.43 | 2.16 | $ 19.95 | $ 41,500 |
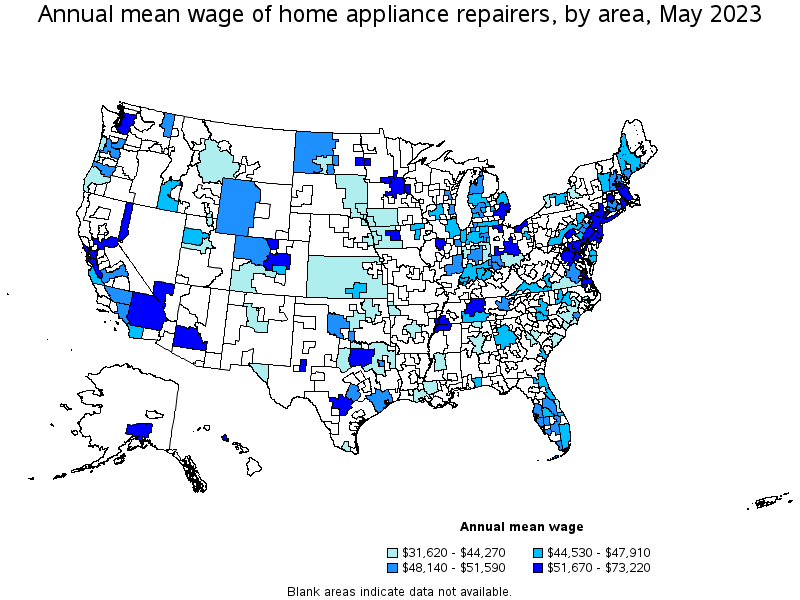
Top paying metropolitan areas for Home Appliance Repairers:
| Metropolitan area | Employment (1) | Employment per thousand jobs | Location quotient (9) | Hourly mean wage | Annual mean wage (2) |
|---|---|---|---|---|---|
| Atlantic City-Hammonton, NJ | 40 | 0.34 | 1.74 | $ 35.20 | $ 73,220 |
| Minneapolis-St. Paul-Bloomington, MN-WI | 470 | 0.24 | 1.23 | $ 28.51 | $ 59,290 |
| Seattle-Tacoma-Bellevue, WA | 450 | 0.22 | 1.10 | $ 28.46 | $ 59,190 |
| Harrisburg-Carlisle, PA | 30 | 0.10 | 0.48 | $ 28.20 | $ 58,660 |
| Denver-Aurora-Lakewood, CO | 340 | 0.22 | 1.09 | $ 28.02 | $ 58,270 |
| New York-Newark-Jersey City, NY-NJ-PA | 1,560 | 0.16 | 0.83 | $ 27.96 | $ 58,160 |
| Nashville-Davidson--Murfreesboro--Franklin, TN | 250 | 0.23 | 1.17 | $ 27.95 | $ 58,140 |
| San Francisco-Oakland-Hayward, CA | 280 | 0.12 | 0.59 | $ 27.76 | $ 57,740 |
| Urban Honolulu, HI | 100 | 0.22 | 1.12 | $ 27.61 | $ 57,420 |
| Boston-Cambridge-Nashua, MA-NH | 560 | 0.20 | 1.03 | $ 27.39 | $ 56,980 |
Nonmetropolitan areas with the highest employment in Home Appliance Repairers:
| Nonmetropolitan area | Employment (1) | Employment per thousand jobs | Location quotient (9) | Hourly mean wage | Annual mean wage (2) |
|---|---|---|---|---|---|
| Northern Indiana nonmetropolitan area | 90 | 0.44 | 2.23 | $ 21.81 | $ 45,350 |
| Kansas nonmetropolitan area | 70 | 0.18 | 0.93 | $ 19.96 | $ 41,510 |
| West North Dakota nonmetropolitan area | 50 | 0.48 | 2.41 | $ 24.13 | $ 50,190 |
| Southwest Maine nonmetropolitan area | 50 | 0.27 | 1.36 | $ 22.22 | $ 46,220 |
| East South Dakota nonmetropolitan area | 50 | 0.38 | 1.93 | $ 15.82 | $ 32,910 |
Nonmetropolitan areas with the highest concentration of jobs and location quotients in Home Appliance Repairers:
| Nonmetropolitan area | Employment (1) | Employment per thousand jobs | Location quotient (9) | Hourly mean wage | Annual mean wage (2) |
|---|---|---|---|---|---|
| Southwest Oklahoma nonmetropolitan area | 40 | 0.61 | 3.11 | $ 24.21 | $ 50,370 |
| Southwest Iowa nonmetropolitan area | 50 | 0.55 | 2.79 | $ 17.19 | $ 35,760 |
| Central New Hampshire nonmetropolitan area | 50 | 0.53 | 2.69 | $ 23.84 | $ 49,580 |
| West North Dakota nonmetropolitan area | 50 | 0.48 | 2.41 | $ 24.13 | $ 50,190 |
| South Florida nonmetropolitan area | 40 | 0.46 | 2.34 | $ 23.16 | $ 48,160 |
Top paying nonmetropolitan areas for Home Appliance Repairers:
| Nonmetropolitan area | Employment (1) | Employment per thousand jobs | Location quotient (9) | Hourly mean wage | Annual mean wage (2) |
|---|---|---|---|---|---|
| Northwest Colorado nonmetropolitan area | 50 | 0.37 | 1.87 | $ 24.81 | $ 51,590 |
| West Central-Southwest New Hampshire nonmetropolitan area | (8) | (8) | (8) | $ 24.49 | $ 50,930 |
| Southwest Oklahoma nonmetropolitan area | 40 | 0.61 | 3.11 | $ 24.21 | $ 50,370 |
| West North Dakota nonmetropolitan area | 50 | 0.48 | 2.41 | $ 24.13 | $ 50,190 |
| Northwest Lower Peninsula of Michigan nonmetropolitan area | 40 | 0.29 | 1.47 | $ 23.95 | $ 49,820 |
These estimates are calculated with data collected from employers in all industry sectors, all metropolitan and nonmetropolitan areas, and all states and the District of Columbia. The top employment and wage figures are provided above. The complete list is available in the downloadable XLS files.
The percentile wage estimate is the value of a wage below which a certain percent of workers fall. The median wage is the 50th percentile wage estimate—50 percent of workers earn less than the median and 50 percent of workers earn more than the median. More about percentile wages.
(1) Estimates for detailed occupations do not sum to the totals because the totals include occupations not shown separately. Estimates do not include self-employed workers.
(2) Annual wages have been calculated by multiplying the hourly mean wage by a "year-round, full-time" hours figure of 2,080 hours; for those occupations where there is not an hourly wage published, the annual wage has been directly calculated from the reported survey data.
(3) The relative standard error (RSE) is a measure of the reliability of a survey statistic. The smaller the relative standard error, the more precise the estimate.
(7) The value is less than .005 percent of industry employment.
(8) Estimate not released.
(9) The location quotient is the ratio of the area concentration of occupational employment to the national average concentration. A location quotient greater than one indicates the occupation has a higher share of employment than average, and a location quotient less than one indicates the occupation is less prevalent in the area than average.
Other OEWS estimates and related information:
May 2023 National Occupational Employment and Wage Estimates
May 2023 State Occupational Employment and Wage Estimates
May 2023 Metropolitan and Nonmetropolitan Area Occupational Employment and Wage Estimates
May 2023 National Industry-Specific Occupational Employment and Wage Estimates
Last Modified Date: April 3, 2024