
An official website of the United States government
An official website of the United States government
The .gov means it's official.
Federal government websites often end in .gov or .mil. Before sharing sensitive information,
make sure you're on a federal government site.
The site is secure.
The
https:// ensures that you are connecting to the official website and that any
information you provide is encrypted and transmitted securely.
Cut, trim, or prepare consumer-sized portions of meat for use or sale in retail establishments.
Employment estimate and mean wage estimates for Butchers and Meat Cutters:
| Employment (1) | Employment RSE (3) |
Mean hourly wage |
Mean annual wage (2) |
Wage RSE (3) |
|---|---|---|---|---|
| 136,330 | 1.3 % | $ 19.08 | $ 39,680 | 0.4 % |
Percentile wage estimates for Butchers and Meat Cutters:
| Percentile | 10% | 25% | 50% (Median) |
75% | 90% |
|---|---|---|---|---|---|
| Hourly Wage | $ 13.22 | $ 15.50 | $ 18.10 | $ 22.12 | $ 26.25 |
| Annual Wage (2) | $ 27,500 | $ 32,240 | $ 37,650 | $ 46,020 | $ 54,600 |
Industries with the highest published employment and wages for Butchers and Meat Cutters are provided. For a list of all industries with employment in Butchers and Meat Cutters, see the Create Customized Tables function.
Industries with the highest levels of employment in Butchers and Meat Cutters:
| Industry | Employment (1) | Percent of industry employment | Hourly mean wage | Annual mean wage (2) |
|---|---|---|---|---|
| Food and Beverage Retailers (4451 and 4452 only) | 100,880 | 3.32 | $ 18.55 | $ 38,580 |
| General Merchandise Retailers | 13,950 | 0.43 | $ 22.08 | $ 45,930 |
| Animal Slaughtering and Processing | 11,770 | 2.17 | $ 19.43 | $ 40,420 |
| Merchant Wholesalers, Nondurable Goods (4244 and 4248 only) | 4,550 | 0.45 | $ 19.40 | $ 40,360 |
| Restaurants and Other Eating Places | 2,570 | 0.02 | $ 17.92 | $ 37,280 |
Industries with the highest concentration of employment in Butchers and Meat Cutters:
| Industry | Employment (1) | Percent of industry employment | Hourly mean wage | Annual mean wage (2) |
|---|---|---|---|---|
| Food and Beverage Retailers (4451 and 4452 only) | 100,880 | 3.32 | $ 18.55 | $ 38,580 |
| Animal Slaughtering and Processing | 11,770 | 2.17 | $ 19.43 | $ 40,420 |
| Merchant Wholesalers, Nondurable Goods (4244 and 4248 only) | 4,550 | 0.45 | $ 19.40 | $ 40,360 |
| General Merchandise Retailers | 13,950 | 0.43 | $ 22.08 | $ 45,930 |
| Animal Food Manufacturing | 110 | 0.15 | $ 17.75 | $ 36,930 |
Top paying industries for Butchers and Meat Cutters:
| Industry | Employment (1) | Percent of industry employment | Hourly mean wage | Annual mean wage (2) |
|---|---|---|---|---|
| Federal, State, and Local Government, excluding State and Local Government Schools and Hospitals and the U.S. Postal Service (OEWS Designation) | 1,110 | 0.05 | $ 26.17 | $ 54,430 |
| Traveler Accommodation | 230 | 0.01 | $ 25.74 | $ 53,530 |
| Management of Companies and Enterprises | 130 | (7) | $ 24.29 | $ 50,530 |
| General Merchandise Retailers | 13,950 | 0.43 | $ 22.08 | $ 45,930 |
| Warehousing and Storage | 160 | 0.01 | $ 20.55 | $ 42,740 |
States and areas with the highest published employment, location quotients, and wages for Butchers and Meat Cutters are provided. For a list of all areas with employment in Butchers and Meat Cutters, see the Create Customized Tables function.
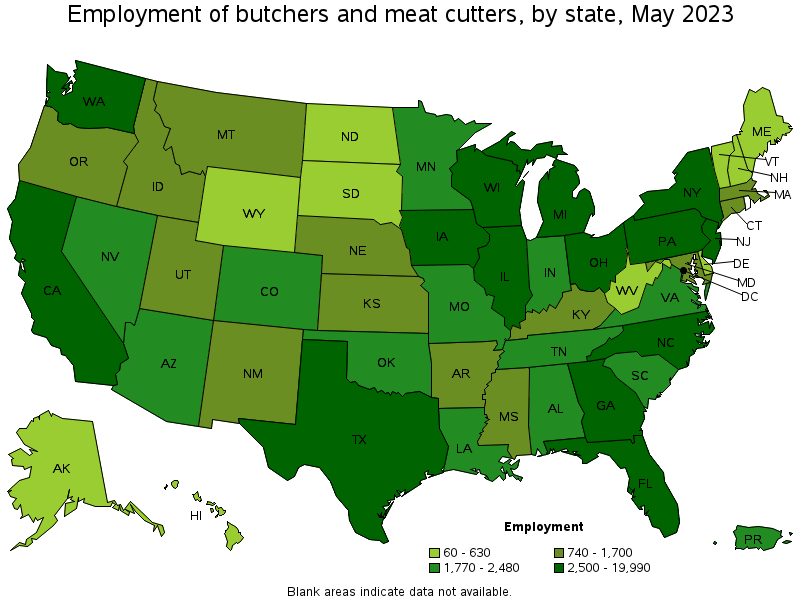
States with the highest employment level in Butchers and Meat Cutters:
| State | Employment (1) | Employment per thousand jobs | Location quotient (9) | Hourly mean wage | Annual mean wage (2) |
|---|---|---|---|---|---|
| California | 19,990 | 1.11 | 1.24 | $ 20.65 | $ 42,940 |
| Texas | 10,780 | 0.80 | 0.89 | $ 17.66 | $ 36,740 |
| Florida | 10,440 | 1.09 | 1.22 | $ 18.85 | $ 39,210 |
| Illinois | 9,110 | 1.52 | 1.69 | $ 18.58 | $ 38,650 |
| New York | 5,730 | 0.61 | 0.68 | $ 22.09 | $ 45,940 |
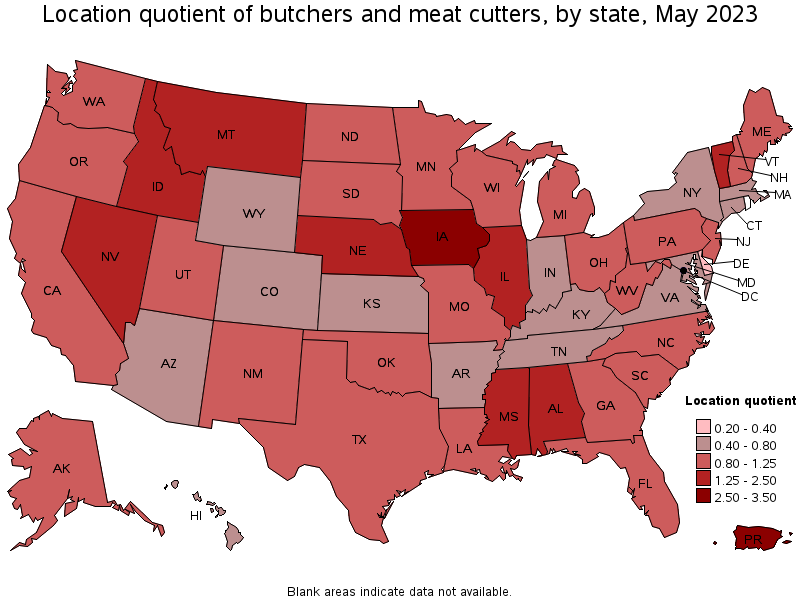
States with the highest concentration of jobs and location quotients in Butchers and Meat Cutters:
| State | Employment (1) | Employment per thousand jobs | Location quotient (9) | Hourly mean wage | Annual mean wage (2) |
|---|---|---|---|---|---|
| Iowa | 3,560 | 2.30 | 2.56 | $ 16.56 | $ 34,440 |
| Montana | 840 | 1.67 | 1.86 | $ 18.97 | $ 39,460 |
| Illinois | 9,110 | 1.52 | 1.69 | $ 18.58 | $ 38,650 |
| Vermont | 420 | 1.39 | 1.55 | $ 20.19 | $ 42,000 |
| Nevada | 1,930 | 1.30 | 1.45 | $ 18.02 | $ 37,480 |
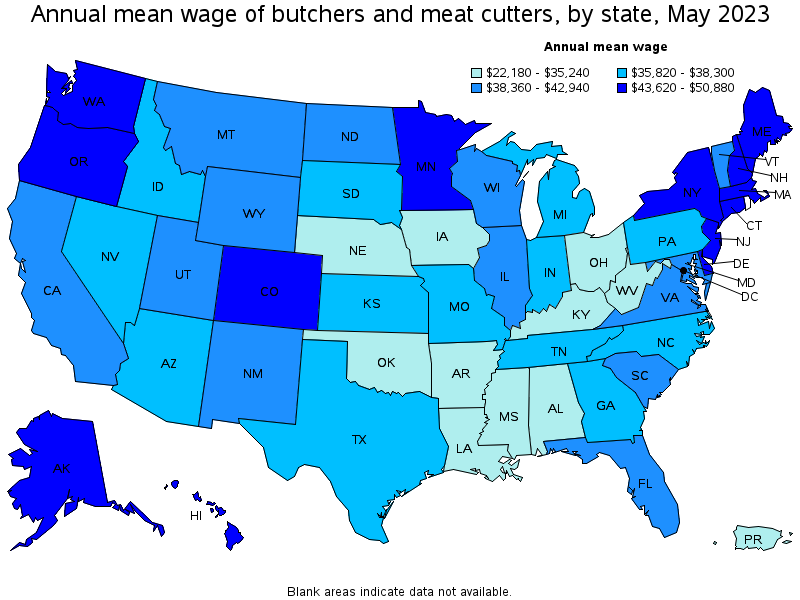
Top paying states for Butchers and Meat Cutters:
| State | Employment (1) | Employment per thousand jobs | Location quotient (9) | Hourly mean wage | Annual mean wage (2) |
|---|---|---|---|---|---|
| Hawaii | 390 | 0.64 | 0.71 | $ 24.46 | $ 50,880 |
| New Jersey | 3,780 | 0.90 | 1.00 | $ 23.91 | $ 49,730 |
| Massachusetts | 1,700 | 0.47 | 0.52 | $ 23.90 | $ 49,710 |
| Washington | 2,500 | 0.72 | 0.80 | $ 23.58 | $ 49,050 |
| Delaware | 150 | 0.32 | 0.36 | $ 23.25 | $ 48,350 |
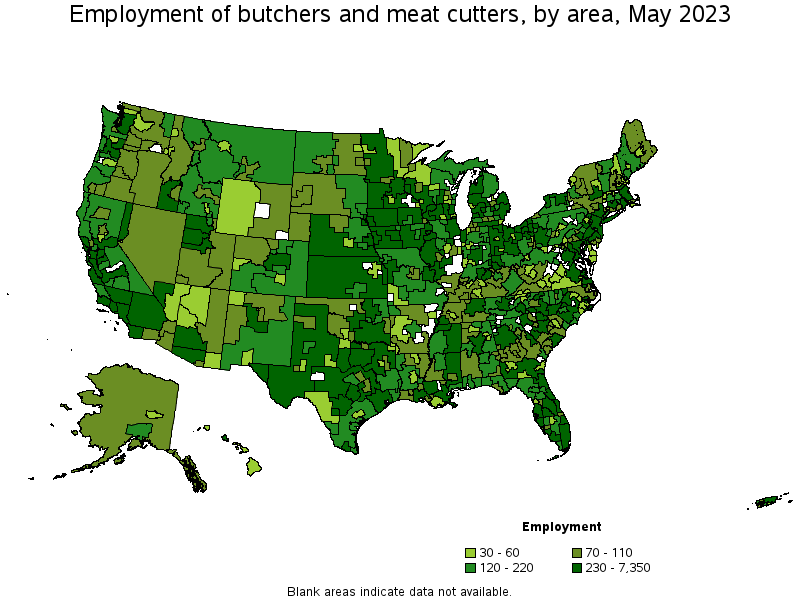
Metropolitan areas with the highest employment level in Butchers and Meat Cutters:
| Metropolitan area | Employment (1) | Employment per thousand jobs | Location quotient (9) | Hourly mean wage | Annual mean wage (2) |
|---|---|---|---|---|---|
| Chicago-Naperville-Elgin, IL-IN-WI | 7,350 | 1.63 | 1.82 | $ 18.78 | $ 39,070 |
| Los Angeles-Long Beach-Anaheim, CA | 6,770 | 1.09 | 1.22 | $ 20.09 | $ 41,780 |
| New York-Newark-Jersey City, NY-NJ-PA | 6,470 | 0.68 | 0.76 | $ 23.87 | $ 49,660 |
| San Francisco-Oakland-Hayward, CA | 3,030 | 1.25 | 1.40 | $ 21.80 | $ 45,330 |
| Miami-Fort Lauderdale-West Palm Beach, FL | 2,970 | 1.09 | 1.22 | $ 18.24 | $ 37,940 |
| Dallas-Fort Worth-Arlington, TX | 2,720 | 0.69 | 0.76 | $ 17.32 | $ 36,020 |
| Houston-The Woodlands-Sugar Land, TX | 2,640 | 0.83 | 0.92 | $ 18.19 | $ 37,830 |
| Philadelphia-Camden-Wilmington, PA-NJ-DE-MD | 2,210 | 0.78 | 0.87 | $ 20.16 | $ 41,940 |
| Atlanta-Sandy Springs-Roswell, GA | 1,870 | 0.66 | 0.74 | $ 17.91 | $ 37,240 |
| Riverside-San Bernardino-Ontario, CA | 1,840 | 1.11 | 1.24 | $ 19.75 | $ 41,070 |
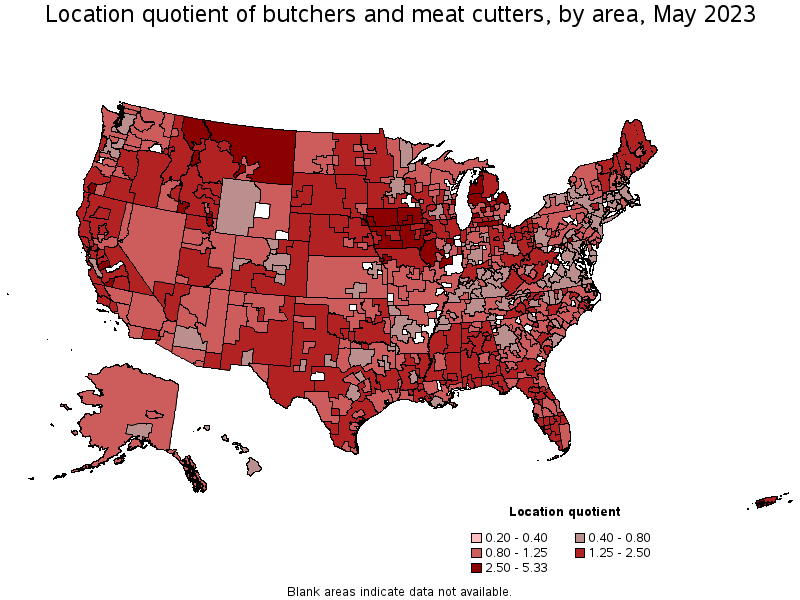
Metropolitan areas with the highest concentration of jobs and location quotients in Butchers and Meat Cutters:
| Metropolitan area | Employment (1) | Employment per thousand jobs | Location quotient (9) | Hourly mean wage | Annual mean wage (2) |
|---|---|---|---|---|---|
| Hanford-Corcoran, CA | 220 | 4.78 | 5.33 | $ 19.47 | $ 40,500 |
| Sheboygan, WI | 200 | 3.39 | 3.78 | $ 18.26 | $ 37,980 |
| Sioux City, IA-NE-SD | 270 | 3.09 | 3.44 | $ 16.72 | $ 34,770 |
| Logan, UT-ID | 200 | 3.04 | 3.39 | $ 21.37 | $ 44,460 |
| Twin Falls, ID | 140 | 2.93 | 3.27 | $ 17.25 | $ 35,890 |
| Grants Pass, OR | 80 | 2.79 | 3.10 | $ 18.09 | $ 37,620 |
| Ames, IA | 130 | 2.70 | 3.01 | $ 16.57 | $ 34,470 |
| Merced, CA | 200 | 2.62 | 2.92 | $ 19.18 | $ 39,890 |
| St. Joseph, MO-KS | 130 | 2.47 | 2.75 | $ 20.38 | $ 42,390 |
| Waterloo-Cedar Falls, IA | 190 | 2.25 | 2.51 | $ 16.73 | $ 34,800 |
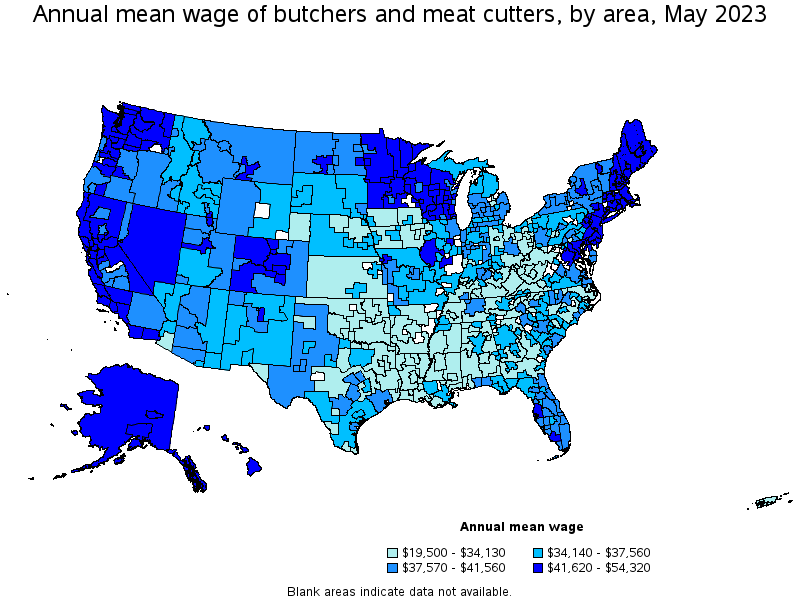
Top paying metropolitan areas for Butchers and Meat Cutters:
| Metropolitan area | Employment (1) | Employment per thousand jobs | Location quotient (9) | Hourly mean wage | Annual mean wage (2) |
|---|---|---|---|---|---|
| Fairbanks, AK | 40 | 1.03 | 1.14 | $ 26.11 | $ 54,320 |
| Kahului-Wailuku-Lahaina, HI | 50 | 0.60 | 0.67 | $ 25.90 | $ 53,880 |
| Seattle-Tacoma-Bellevue, WA | 1,270 | 0.61 | 0.68 | $ 24.73 | $ 51,430 |
| Urban Honolulu, HI | 280 | 0.65 | 0.72 | $ 24.53 | $ 51,020 |
| Boston-Cambridge-Nashua, MA-NH | 1,320 | 0.48 | 0.53 | $ 24.43 | $ 50,820 |
| New Bedford, MA | 40 | 0.61 | 0.68 | $ 24.35 | $ 50,660 |
| Bremerton-Silverdale, WA | 100 | 1.08 | 1.21 | $ 24.34 | $ 50,620 |
| Anchorage, AK | 120 | 0.70 | 0.78 | $ 23.92 | $ 49,750 |
| New York-Newark-Jersey City, NY-NJ-PA | 6,470 | 0.68 | 0.76 | $ 23.87 | $ 49,660 |
| San Jose-Sunnyvale-Santa Clara, CA | 810 | 0.71 | 0.79 | $ 23.76 | $ 49,410 |
Nonmetropolitan areas with the highest employment in Butchers and Meat Cutters:
| Nonmetropolitan area | Employment (1) | Employment per thousand jobs | Location quotient (9) | Hourly mean wage | Annual mean wage (2) |
|---|---|---|---|---|---|
| North Northeastern Ohio nonmetropolitan area (noncontiguous) | 670 | 2.06 | 2.30 | $ 15.89 | $ 33,050 |
| Balance of Lower Peninsula of Michigan nonmetropolitan area | 630 | 2.41 | 2.68 | $ 19.58 | $ 40,720 |
| Southeast Iowa nonmetropolitan area | 510 | 2.42 | 2.70 | $ 15.92 | $ 33,100 |
| West Central Illinois nonmetropolitan area | 490 | 3.05 | 3.40 | $ 20.97 | $ 43,610 |
| West Texas Region of Texas nonmetropolitan area | 440 | 2.23 | 2.48 | $ 18.64 | $ 38,770 |
Nonmetropolitan areas with the highest concentration of jobs and location quotients in Butchers and Meat Cutters:
| Nonmetropolitan area | Employment (1) | Employment per thousand jobs | Location quotient (9) | Hourly mean wage | Annual mean wage (2) |
|---|---|---|---|---|---|
| Southwest Iowa nonmetropolitan area | 340 | 4.09 | 4.56 | $ 16.31 | $ 33,920 |
| West Central Illinois nonmetropolitan area | 490 | 3.05 | 3.40 | $ 20.97 | $ 43,610 |
| Northwest Iowa nonmetropolitan area | 400 | 3.01 | 3.35 | $ 15.98 | $ 33,230 |
| East-Central Montana nonmetropolitan area | 190 | 2.96 | 3.30 | $ 18.24 | $ 37,940 |
| Northeast Iowa nonmetropolitan area | 240 | 2.46 | 2.74 | $ 15.89 | $ 33,050 |
Top paying nonmetropolitan areas for Butchers and Meat Cutters:
| Nonmetropolitan area | Employment (1) | Employment per thousand jobs | Location quotient (9) | Hourly mean wage | Annual mean wage (2) |
|---|---|---|---|---|---|
| Hawaii / Kauai nonmetropolitan area | 60 | 0.61 | 0.68 | $ 23.13 | $ 48,120 |
| Western Washington nonmetropolitan area | 130 | 1.03 | 1.15 | $ 22.96 | $ 47,760 |
| Northwest Colorado nonmetropolitan area | 110 | 0.89 | 0.99 | $ 22.10 | $ 45,960 |
| Massachusetts nonmetropolitan area | 40 | 0.61 | 0.68 | $ 21.93 | $ 45,620 |
| Central New Hampshire nonmetropolitan area | 70 | 0.80 | 0.90 | $ 21.45 | $ 44,610 |
These estimates are calculated with data collected from employers in all industry sectors, all metropolitan and nonmetropolitan areas, and all states and the District of Columbia. The top employment and wage figures are provided above. The complete list is available in the downloadable XLS files.
The percentile wage estimate is the value of a wage below which a certain percent of workers fall. The median wage is the 50th percentile wage estimate—50 percent of workers earn less than the median and 50 percent of workers earn more than the median. More about percentile wages.
(1) Estimates for detailed occupations do not sum to the totals because the totals include occupations not shown separately. Estimates do not include self-employed workers.
(2) Annual wages have been calculated by multiplying the hourly mean wage by a "year-round, full-time" hours figure of 2,080 hours; for those occupations where there is not an hourly wage published, the annual wage has been directly calculated from the reported survey data.
(3) The relative standard error (RSE) is a measure of the reliability of a survey statistic. The smaller the relative standard error, the more precise the estimate.
(7) The value is less than .005 percent of industry employment.
(9) The location quotient is the ratio of the area concentration of occupational employment to the national average concentration. A location quotient greater than one indicates the occupation has a higher share of employment than average, and a location quotient less than one indicates the occupation is less prevalent in the area than average.
Other OEWS estimates and related information:
May 2023 National Occupational Employment and Wage Estimates
May 2023 State Occupational Employment and Wage Estimates
May 2023 Metropolitan and Nonmetropolitan Area Occupational Employment and Wage Estimates
May 2023 National Industry-Specific Occupational Employment and Wage Estimates
Last Modified Date: April 3, 2024