
An official website of the United States government
An official website of the United States government
The .gov means it's official.
Federal government websites often end in .gov or .mil. Before sharing sensitive information,
make sure you're on a federal government site.
The site is secure.
The
https:// ensures that you are connecting to the official website and that any
information you provide is encrypted and transmitted securely.
Provide services to ensure the safety of passengers aboard ships, buses, trains, or within the station or terminal. Perform duties such as explaining the use of safety equipment, serving meals or beverages, or answering questions related to travel. Excludes �Baggage Porters and Bellhops� (39-6011) and �Flight Attendants� (53-2031).
Employment estimate and mean wage estimates for Passenger Attendants:
| Employment (1) | Employment RSE (3) |
Mean hourly wage |
Mean annual wage (2) |
Wage RSE (3) |
|---|---|---|---|---|
| 20,190 | 5.3 % | $ 17.68 | $ 36,780 | 0.8 % |
Percentile wage estimates for Passenger Attendants:
| Percentile | 10% | 25% | 50% (Median) |
75% | 90% |
|---|---|---|---|---|---|
| Hourly Wage | $ 13.00 | $ 15.39 | $ 17.12 | $ 18.98 | $ 22.93 |
| Annual Wage (2) | $ 27,040 | $ 32,020 | $ 35,620 | $ 39,470 | $ 47,680 |
Industries with the highest published employment and wages for Passenger Attendants are provided. For a list of all industries with employment in Passenger Attendants, see the Create Customized Tables function.
Industries with the highest levels of employment in Passenger Attendants:
| Industry | Employment (1) | Percent of industry employment | Hourly mean wage | Annual mean wage (2) |
|---|---|---|---|---|
| Support Activities for Air Transportation | 13,040 | 5.15 | $ 16.79 | $ 34,920 |
| School and Employee Bus Transportation | 1,290 | 0.65 | $ 14.37 | $ 29,890 |
| Scenic and Sightseeing Transportation, Water | 1,000 | 5.96 | $ 20.58 | $ 42,810 |
| Local Government, excluding Schools and Hospitals (OEWS Designation) | 840 | 0.02 | $ 21.67 | $ 45,070 |
| State Government, excluding Schools and Hospitals (OEWS Designation) | 720 | 0.03 | $ 23.37 | $ 48,610 |
Industries with the highest concentration of employment in Passenger Attendants:
| Industry | Employment (1) | Percent of industry employment | Hourly mean wage | Annual mean wage (2) |
|---|---|---|---|---|
| Scenic and Sightseeing Transportation, Water | 1,000 | 5.96 | $ 20.58 | $ 42,810 |
| Support Activities for Air Transportation | 13,040 | 5.15 | $ 16.79 | $ 34,920 |
| Scenic and Sightseeing Transportation, Other | 50 | 2.04 | $ 15.39 | $ 32,000 |
| Interurban and Rural Bus Transportation | 280 | 1.93 | $ 18.79 | $ 39,080 |
| Deep Sea, Coastal, and Great Lakes Water Transportation | 310 | 0.78 | $ 23.11 | $ 48,070 |
Top paying industries for Passenger Attendants:
| Industry | Employment (1) | Percent of industry employment | Hourly mean wage | Annual mean wage (2) |
|---|---|---|---|---|
| Inland Water Transportation | (8) | (8) | $ 38.69 | $ 80,480 |
| State Government, excluding Schools and Hospitals (OEWS Designation) | 720 | 0.03 | $ 23.37 | $ 48,610 |
| Deep Sea, Coastal, and Great Lakes Water Transportation | 310 | 0.78 | $ 23.11 | $ 48,070 |
| Support Activities for Water Transportation | 110 | 0.12 | $ 23.06 | $ 47,950 |
| Local Government, excluding Schools and Hospitals (OEWS Designation) | 840 | 0.02 | $ 21.67 | $ 45,070 |
States and areas with the highest published employment, location quotients, and wages for Passenger Attendants are provided. For a list of all areas with employment in Passenger Attendants, see the Create Customized Tables function.
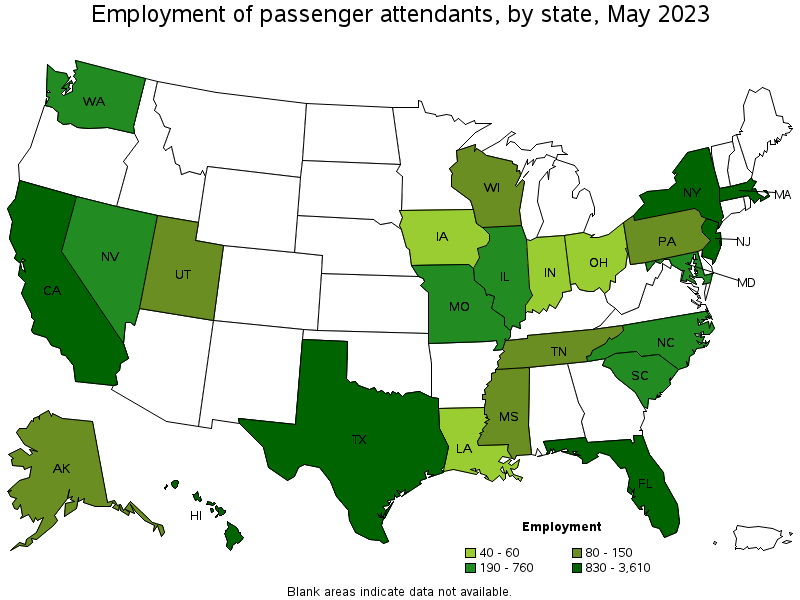
States with the highest employment level in Passenger Attendants:
| State | Employment (1) | Employment per thousand jobs | Location quotient (9) | Hourly mean wage | Annual mean wage (2) |
|---|---|---|---|---|---|
| Texas | 3,610 | 0.27 | 2.00 | $ 15.56 | $ 32,360 |
| California | 3,150 | 0.18 | 1.32 | $ 19.54 | $ 40,650 |
| New York | 2,160 | 0.23 | 1.73 | $ 19.58 | $ 40,720 |
| Florida | 1,810 | 0.19 | 1.43 | $ 17.58 | $ 36,560 |
| New Jersey | 1,350 | 0.32 | 2.42 | $ 18.45 | $ 38,380 |
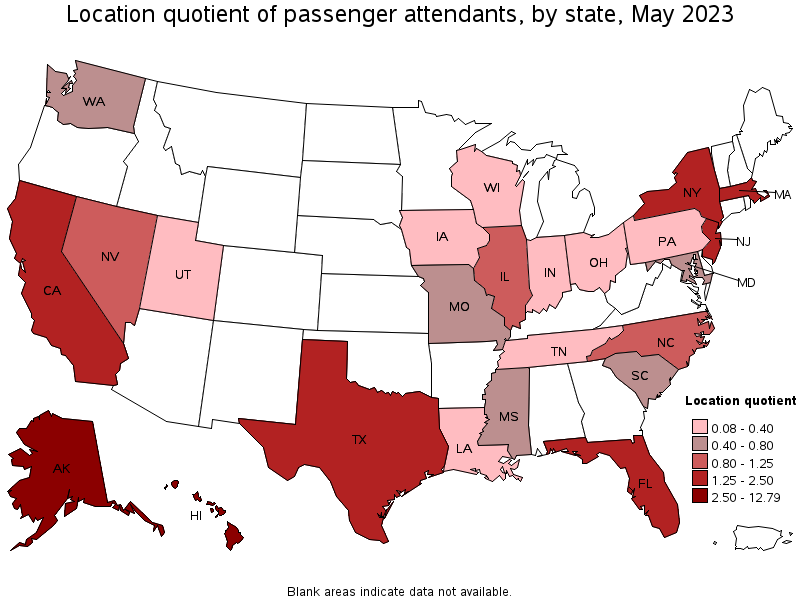
States with the highest concentration of jobs and location quotients in Passenger Attendants:
| State | Employment (1) | Employment per thousand jobs | Location quotient (9) | Hourly mean wage | Annual mean wage (2) |
|---|---|---|---|---|---|
| Hawaii | 830 | 1.34 | 10.10 | $ 20.58 | $ 42,800 |
| Alaska | 140 | 0.43 | 3.26 | $ 23.99 | $ 49,890 |
| New Jersey | 1,350 | 0.32 | 2.42 | $ 18.45 | $ 38,380 |
| Texas | 3,610 | 0.27 | 2.00 | $ 15.56 | $ 32,360 |
| Massachusetts | 850 | 0.23 | 1.76 | $ 18.45 | $ 38,370 |
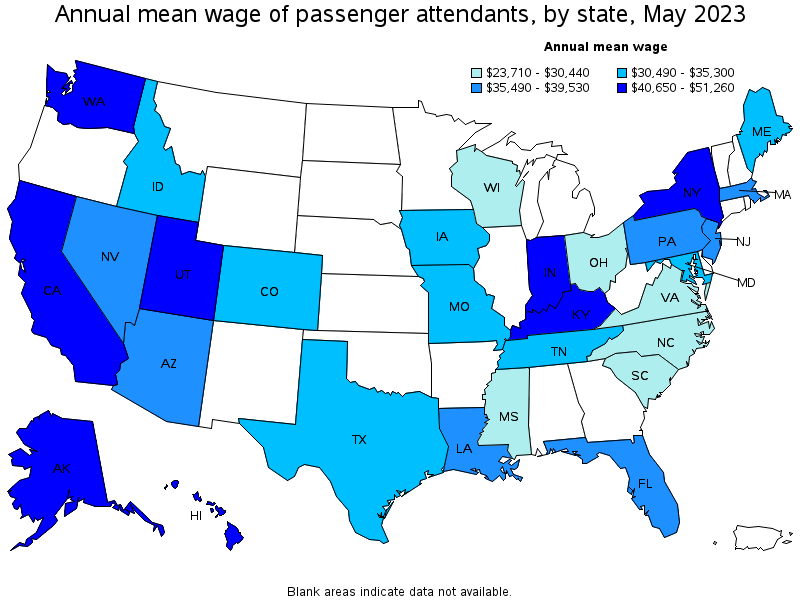
Top paying states for Passenger Attendants:
| State | Employment (1) | Employment per thousand jobs | Location quotient (9) | Hourly mean wage | Annual mean wage (2) |
|---|---|---|---|---|---|
| Utah | 80 | 0.05 | 0.34 | $ 24.64 | $ 51,260 |
| Alaska | 140 | 0.43 | 3.26 | $ 23.99 | $ 49,890 |
| Indiana | 40 | 0.01 | 0.09 | $ 23.43 | $ 48,740 |
| Kentucky | (8) | (8) | (8) | $ 21.29 | $ 44,290 |
| Hawaii | 830 | 1.34 | 10.10 | $ 20.58 | $ 42,800 |
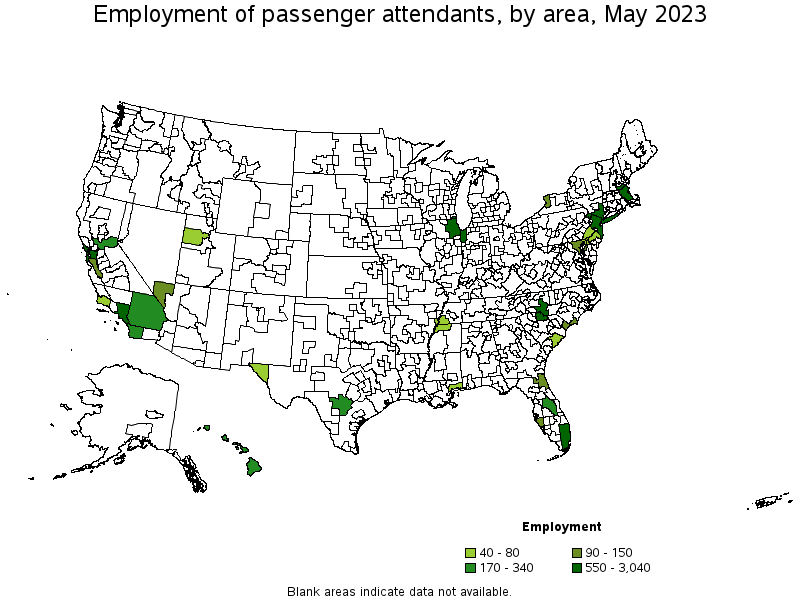
Metropolitan areas with the highest employment level in Passenger Attendants:
| Metropolitan area | Employment (1) | Employment per thousand jobs | Location quotient (9) | Hourly mean wage | Annual mean wage (2) |
|---|---|---|---|---|---|
| New York-Newark-Jersey City, NY-NJ-PA | 3,040 | 0.32 | 2.41 | $ 19.02 | $ 39,560 |
| Los Angeles-Long Beach-Anaheim, CA | 1,310 | 0.21 | 1.59 | $ 19.79 | $ 41,170 |
| Miami-Fort Lauderdale-West Palm Beach, FL | 1,030 | 0.38 | 2.86 | $ 18.13 | $ 37,720 |
| Boston-Cambridge-Nashua, MA-NH | 810 | 0.29 | 2.20 | $ 18.49 | $ 38,450 |
| Chicago-Naperville-Elgin, IL-IN-WI | 680 | 0.15 | 1.13 | $ 13.49 | $ 28,060 |
| Charlotte-Concord-Gastonia, NC-SC | 550 | 0.42 | 3.18 | $ 11.14 | $ 23,170 |
| San Francisco-Oakland-Hayward, CA | 550 | 0.23 | 1.72 | $ 21.35 | $ 44,410 |
| Orlando-Kissimmee-Sanford, FL | 340 | 0.25 | 1.89 | $ 17.36 | $ 36,110 |
| Kahului-Wailuku-Lahaina, HI | 340 | 4.52 | 34.03 | $ 20.82 | $ 43,300 |
| San Diego-Carlsbad, CA | 290 | 0.19 | 1.43 | $ 18.16 | $ 37,770 |
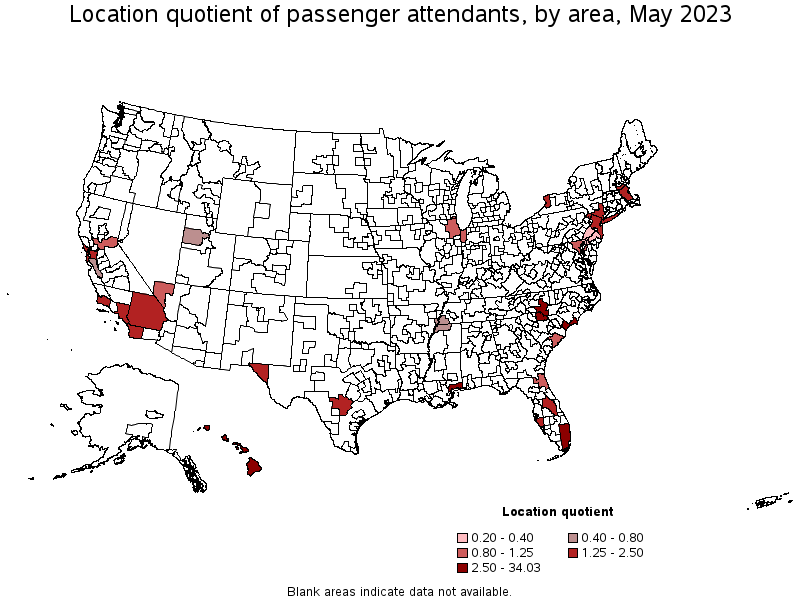
Metropolitan areas with the highest concentration of jobs and location quotients in Passenger Attendants:
| Metropolitan area | Employment (1) | Employment per thousand jobs | Location quotient (9) | Hourly mean wage | Annual mean wage (2) |
|---|---|---|---|---|---|
| Kahului-Wailuku-Lahaina, HI | 340 | 4.52 | 34.03 | $ 20.82 | $ 43,300 |
| Urban Honolulu, HI | 260 | 0.59 | 4.46 | $ 20.32 | $ 42,270 |
| Myrtle Beach-Conway-North Myrtle Beach, SC-NC | 100 | 0.58 | 4.34 | $ 11.31 | $ 23,520 |
| Charlotte-Concord-Gastonia, NC-SC | 550 | 0.42 | 3.18 | $ 11.14 | $ 23,170 |
| Miami-Fort Lauderdale-West Palm Beach, FL | 1,030 | 0.38 | 2.86 | $ 18.13 | $ 37,720 |
| Gulfport-Biloxi-Pascagoula, MS | 50 | 0.34 | 2.55 | $ 15.20 | $ 31,620 |
| New York-Newark-Jersey City, NY-NJ-PA | 3,040 | 0.32 | 2.41 | $ 19.02 | $ 39,560 |
| Boston-Cambridge-Nashua, MA-NH | 810 | 0.29 | 2.20 | $ 18.49 | $ 38,450 |
| North Port-Sarasota-Bradenton, FL | 90 | 0.27 | 2.07 | $ 15.73 | $ 32,720 |
| Orlando-Kissimmee-Sanford, FL | 340 | 0.25 | 1.89 | $ 17.36 | $ 36,110 |
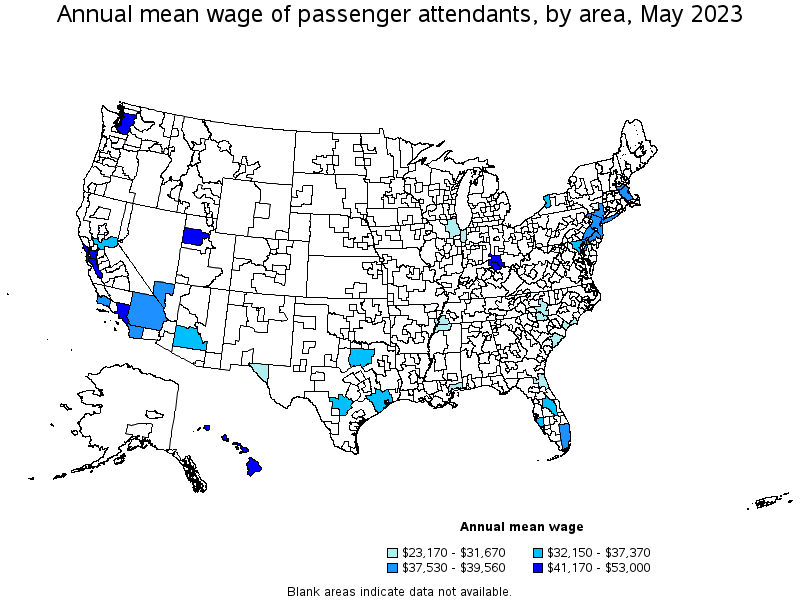
Top paying metropolitan areas for Passenger Attendants:
| Metropolitan area | Employment (1) | Employment per thousand jobs | Location quotient (9) | Hourly mean wage | Annual mean wage (2) |
|---|---|---|---|---|---|
| Salt Lake City, UT | 70 | 0.09 | 0.65 | $ 25.48 | $ 53,000 |
| San Francisco-Oakland-Hayward, CA | 550 | 0.23 | 1.72 | $ 21.35 | $ 44,410 |
| Kahului-Wailuku-Lahaina, HI | 340 | 4.52 | 34.03 | $ 20.82 | $ 43,300 |
| San Jose-Sunnyvale-Santa Clara, CA | 100 | 0.09 | 0.66 | $ 20.33 | $ 42,280 |
| Cincinnati, OH-KY-IN | (8) | (8) | (8) | $ 20.32 | $ 42,270 |
| Urban Honolulu, HI | 260 | 0.59 | 4.46 | $ 20.32 | $ 42,270 |
| Seattle-Tacoma-Bellevue, WA | (8) | (8) | (8) | $ 19.96 | $ 41,510 |
| Los Angeles-Long Beach-Anaheim, CA | 1,310 | 0.21 | 1.59 | $ 19.79 | $ 41,170 |
| New York-Newark-Jersey City, NY-NJ-PA | 3,040 | 0.32 | 2.41 | $ 19.02 | $ 39,560 |
| Santa Maria-Santa Barbara, CA | 40 | 0.20 | 1.53 | $ 18.65 | $ 38,790 |
Nonmetropolitan areas with the highest employment in Passenger Attendants:
| Nonmetropolitan area | Employment (1) | Employment per thousand jobs | Location quotient (9) | Hourly mean wage | Annual mean wage (2) |
|---|---|---|---|---|---|
| Hawaii / Kauai nonmetropolitan area | 230 | 2.22 | 16.73 | $ 20.51 | $ 42,650 |
Nonmetropolitan areas with the highest concentration of jobs and location quotients in Passenger Attendants:
| Nonmetropolitan area | Employment (1) | Employment per thousand jobs | Location quotient (9) | Hourly mean wage | Annual mean wage (2) |
|---|---|---|---|---|---|
| Hawaii / Kauai nonmetropolitan area | 230 | 2.22 | 16.73 | $ 20.51 | $ 42,650 |
Top paying nonmetropolitan areas for Passenger Attendants:
| Nonmetropolitan area | Employment (1) | Employment per thousand jobs | Location quotient (9) | Hourly mean wage | Annual mean wage (2) |
|---|---|---|---|---|---|
| Hawaii / Kauai nonmetropolitan area | 230 | 2.22 | 16.73 | $ 20.51 | $ 42,650 |
These estimates are calculated with data collected from employers in all industry sectors, all metropolitan and nonmetropolitan areas, and all states and the District of Columbia. The top employment and wage figures are provided above. The complete list is available in the downloadable XLS files.
The percentile wage estimate is the value of a wage below which a certain percent of workers fall. The median wage is the 50th percentile wage estimate—50 percent of workers earn less than the median and 50 percent of workers earn more than the median. More about percentile wages.
(1) Estimates for detailed occupations do not sum to the totals because the totals include occupations not shown separately. Estimates do not include self-employed workers.
(2) Annual wages have been calculated by multiplying the hourly mean wage by a "year-round, full-time" hours figure of 2,080 hours; for those occupations where there is not an hourly wage published, the annual wage has been directly calculated from the reported survey data.
(3) The relative standard error (RSE) is a measure of the reliability of a survey statistic. The smaller the relative standard error, the more precise the estimate.
(8) Estimate not released.
(9) The location quotient is the ratio of the area concentration of occupational employment to the national average concentration. A location quotient greater than one indicates the occupation has a higher share of employment than average, and a location quotient less than one indicates the occupation is less prevalent in the area than average.
Other OEWS estimates and related information:
May 2023 National Occupational Employment and Wage Estimates
May 2023 State Occupational Employment and Wage Estimates
May 2023 Metropolitan and Nonmetropolitan Area Occupational Employment and Wage Estimates
May 2023 National Industry-Specific Occupational Employment and Wage Estimates
Last Modified Date: April 3, 2024