
An official website of the United States government
An official website of the United States government
The .gov means it's official.
Federal government websites often end in .gov or .mil. Before sharing sensitive information,
make sure you're on a federal government site.
The site is secure.
The
https:// ensures that you are connecting to the official website and that any
information you provide is encrypted and transmitted securely.
Operate steam-, gas-, electric motor-, or internal combustion-engine driven compressors. Transmit, compress, or recover gases, such as butane, nitrogen, hydrogen, and natural gas.
Employment estimate and mean wage estimates for Gas Compressor and Gas Pumping Station Operators:
| Employment (1) | Employment RSE (3) |
Mean hourly wage |
Mean annual wage (2) |
Wage RSE (3) |
|---|---|---|---|---|
| 4,400 | 10.9 % | $ 30.68 | $ 63,810 | 1.8 % |
Percentile wage estimates for Gas Compressor and Gas Pumping Station Operators:
| Percentile | 10% | 25% | 50% (Median) |
75% | 90% |
|---|---|---|---|---|---|
| Hourly Wage | $ 17.54 | $ 22.82 | $ 29.75 | $ 36.24 | $ 44.93 |
| Annual Wage (2) | $ 36,480 | $ 47,470 | $ 61,870 | $ 75,370 | $ 93,450 |
Industries with the highest published employment and wages for Gas Compressor and Gas Pumping Station Operators are provided. For a list of all industries with employment in Gas Compressor and Gas Pumping Station Operators, see the Create Customized Tables function.
Industries with the highest levels of employment in Gas Compressor and Gas Pumping Station Operators:
| Industry | Employment (1) | Percent of industry employment | Hourly mean wage | Annual mean wage (2) |
|---|---|---|---|---|
| Pipeline Transportation of Natural Gas | 1,020 | 3.10 | $ 34.37 | $ 71,490 |
| Natural Gas Distribution | 470 | 0.42 | $ 38.06 | $ 79,170 |
| Machinery, Equipment, and Supplies Merchant Wholesalers | 450 | 0.06 | $ 21.62 | $ 44,970 |
| Oil and Gas Extraction | 370 | 0.34 | $ 33.80 | $ 70,310 |
| Merchant Wholesalers, Nondurable Goods (4242 and 4246 only) | 360 | 0.09 | $ 24.04 | $ 50,010 |
Industries with the highest concentration of employment in Gas Compressor and Gas Pumping Station Operators:
| Industry | Employment (1) | Percent of industry employment | Hourly mean wage | Annual mean wage (2) |
|---|---|---|---|---|
| Pipeline Transportation of Natural Gas | 1,020 | 3.10 | $ 34.37 | $ 71,490 |
| Natural Gas Distribution | 470 | 0.42 | $ 38.06 | $ 79,170 |
| Fuel Dealers | 250 | 0.35 | $ 23.05 | $ 47,940 |
| Oil and Gas Extraction | 370 | 0.34 | $ 33.80 | $ 70,310 |
| Merchant Wholesalers, Nondurable Goods (4242 and 4246 only) | 360 | 0.09 | $ 24.04 | $ 50,010 |
Top paying industries for Gas Compressor and Gas Pumping Station Operators:
| Industry | Employment (1) | Percent of industry employment | Hourly mean wage | Annual mean wage (2) |
|---|---|---|---|---|
| Electric Power Generation, Transmission and Distribution | 170 | 0.04 | $ 49.41 | $ 102,780 |
| Natural Gas Distribution | 470 | 0.42 | $ 38.06 | $ 79,170 |
| Pipeline Transportation of Natural Gas | 1,020 | 3.10 | $ 34.37 | $ 71,490 |
| Oil and Gas Extraction | 370 | 0.34 | $ 33.80 | $ 70,310 |
| Support Activities for Mining | (8) | (8) | $ 32.51 | $ 67,620 |
States and areas with the highest published employment, location quotients, and wages for Gas Compressor and Gas Pumping Station Operators are provided. For a list of all areas with employment in Gas Compressor and Gas Pumping Station Operators, see the Create Customized Tables function.
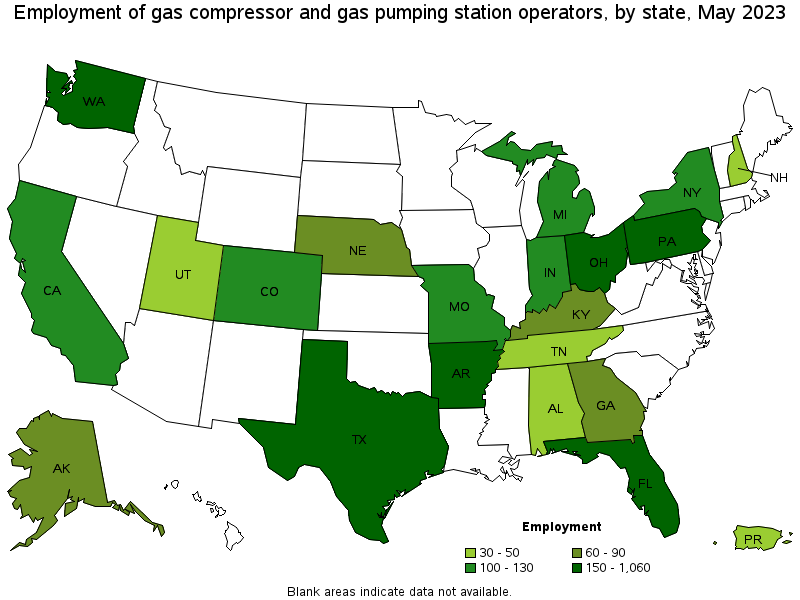
States with the highest employment level in Gas Compressor and Gas Pumping Station Operators:
| State | Employment (1) | Employment per thousand jobs | Location quotient (9) | Hourly mean wage | Annual mean wage (2) |
|---|---|---|---|---|---|
| Texas | 1,060 | 0.08 | 2.71 | $ 31.06 | $ 64,610 |
| Pennsylvania | 330 | 0.06 | 1.90 | $ 30.32 | $ 63,070 |
| Arkansas | 300 | 0.23 | 8.05 | $ 26.02 | $ 54,120 |
| Florida | 290 | 0.03 | 1.06 | $ 18.59 | $ 38,660 |
| Ohio | 160 | 0.03 | 1.00 | $ 37.62 | $ 78,260 |
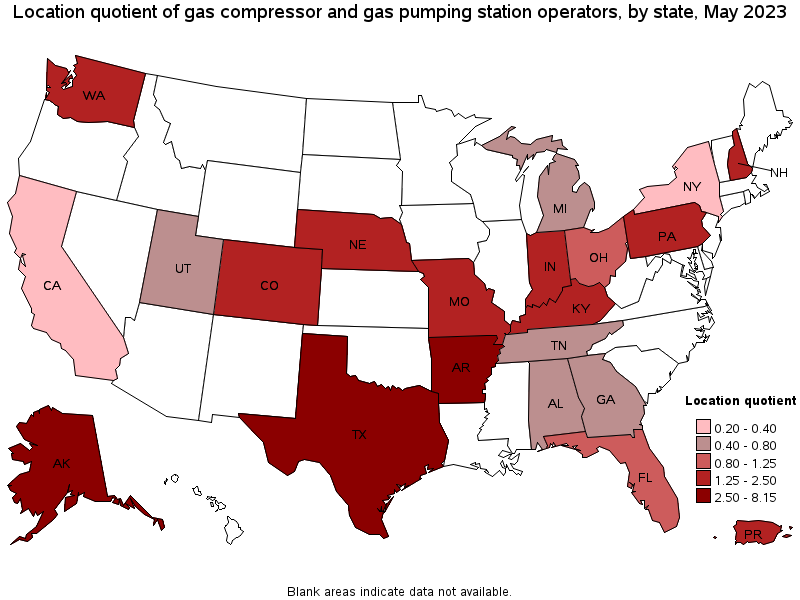
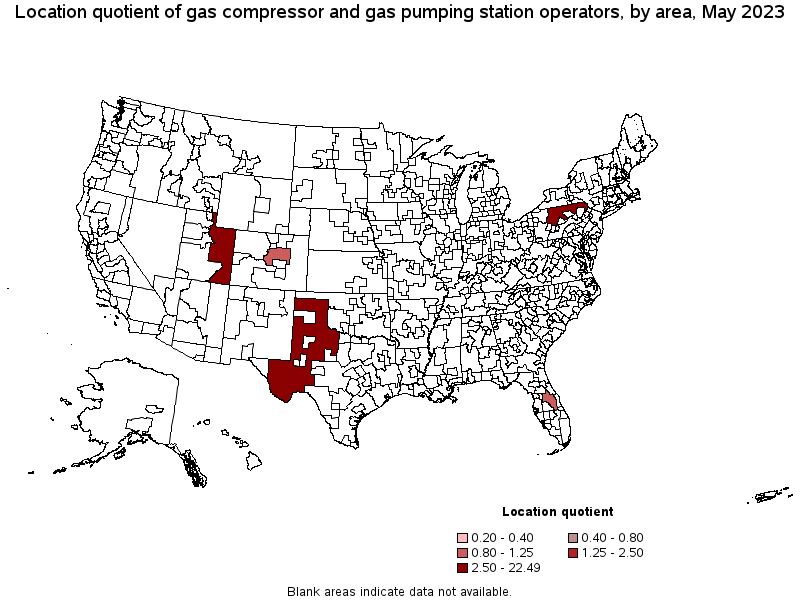
States with the highest concentration of jobs and location quotients in Gas Compressor and Gas Pumping Station Operators:
| State | Employment (1) | Employment per thousand jobs | Location quotient (9) | Hourly mean wage | Annual mean wage (2) |
|---|---|---|---|---|---|
| Alaska | 70 | 0.24 | 8.15 | (8) | (8) |
| Arkansas | 300 | 0.23 | 8.05 | $ 26.02 | $ 54,120 |
| Texas | 1,060 | 0.08 | 2.71 | $ 31.06 | $ 64,610 |
| Nebraska | 60 | 0.06 | 2.23 | $ 33.19 | $ 69,040 |
| New Hampshire | 40 | 0.06 | 2.07 | $ 30.08 | $ 62,560 |
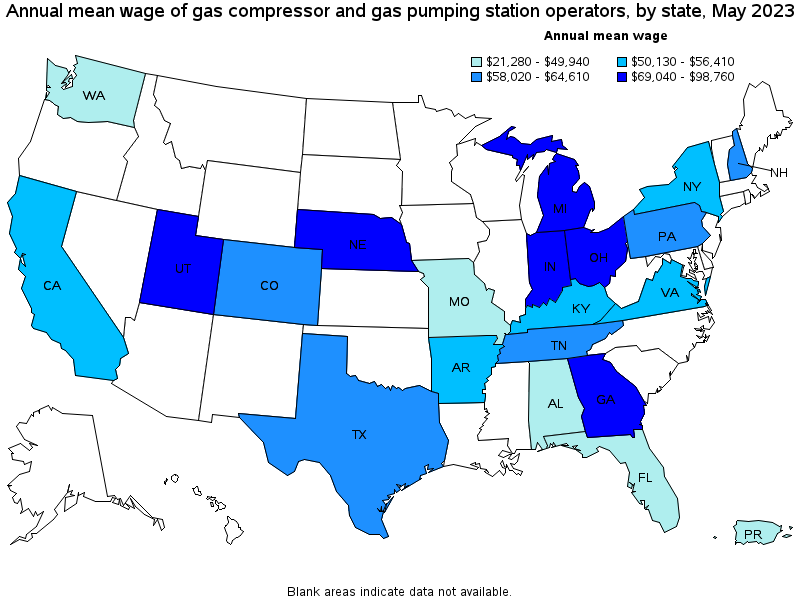
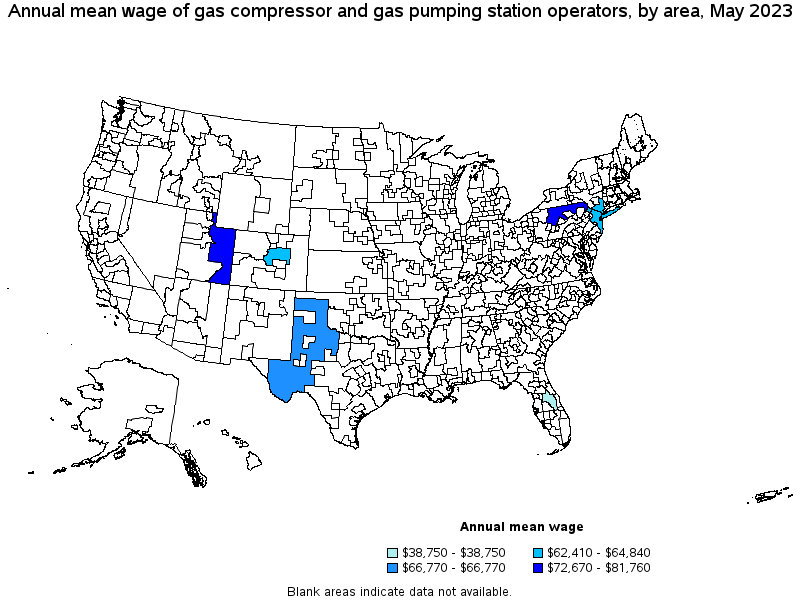
Top paying states for Gas Compressor and Gas Pumping Station Operators:
| State | Employment (1) | Employment per thousand jobs | Location quotient (9) | Hourly mean wage | Annual mean wage (2) |
|---|---|---|---|---|---|
| Michigan | 100 | 0.02 | 0.76 | $ 47.48 | $ 98,760 |
| Indiana | 130 | 0.04 | 1.41 | $ 39.53 | $ 82,220 |
| Utah | 40 | 0.02 | 0.77 | $ 39.41 | $ 81,970 |
| Ohio | 160 | 0.03 | 1.00 | $ 37.62 | $ 78,260 |
| Georgia | 90 | 0.02 | 0.66 | $ 36.09 | $ 75,070 |
Metropolitan areas with the highest employment level in Gas Compressor and Gas Pumping Station Operators:
| Metropolitan area | Employment (1) | Employment per thousand jobs | Location quotient (9) | Hourly mean wage | Annual mean wage (2) |
|---|---|---|---|---|---|
| Denver-Aurora-Lakewood, CO | 50 | 0.03 | 1.04 | $ 30.01 | $ 62,410 |
| Orlando-Kissimmee-Sanford, FL | 40 | 0.03 | 0.99 | $ 18.63 | $ 38,750 |
Metropolitan areas with the highest concentration of jobs and location quotients in Gas Compressor and Gas Pumping Station Operators:
| Metropolitan area | Employment (1) | Employment per thousand jobs | Location quotient (9) | Hourly mean wage | Annual mean wage (2) |
|---|---|---|---|---|---|
| Denver-Aurora-Lakewood, CO | 50 | 0.03 | 1.04 | $ 30.01 | $ 62,410 |
| Orlando-Kissimmee-Sanford, FL | 40 | 0.03 | 0.99 | $ 18.63 | $ 38,750 |
Top paying metropolitan areas for Gas Compressor and Gas Pumping Station Operators:
| Metropolitan area | Employment (1) | Employment per thousand jobs | Location quotient (9) | Hourly mean wage | Annual mean wage (2) |
|---|---|---|---|---|---|
| New York-Newark-Jersey City, NY-NJ-PA | (8) | (8) | (8) | $ 31.17 | $ 64,840 |
| Denver-Aurora-Lakewood, CO | 50 | 0.03 | 1.04 | $ 30.01 | $ 62,410 |
| Orlando-Kissimmee-Sanford, FL | 40 | 0.03 | 0.99 | $ 18.63 | $ 38,750 |
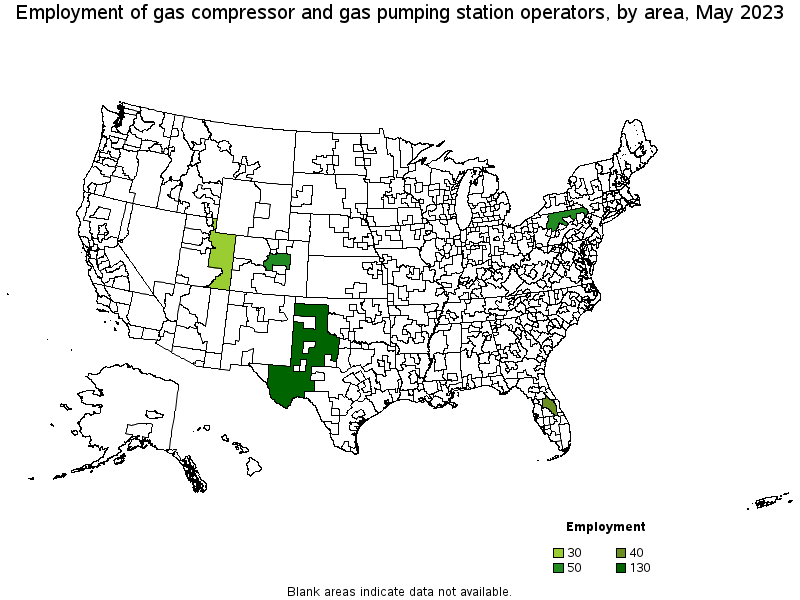
Nonmetropolitan areas with the highest employment in Gas Compressor and Gas Pumping Station Operators:
| Nonmetropolitan area | Employment (1) | Employment per thousand jobs | Location quotient (9) | Hourly mean wage | Annual mean wage (2) |
|---|---|---|---|---|---|
| West Texas Region of Texas nonmetropolitan area | 130 | 0.65 | 22.49 | $ 32.10 | $ 66,770 |
| Northern Pennsylvania nonmetropolitan area | 50 | 0.30 | 10.34 | $ 34.94 | $ 72,670 |
| Eastern Utah nonmetropolitan area | 30 | 0.34 | 11.82 | $ 39.31 | $ 81,760 |
Nonmetropolitan areas with the highest concentration of jobs and location quotients in Gas Compressor and Gas Pumping Station Operators:
| Nonmetropolitan area | Employment (1) | Employment per thousand jobs | Location quotient (9) | Hourly mean wage | Annual mean wage (2) |
|---|---|---|---|---|---|
| West Texas Region of Texas nonmetropolitan area | 130 | 0.65 | 22.49 | $ 32.10 | $ 66,770 |
| Eastern Utah nonmetropolitan area | 30 | 0.34 | 11.82 | $ 39.31 | $ 81,760 |
| Northern Pennsylvania nonmetropolitan area | 50 | 0.30 | 10.34 | $ 34.94 | $ 72,670 |
Top paying nonmetropolitan areas for Gas Compressor and Gas Pumping Station Operators:
| Nonmetropolitan area | Employment (1) | Employment per thousand jobs | Location quotient (9) | Hourly mean wage | Annual mean wage (2) |
|---|---|---|---|---|---|
| Eastern Utah nonmetropolitan area | 30 | 0.34 | 11.82 | $ 39.31 | $ 81,760 |
| Northern Pennsylvania nonmetropolitan area | 50 | 0.30 | 10.34 | $ 34.94 | $ 72,670 |
| West Texas Region of Texas nonmetropolitan area | 130 | 0.65 | 22.49 | $ 32.10 | $ 66,770 |
These estimates are calculated with data collected from employers in all industry sectors, all metropolitan and nonmetropolitan areas, and all states and the District of Columbia. The top employment and wage figures are provided above. The complete list is available in the downloadable XLS files.
The percentile wage estimate is the value of a wage below which a certain percent of workers fall. The median wage is the 50th percentile wage estimate—50 percent of workers earn less than the median and 50 percent of workers earn more than the median. More about percentile wages.
(1) Estimates for detailed occupations do not sum to the totals because the totals include occupations not shown separately. Estimates do not include self-employed workers.
(2) Annual wages have been calculated by multiplying the hourly mean wage by a "year-round, full-time" hours figure of 2,080 hours; for those occupations where there is not an hourly wage published, the annual wage has been directly calculated from the reported survey data.
(3) The relative standard error (RSE) is a measure of the reliability of a survey statistic. The smaller the relative standard error, the more precise the estimate.
(8) Estimate not released.
(9) The location quotient is the ratio of the area concentration of occupational employment to the national average concentration. A location quotient greater than one indicates the occupation has a higher share of employment than average, and a location quotient less than one indicates the occupation is less prevalent in the area than average.
Other OEWS estimates and related information:
May 2023 National Occupational Employment and Wage Estimates
May 2023 State Occupational Employment and Wage Estimates
May 2023 Metropolitan and Nonmetropolitan Area Occupational Employment and Wage Estimates
May 2023 National Industry-Specific Occupational Employment and Wage Estimates
Last Modified Date: April 3, 2024