
An official website of the United States government
An official website of the United States government
The .gov means it's official.
Federal government websites often end in .gov or .mil. Before sharing sensitive information,
make sure you're on a federal government site.
The site is secure.
The
https:// ensures that you are connecting to the official website and that any
information you provide is encrypted and transmitted securely.
Set up, maintain, and dismantle audio and video equipment, such as microphones, sound speakers, connecting wires and cables, sound and mixing boards, video cameras, video monitors and servers, and related electronic equipment for live or recorded events, such as concerts, meetings, conventions, presentations, podcasts, news conferences, and sporting events. Excludes �Sound Engineering Technicians� (27-4014), �Lighting Technicians� (27-4015), and �Audiovisual Equipment Installers and Repairers� (49-2097).
Employment estimate and mean wage estimates for Audio and Video Technicians:
| Employment (1) | Employment RSE (3) |
Mean hourly wage |
Mean annual wage (2) |
Wage RSE (3) |
|---|---|---|---|---|
| 66,700 | 2.7 % | $ 28.49 | $ 59,260 | 1.0 % |
Percentile wage estimates for Audio and Video Technicians:
| Percentile | 10% | 25% | 50% (Median) |
75% | 90% |
|---|---|---|---|---|---|
| Hourly Wage | $ 16.25 | $ 19.93 | $ 24.83 | $ 33.64 | $ 45.98 |
| Annual Wage (2) | $ 33,790 | $ 41,440 | $ 51,640 | $ 69,980 | $ 95,640 |
Industries with the highest published employment and wages for Audio and Video Technicians are provided. For a list of all industries with employment in Audio and Video Technicians, see the Create Customized Tables function.
Industries with the highest levels of employment in Audio and Video Technicians:
| Industry | Employment (1) | Percent of industry employment | Hourly mean wage | Annual mean wage (2) |
|---|---|---|---|---|
| Rental and Leasing Services (5322, 5323, and 5324 only) | 10,060 | 2.90 | $ 25.86 | $ 53,790 |
| Motion Picture and Video Industries | 9,510 | 2.35 | $ 34.82 | $ 72,420 |
| Colleges, Universities, and Professional Schools | 4,310 | 0.14 | $ 25.84 | $ 53,740 |
| Promoters of Performing Arts, Sports, and Similar Events | 3,560 | 2.18 | $ 26.12 | $ 54,330 |
| Media Streaming Distribution Services, Social Networks, and Other Media Networks and Content Providers | 3,050 | 1.31 | $ 37.03 | $ 77,020 |
Industries with the highest concentration of employment in Audio and Video Technicians:
| Industry | Employment (1) | Percent of industry employment | Hourly mean wage | Annual mean wage (2) |
|---|---|---|---|---|
| Sound Recording Industries | 700 | 3.28 | $ 26.09 | $ 54,270 |
| Rental and Leasing Services (5322, 5323, and 5324 only) | 10,060 | 2.90 | $ 25.86 | $ 53,790 |
| Motion Picture and Video Industries | 9,510 | 2.35 | $ 34.82 | $ 72,420 |
| Promoters of Performing Arts, Sports, and Similar Events | 3,560 | 2.18 | $ 26.12 | $ 54,330 |
| Performing Arts Companies | 1,970 | 1.46 | $ 24.05 | $ 50,020 |
Top paying industries for Audio and Video Technicians:
| Industry | Employment (1) | Percent of industry employment | Hourly mean wage | Annual mean wage (2) |
|---|---|---|---|---|
| Other Personal Services | (8) | (8) | $ 51.36 | $ 106,820 |
| Software Publishers | 290 | 0.04 | $ 44.37 | $ 92,280 |
| Outpatient Care Centers | 50 | (7) | $ 40.63 | $ 84,520 |
| Credit Intermediation and Related Activities (5221 and 5223 only) | 80 | (7) | $ 39.52 | $ 82,200 |
| Monetary Authorities-Central Bank | 50 | 0.24 | $ 38.58 | $ 80,240 |
States and areas with the highest published employment, location quotients, and wages for Audio and Video Technicians are provided. For a list of all areas with employment in Audio and Video Technicians, see the Create Customized Tables function.
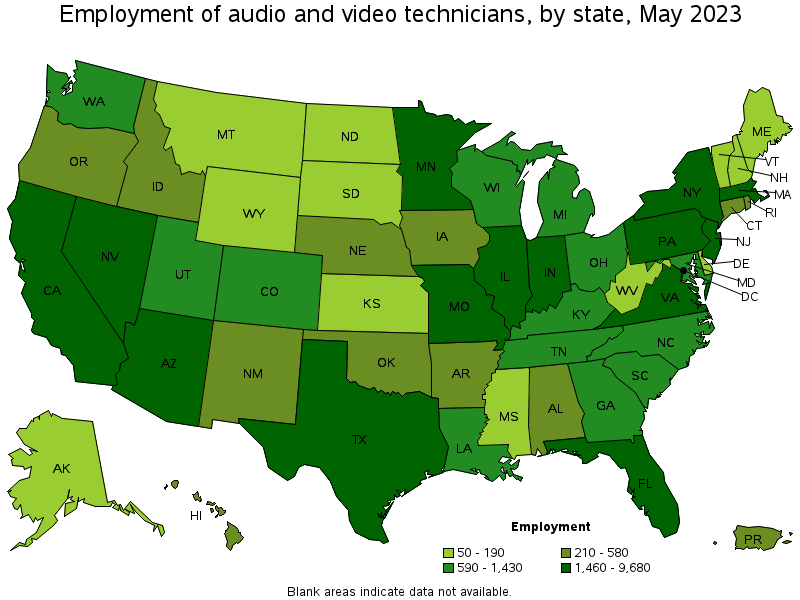
States with the highest employment level in Audio and Video Technicians:
| State | Employment (1) | Employment per thousand jobs | Location quotient (9) | Hourly mean wage | Annual mean wage (2) |
|---|---|---|---|---|---|
| California | 9,680 | 0.54 | 1.23 | $ 34.76 | $ 72,300 |
| New York | 8,410 | 0.89 | 2.04 | $ 32.43 | $ 67,450 |
| Florida | 5,340 | 0.56 | 1.27 | $ 25.95 | $ 53,980 |
| Texas | 5,320 | 0.39 | 0.89 | $ 24.79 | $ 51,560 |
| Illinois | 2,770 | 0.46 | 1.05 | $ 23.39 | $ 48,660 |
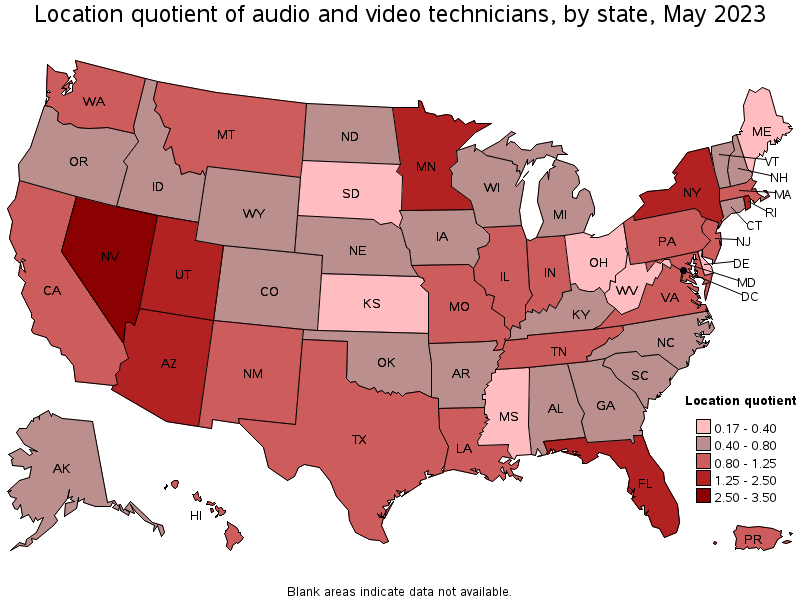
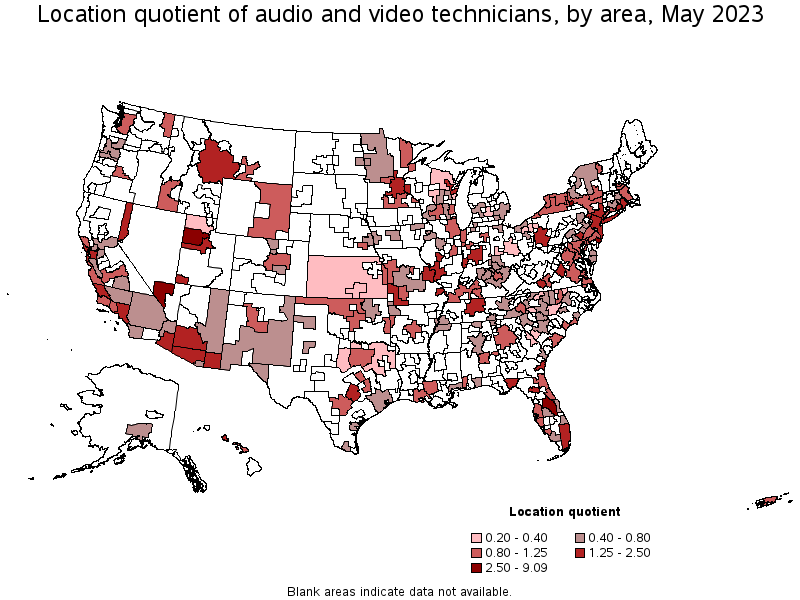
States with the highest concentration of jobs and location quotients in Audio and Video Technicians:
| State | Employment (1) | Employment per thousand jobs | Location quotient (9) | Hourly mean wage | Annual mean wage (2) |
|---|---|---|---|---|---|
| Nevada | 2,270 | 1.53 | 3.49 | $ 30.43 | $ 63,300 |
| New York | 8,410 | 0.89 | 2.04 | $ 32.43 | $ 67,450 |
| District of Columbia | 590 | 0.84 | 1.92 | $ 35.37 | $ 73,570 |
| Utah | 1,390 | 0.83 | 1.89 | $ 24.13 | $ 50,190 |
| Rhode Island | 340 | 0.70 | 1.58 | $ 26.30 | $ 54,690 |
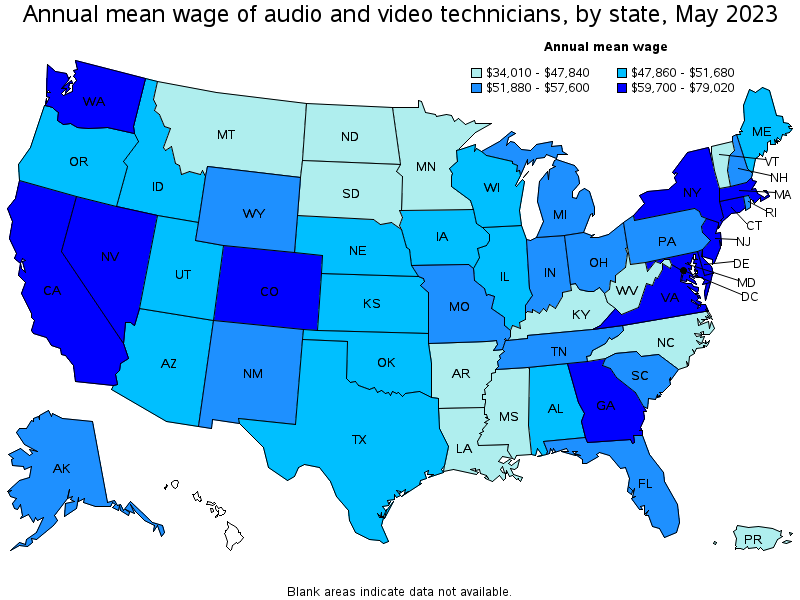
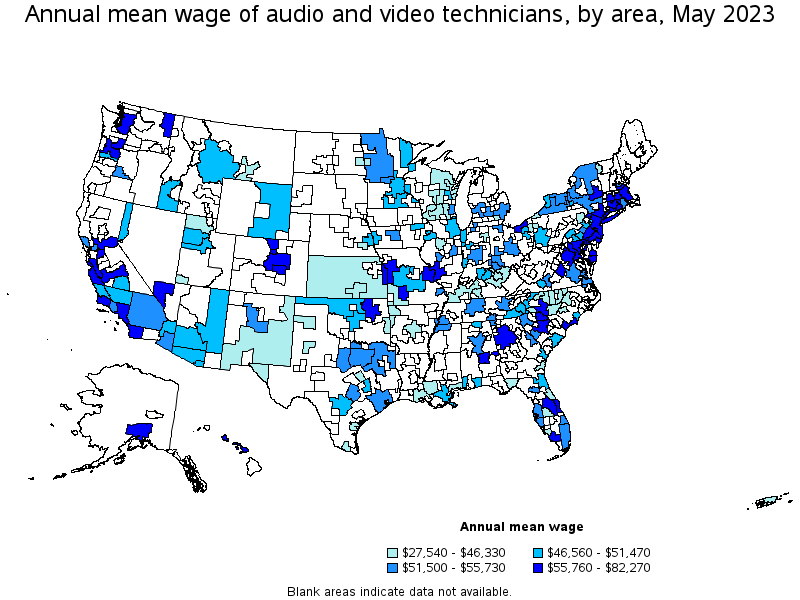
Top paying states for Audio and Video Technicians:
| State | Employment (1) | Employment per thousand jobs | Location quotient (9) | Hourly mean wage | Annual mean wage (2) |
|---|---|---|---|---|---|
| Washington | 1,430 | 0.41 | 0.93 | $ 37.99 | $ 79,020 |
| District of Columbia | 590 | 0.84 | 1.92 | $ 35.37 | $ 73,570 |
| California | 9,680 | 0.54 | 1.23 | $ 34.76 | $ 72,300 |
| New Jersey | 1,640 | 0.39 | 0.89 | $ 34.76 | $ 72,300 |
| Connecticut | 560 | 0.34 | 0.77 | $ 32.67 | $ 67,960 |
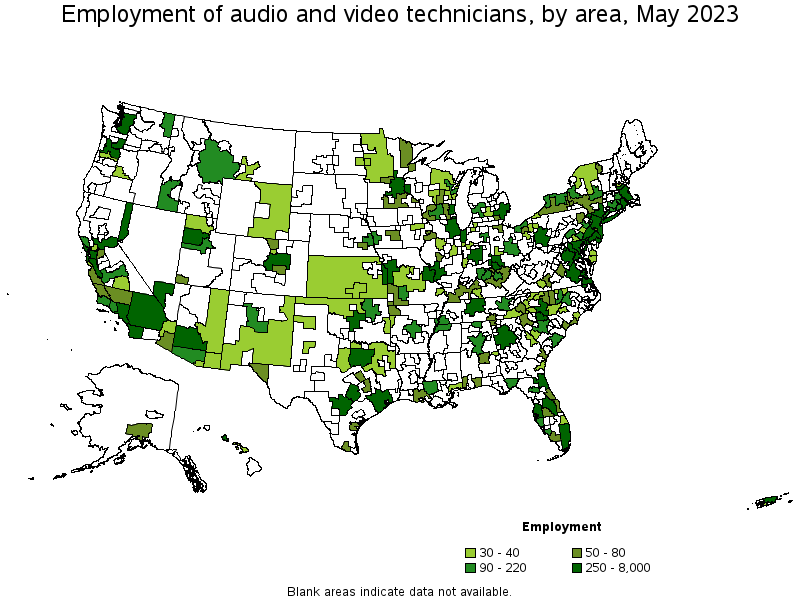
Metropolitan areas with the highest employment level in Audio and Video Technicians:
| Metropolitan area | Employment (1) | Employment per thousand jobs | Location quotient (9) | Hourly mean wage | Annual mean wage (2) |
|---|---|---|---|---|---|
| New York-Newark-Jersey City, NY-NJ-PA | 8,000 | 0.84 | 1.92 | $ 33.61 | $ 69,910 |
| Los Angeles-Long Beach-Anaheim, CA | 5,100 | 0.82 | 1.88 | $ 35.63 | $ 74,120 |
| Chicago-Naperville-Elgin, IL-IN-WI | 2,230 | 0.49 | 1.12 | $ 23.75 | $ 49,390 |
| Las Vegas-Henderson-Paradise, NV | 1,960 | 1.80 | 4.11 | $ 31.39 | $ 65,300 |
| Dallas-Fort Worth-Arlington, TX | 1,700 | 0.43 | 0.98 | $ 26.17 | $ 54,430 |
| San Francisco-Oakland-Hayward, CA | 1,680 | 0.69 | 1.58 | (8) | (8) |
| Orlando-Kissimmee-Sanford, FL | 1,590 | 1.17 | 2.65 | $ 27.28 | $ 56,740 |
| Miami-Fort Lauderdale-West Palm Beach, FL | 1,550 | 0.57 | 1.29 | $ 26.39 | $ 54,900 |
| Washington-Arlington-Alexandria, DC-VA-MD-WV | 1,510 | 0.49 | 1.11 | $ 33.82 | $ 70,340 |
| Minneapolis-St. Paul-Bloomington, MN-WI | 1,360 | 0.71 | 1.62 | $ 22.95 | $ 47,730 |
Metropolitan areas with the highest concentration of jobs and location quotients in Audio and Video Technicians:
| Metropolitan area | Employment (1) | Employment per thousand jobs | Location quotient (9) | Hourly mean wage | Annual mean wage (2) |
|---|---|---|---|---|---|
| Atlantic City-Hammonton, NJ | 500 | 3.99 | 9.09 | $ 35.66 | $ 74,180 |
| Las Vegas-Henderson-Paradise, NV | 1,960 | 1.80 | 4.11 | $ 31.39 | $ 65,300 |
| Salt Lake City, UT | 1,090 | 1.35 | 3.07 | $ 24.35 | $ 50,650 |
| Ithaca, NY | 60 | 1.21 | 2.76 | $ 24.44 | $ 50,840 |
| Orlando-Kissimmee-Sanford, FL | 1,590 | 1.17 | 2.65 | $ 27.28 | $ 56,740 |
| Yuma, AZ | 70 | 1.07 | 2.43 | $ 26.12 | $ 54,330 |
| Reno, NV | 270 | 1.06 | 2.40 | $ 24.33 | $ 50,600 |
| Cape Girardeau, MO-IL | 40 | 0.99 | 2.26 | $ 24.76 | $ 51,500 |
| Sierra Vista-Douglas, AZ | 30 | 0.89 | 2.03 | (8) | (8) |
| Indianapolis-Carmel-Anderson, IN | 960 | 0.88 | 2.01 | $ 25.61 | $ 53,270 |
Top paying metropolitan areas for Audio and Video Technicians:
| Metropolitan area | Employment (1) | Employment per thousand jobs | Location quotient (9) | Hourly mean wage | Annual mean wage (2) |
|---|---|---|---|---|---|
| Seattle-Tacoma-Bellevue, WA | 1,130 | 0.54 | 1.24 | $ 39.55 | $ 82,270 |
| Urban Honolulu, HI | 250 | 0.57 | 1.29 | $ 38.04 | $ 79,130 |
| Trenton, NJ | 80 | 0.32 | 0.74 | $ 36.67 | $ 76,270 |
| Charlottesville, VA | 70 | 0.66 | 1.50 | $ 36.13 | $ 75,150 |
| Atlantic City-Hammonton, NJ | 500 | 3.99 | 9.09 | $ 35.66 | $ 74,180 |
| Los Angeles-Long Beach-Anaheim, CA | 5,100 | 0.82 | 1.88 | $ 35.63 | $ 74,120 |
| Santa Maria-Santa Barbara, CA | 90 | 0.43 | 0.98 | $ 34.73 | $ 72,240 |
| Hartford-West Hartford-East Hartford, CT | 130 | 0.23 | 0.52 | $ 34.44 | $ 71,640 |
| Bridgeport-Stamford-Norwalk, CT | 160 | 0.41 | 0.94 | $ 34.21 | $ 71,160 |
| San Jose-Sunnyvale-Santa Clara, CA | 280 | 0.25 | 0.56 | $ 34.18 | $ 71,090 |
Nonmetropolitan areas with the highest employment in Audio and Video Technicians:
| Nonmetropolitan area | Employment (1) | Employment per thousand jobs | Location quotient (9) | Hourly mean wage | Annual mean wage (2) |
|---|---|---|---|---|---|
| Southwest Montana nonmetropolitan area | 90 | 0.59 | 1.35 | $ 22.62 | $ 47,040 |
| Central East New York nonmetropolitan area | 70 | 0.43 | 0.98 | $ 26.08 | $ 54,240 |
| Southwest New York nonmetropolitan area | 70 | 0.39 | 0.88 | $ 24.82 | $ 51,620 |
| Southwest Missouri nonmetropolitan area | 60 | 0.89 | 2.02 | $ 20.51 | $ 42,660 |
| Central Kentucky nonmetropolitan area | 60 | 0.33 | 0.74 | $ 18.40 | $ 38,280 |
Nonmetropolitan areas with the highest concentration of jobs and location quotients in Audio and Video Technicians:
| Nonmetropolitan area | Employment (1) | Employment per thousand jobs | Location quotient (9) | Hourly mean wage | Annual mean wage (2) |
|---|---|---|---|---|---|
| Southwest Missouri nonmetropolitan area | 60 | 0.89 | 2.02 | $ 20.51 | $ 42,660 |
| Southwest Montana nonmetropolitan area | 90 | 0.59 | 1.35 | $ 22.62 | $ 47,040 |
| Northwest Oklahoma nonmetropolitan area | 40 | 0.43 | 0.99 | $ 23.14 | $ 48,130 |
| Central East New York nonmetropolitan area | 70 | 0.43 | 0.98 | $ 26.08 | $ 54,240 |
| Eastern Wyoming nonmetropolitan area | 30 | 0.42 | 0.94 | $ 24.45 | $ 50,850 |
Top paying nonmetropolitan areas for Audio and Video Technicians:
| Nonmetropolitan area | Employment (1) | Employment per thousand jobs | Location quotient (9) | Hourly mean wage | Annual mean wage (2) |
|---|---|---|---|---|---|
| Capital/Northern New York nonmetropolitan area | 40 | 0.26 | 0.59 | $ 26.79 | $ 55,730 |
| Central East New York nonmetropolitan area | 70 | 0.43 | 0.98 | $ 26.08 | $ 54,240 |
| North Texas Region of Texas nonmetropolitan area | 40 | 0.16 | 0.35 | $ 26.08 | $ 54,240 |
| Northwest Minnesota nonmetropolitan area | 40 | 0.23 | 0.52 | $ 24.88 | $ 51,740 |
| Southwest New York nonmetropolitan area | 70 | 0.39 | 0.88 | $ 24.82 | $ 51,620 |
These estimates are calculated with data collected from employers in all industry sectors, all metropolitan and nonmetropolitan areas, and all states and the District of Columbia. The top employment and wage figures are provided above. The complete list is available in the downloadable XLS files.
The percentile wage estimate is the value of a wage below which a certain percent of workers fall. The median wage is the 50th percentile wage estimate—50 percent of workers earn less than the median and 50 percent of workers earn more than the median. More about percentile wages.
(1) Estimates for detailed occupations do not sum to the totals because the totals include occupations not shown separately. Estimates do not include self-employed workers.
(2) Annual wages have been calculated by multiplying the hourly mean wage by a "year-round, full-time" hours figure of 2,080 hours; for those occupations where there is not an hourly wage published, the annual wage has been directly calculated from the reported survey data.
(3) The relative standard error (RSE) is a measure of the reliability of a survey statistic. The smaller the relative standard error, the more precise the estimate.
(7) The value is less than .005 percent of industry employment.
(8) Estimate not released.
(9) The location quotient is the ratio of the area concentration of occupational employment to the national average concentration. A location quotient greater than one indicates the occupation has a higher share of employment than average, and a location quotient less than one indicates the occupation is less prevalent in the area than average.
Other OEWS estimates and related information:
May 2023 National Occupational Employment and Wage Estimates
May 2023 State Occupational Employment and Wage Estimates
May 2023 Metropolitan and Nonmetropolitan Area Occupational Employment and Wage Estimates
May 2023 National Industry-Specific Occupational Employment and Wage Estimates
Last Modified Date: April 3, 2024