
An official website of the United States government
An official website of the United States government
The .gov means it's official.
Federal government websites often end in .gov or .mil. Before sharing sensitive information,
make sure you're on a federal government site.
The site is secure.
The
https:// ensures that you are connecting to the official website and that any
information you provide is encrypted and transmitted securely.
Install, configure, and maintain an organization�s local area network (LAN), wide area network (WAN), data communications network, operating systems, and physical and virtual servers. Perform system monitoring and verify the integrity and availability of hardware, network, and server resources and systems. Review system and application logs and verify completion of scheduled jobs, including system backups. Analyze network and server resource consumption and control user access. Install and upgrade software and maintain software licenses. May assist in network modeling, analysis, planning, and coordination between network and data communications hardware and software. Excludes �Information Security Analysts� (15-1212), �Computer Network Support Specialists� (15-1231), and �Computer User Support Specialists� (15-1232).
Employment estimate and mean wage estimates for Network and Computer Systems Administrators:
| Employment (1) | Employment RSE (3) |
Mean hourly wage |
Mean annual wage (2) |
Wage RSE (3) |
|---|---|---|---|---|
| 323,020 | 0.7 % | $ 48.36 | $ 100,580 | 0.5 % |
Percentile wage estimates for Network and Computer Systems Administrators:
| Percentile | 10% | 25% | 50% (Median) |
75% | 90% |
|---|---|---|---|---|---|
| Hourly Wage | $ 28.21 | $ 35.77 | $ 45.84 | $ 58.61 | $ 71.49 |
| Annual Wage (2) | $ 58,680 | $ 74,400 | $ 95,360 | $ 121,910 | $ 148,710 |
Industries with the highest published employment and wages for Network and Computer Systems Administrators are provided. For a list of all industries with employment in Network and Computer Systems Administrators, see the Create Customized Tables function.
Industries with the highest levels of employment in Network and Computer Systems Administrators:
| Industry | Employment (1) | Percent of industry employment | Hourly mean wage | Annual mean wage (2) |
|---|---|---|---|---|
| Computer Systems Design and Related Services | 55,220 | 2.18 | $ 49.54 | $ 103,040 |
| Management of Companies and Enterprises | 23,660 | 0.85 | $ 51.04 | $ 106,160 |
| Local Government, excluding Schools and Hospitals (OEWS Designation) | 16,330 | 0.30 | $ 44.52 | $ 92,610 |
| Colleges, Universities, and Professional Schools | 15,660 | 0.51 | $ 43.53 | $ 90,550 |
| Elementary and Secondary Schools | 12,920 | 0.15 | $ 39.15 | $ 81,420 |
Industries with the highest concentration of employment in Network and Computer Systems Administrators:
| Industry | Employment (1) | Percent of industry employment | Hourly mean wage | Annual mean wage (2) |
|---|---|---|---|---|
| Computer Systems Design and Related Services | 55,220 | 2.18 | $ 49.54 | $ 103,040 |
| Computing Infrastructure Providers, Data Processing, Web Hosting, and Related Services | 7,500 | 1.55 | $ 52.84 | $ 109,900 |
| Telecommunications | 9,550 | 1.48 | $ 53.85 | $ 112,010 |
| Software Publishers | 6,430 | 0.98 | $ 52.55 | $ 109,300 |
| Management of Companies and Enterprises | 23,660 | 0.85 | $ 51.04 | $ 106,160 |
Top paying industries for Network and Computer Systems Administrators:
| Industry | Employment (1) | Percent of industry employment | Hourly mean wage | Annual mean wage (2) |
|---|---|---|---|---|
| Web Search Portals, Libraries, Archives, and Other Information Services | 630 | 0.34 | $ 65.12 | $ 135,450 |
| Securities, Commodity Contracts, and Other Financial Investments and Related Activities | 4,240 | 0.40 | $ 63.97 | $ 133,060 |
| Highway, Street, and Bridge Construction | 110 | 0.03 | $ 62.16 | $ 129,290 |
| Lessors of Nonfinancial Intangible Assets (except Copyrighted Works) | 80 | 0.37 | $ 61.03 | $ 126,950 |
| Natural Gas Distribution | 180 | 0.16 | $ 59.66 | $ 124,100 |
States and areas with the highest published employment, location quotients, and wages for Network and Computer Systems Administrators are provided. For a list of all areas with employment in Network and Computer Systems Administrators, see the Create Customized Tables function.
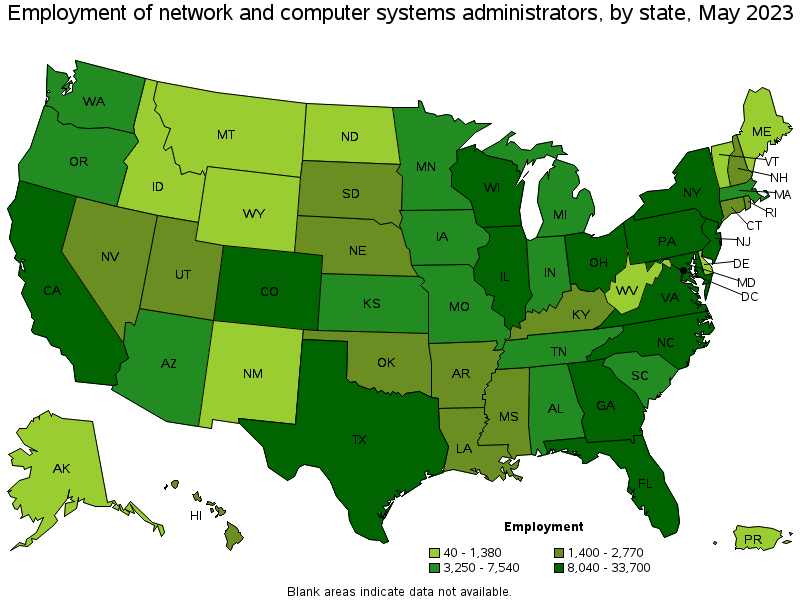
States with the highest employment level in Network and Computer Systems Administrators:
| State | Employment (1) | Employment per thousand jobs | Location quotient (9) | Hourly mean wage | Annual mean wage (2) |
|---|---|---|---|---|---|
| Texas | 33,700 | 2.49 | 1.17 | $ 46.82 | $ 97,380 |
| California | 29,130 | 1.62 | 0.76 | $ 55.18 | $ 114,770 |
| Florida | 22,430 | 2.34 | 1.10 | $ 45.89 | $ 95,460 |
| Ohio | 20,280 | 3.71 | 1.74 | $ 49.18 | $ 102,290 |
| New York | 20,020 | 2.13 | 1.00 | $ 52.57 | $ 109,340 |
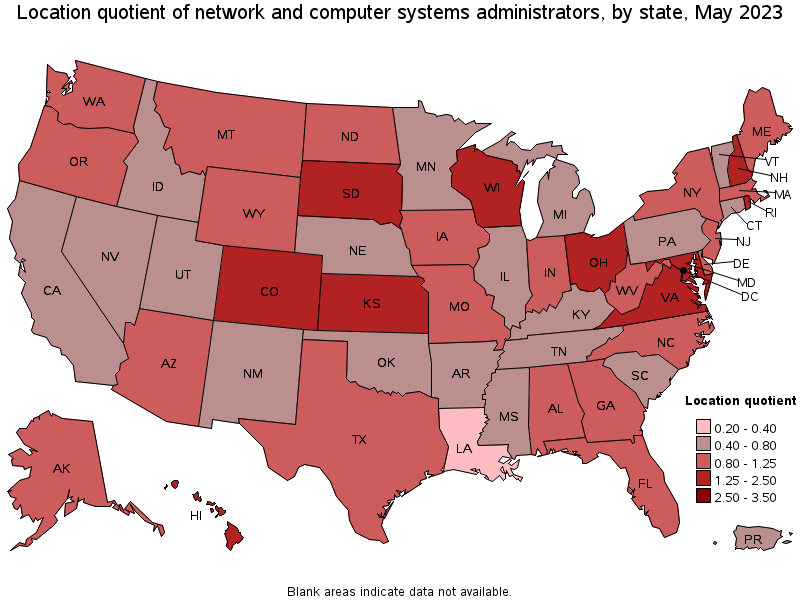
States with the highest concentration of jobs and location quotients in Network and Computer Systems Administrators:
| State | Employment (1) | Employment per thousand jobs | Location quotient (9) | Hourly mean wage | Annual mean wage (2) |
|---|---|---|---|---|---|
| South Dakota | 1,890 | 4.24 | 1.99 | $ 34.61 | $ 71,980 |
| Hawaii | 2,400 | 3.88 | 1.83 | $ 46.30 | $ 96,300 |
| Colorado | 10,880 | 3.84 | 1.81 | $ 50.30 | $ 104,620 |
| Virginia | 15,040 | 3.78 | 1.78 | $ 52.16 | $ 108,490 |
| Ohio | 20,280 | 3.71 | 1.74 | $ 49.18 | $ 102,290 |
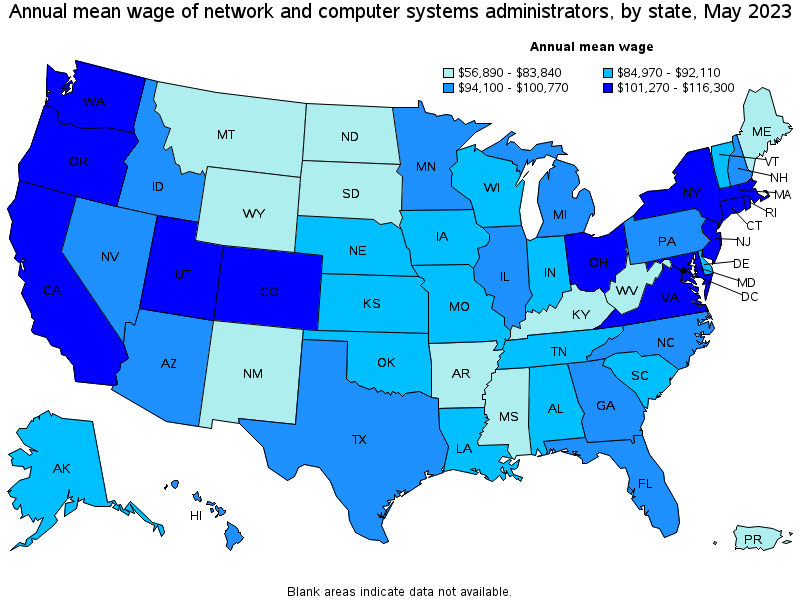
Top paying states for Network and Computer Systems Administrators:
| State | Employment (1) | Employment per thousand jobs | Location quotient (9) | Hourly mean wage | Annual mean wage (2) |
|---|---|---|---|---|---|
| Maryland | 8,040 | 3.00 | 1.41 | $ 55.91 | $ 116,300 |
| California | 29,130 | 1.62 | 0.76 | $ 55.18 | $ 114,770 |
| District of Columbia | 1,710 | 2.44 | 1.15 | $ 54.80 | $ 113,990 |
| Rhode Island | 1,420 | 2.92 | 1.37 | $ 53.95 | $ 112,220 |
| New Jersey | 11,030 | 2.62 | 1.23 | $ 53.46 | $ 111,190 |
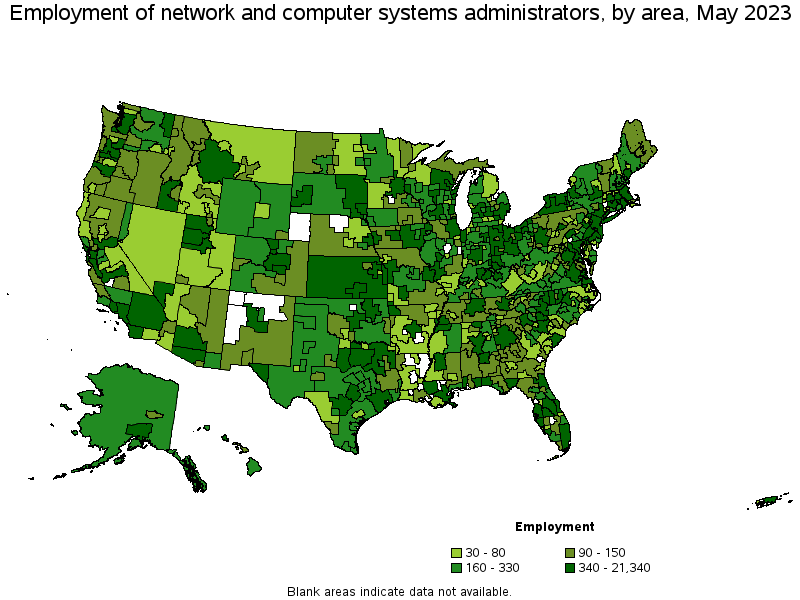
Metropolitan areas with the highest employment level in Network and Computer Systems Administrators:
| Metropolitan area | Employment (1) | Employment per thousand jobs | Location quotient (9) | Hourly mean wage | Annual mean wage (2) |
|---|---|---|---|---|---|
| New York-Newark-Jersey City, NY-NJ-PA | 21,340 | 2.25 | 1.06 | $ 56.00 | $ 116,470 |
| Dallas-Fort Worth-Arlington, TX | 12,730 | 3.21 | 1.51 | $ 47.93 | $ 99,690 |
| Washington-Arlington-Alexandria, DC-VA-MD-WV | 12,040 | 3.89 | 1.83 | $ 57.31 | $ 119,200 |
| Los Angeles-Long Beach-Anaheim, CA | 9,570 | 1.55 | 0.73 | $ 52.81 | $ 109,850 |
| Chicago-Naperville-Elgin, IL-IN-WI | 7,160 | 1.59 | 0.75 | $ 47.32 | $ 98,430 |
| Denver-Aurora-Lakewood, CO | 6,880 | 4.33 | 2.03 | $ 51.25 | $ 106,610 |
| Houston-The Woodlands-Sugar Land, TX | 6,220 | 1.96 | 0.92 | $ 49.04 | $ 102,000 |
| Boston-Cambridge-Nashua, MA-NH | 6,150 | 2.23 | 1.05 | $ 52.31 | $ 108,790 |
| Miami-Fort Lauderdale-West Palm Beach, FL | 6,030 | 2.22 | 1.04 | $ 47.96 | $ 99,750 |
| Atlanta-Sandy Springs-Roswell, GA | 6,000 | 2.13 | 1.00 | $ 48.84 | $ 101,600 |
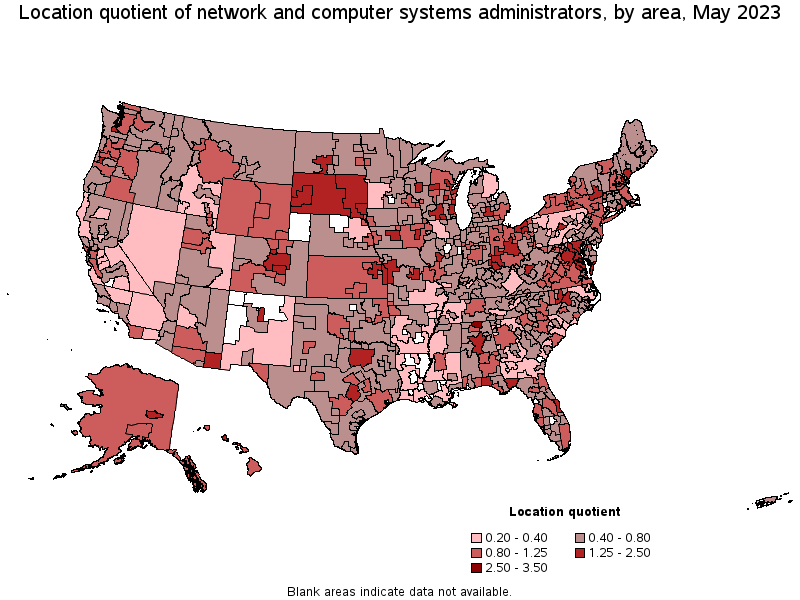
Metropolitan areas with the highest concentration of jobs and location quotients in Network and Computer Systems Administrators:
| Metropolitan area | Employment (1) | Employment per thousand jobs | Location quotient (9) | Hourly mean wage | Annual mean wage (2) |
|---|---|---|---|---|---|
| California-Lexington Park, MD | 310 | 6.53 | 3.07 | $ 56.61 | $ 117,740 |
| Huntsville, AL | 1,380 | 5.51 | 2.59 | $ 47.36 | $ 98,500 |
| Sierra Vista-Douglas, AZ | 180 | 5.27 | 2.48 | $ 43.31 | $ 90,080 |
| Colorado Springs, CO | 1,610 | 5.19 | 2.44 | $ 49.17 | $ 102,280 |
| Olympia-Tumwater, WA | 630 | 5.16 | 2.42 | $ 47.44 | $ 98,680 |
| State College, PA | 340 | 5.08 | 2.39 | $ 41.94 | $ 87,240 |
| Boulder, CO | 950 | 4.89 | 2.30 | $ 53.52 | $ 111,330 |
| Rapid City, SD | 340 | 4.70 | 2.21 | $ 34.77 | $ 72,320 |
| Urban Honolulu, HI | 2,020 | 4.61 | 2.17 | $ 46.82 | $ 97,390 |
| Dover-Durham, NH-ME | 230 | 4.47 | 2.10 | $ 48.27 | $ 100,400 |
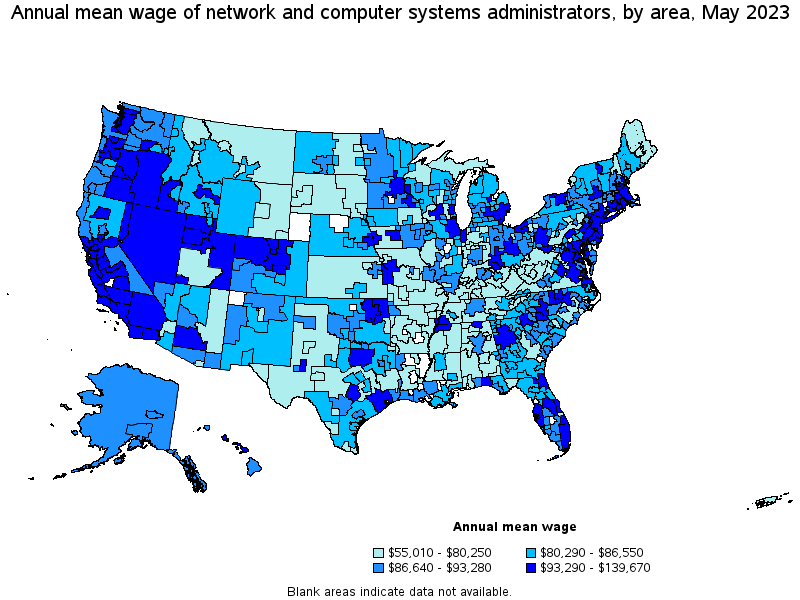
Top paying metropolitan areas for Network and Computer Systems Administrators:
| Metropolitan area | Employment (1) | Employment per thousand jobs | Location quotient (9) | Hourly mean wage | Annual mean wage (2) |
|---|---|---|---|---|---|
| San Jose-Sunnyvale-Santa Clara, CA | 2,990 | 2.62 | 1.23 | $ 67.15 | $ 139,670 |
| San Francisco-Oakland-Hayward, CA | 5,540 | 2.29 | 1.08 | $ 64.20 | $ 133,530 |
| Washington-Arlington-Alexandria, DC-VA-MD-WV | 12,040 | 3.89 | 1.83 | $ 57.31 | $ 119,200 |
| Baltimore-Columbia-Towson, MD | 3,700 | 2.84 | 1.33 | $ 57.03 | $ 118,620 |
| California-Lexington Park, MD | 310 | 6.53 | 3.07 | $ 56.61 | $ 117,740 |
| Seattle-Tacoma-Bellevue, WA | 4,790 | 2.30 | 1.08 | $ 56.43 | $ 117,380 |
| Bridgeport-Stamford-Norwalk, CT | 440 | 1.10 | 0.52 | $ 56.10 | $ 116,690 |
| New York-Newark-Jersey City, NY-NJ-PA | 21,340 | 2.25 | 1.06 | $ 56.00 | $ 116,470 |
| Norwich-New London-Westerly, CT-RI | 270 | 2.18 | 1.02 | $ 53.76 | $ 111,810 |
| Cincinnati, OH-KY-IN | 4,490 | 4.15 | 1.95 | $ 53.64 | $ 111,570 |
Nonmetropolitan areas with the highest employment in Network and Computer Systems Administrators:
| Nonmetropolitan area | Employment (1) | Employment per thousand jobs | Location quotient (9) | Hourly mean wage | Annual mean wage (2) |
|---|---|---|---|---|---|
| Kansas nonmetropolitan area | 750 | 1.92 | 0.90 | $ 36.08 | $ 75,050 |
| North Northeastern Ohio nonmetropolitan area (noncontiguous) | 580 | 1.78 | 0.84 | $ 44.81 | $ 93,190 |
| East South Dakota nonmetropolitan area | 520 | 3.93 | 1.85 | $ 33.59 | $ 69,870 |
| West Northwestern Ohio nonmetropolitan area | 490 | 1.97 | 0.92 | $ 41.94 | $ 87,220 |
| Northeastern Wisconsin nonmetropolitan area | 460 | 2.35 | 1.11 | $ 39.22 | $ 81,570 |
Nonmetropolitan areas with the highest concentration of jobs and location quotients in Network and Computer Systems Administrators:
| Nonmetropolitan area | Employment (1) | Employment per thousand jobs | Location quotient (9) | Hourly mean wage | Annual mean wage (2) |
|---|---|---|---|---|---|
| West South Dakota nonmetropolitan area | 250 | 3.98 | 1.87 | $ 31.69 | $ 65,910 |
| East South Dakota nonmetropolitan area | 520 | 3.93 | 1.85 | $ 33.59 | $ 69,870 |
| Northeast Virginia nonmetropolitan area | 140 | 2.76 | 1.30 | $ 42.11 | $ 87,580 |
| Southwest Montana nonmetropolitan area | 380 | 2.49 | 1.17 | $ 39.09 | $ 81,300 |
| Northeast Oklahoma nonmetropolitan area | 280 | 2.42 | 1.14 | $ 45.98 | $ 95,640 |
Top paying nonmetropolitan areas for Network and Computer Systems Administrators:
| Nonmetropolitan area | Employment (1) | Employment per thousand jobs | Location quotient (9) | Hourly mean wage | Annual mean wage (2) |
|---|---|---|---|---|---|
| Nevada nonmetropolitan area | 70 | 0.72 | 0.34 | $ 56.18 | $ 116,840 |
| Central Oregon nonmetropolitan area | 130 | 2.04 | 0.96 | $ 53.60 | $ 111,500 |
| Eastern Oregon nonmetropolitan area | 110 | 1.46 | 0.69 | $ 48.93 | $ 101,770 |
| Eastern Utah nonmetropolitan area | 60 | 0.67 | 0.31 | $ 47.51 | $ 98,820 |
| Northeast Oklahoma nonmetropolitan area | 280 | 2.42 | 1.14 | $ 45.98 | $ 95,640 |
These estimates are calculated with data collected from employers in all industry sectors, all metropolitan and nonmetropolitan areas, and all states and the District of Columbia. The top employment and wage figures are provided above. The complete list is available in the downloadable XLS files.
The percentile wage estimate is the value of a wage below which a certain percent of workers fall. The median wage is the 50th percentile wage estimate—50 percent of workers earn less than the median and 50 percent of workers earn more than the median. More about percentile wages.
(1) Estimates for detailed occupations do not sum to the totals because the totals include occupations not shown separately. Estimates do not include self-employed workers.
(2) Annual wages have been calculated by multiplying the hourly mean wage by a "year-round, full-time" hours figure of 2,080 hours; for those occupations where there is not an hourly wage published, the annual wage has been directly calculated from the reported survey data.
(3) The relative standard error (RSE) is a measure of the reliability of a survey statistic. The smaller the relative standard error, the more precise the estimate.
(9) The location quotient is the ratio of the area concentration of occupational employment to the national average concentration. A location quotient greater than one indicates the occupation has a higher share of employment than average, and a location quotient less than one indicates the occupation is less prevalent in the area than average.
Other OEWS estimates and related information:
May 2023 National Occupational Employment and Wage Estimates
May 2023 State Occupational Employment and Wage Estimates
May 2023 Metropolitan and Nonmetropolitan Area Occupational Employment and Wage Estimates
May 2023 National Industry-Specific Occupational Employment and Wage Estimates
Last Modified Date: April 3, 2024