An official website of the United States government
An official website of the United States government
The .gov means it's official.
Federal government websites often end in .gov or .mil. Before sharing sensitive information,
make sure you're on a federal government site.
The site is secure.
The
https:// ensures that you are connecting to the official website and that any
information you provide is encrypted and transmitted securely.
Economic data for businesses are usually constructed at the establishment level, the firm level, or the enterprise level. An establishment is a single physical location where one predominant activity occurs. A firm is an establishment or a combination of establishments and, for the purposes of this article, is defined by its unique Employer Identification number (EIN) issued by the Internal Revenue Service (IRS). Firms operate in one industry or in multiple industries. An enterprise is a firm or a combination of firms that engages in economic activities which are classified into multiple industries. An enterprise may report under one or a number of EINs.
Data users often request data at one of these levels on the assumption that the specific level sought is critical to their analytical purpose. But are such levels of aggregation significantly different? In this article, we present a profile of U.S. businesses at all three levels and quantify the differences in magnitude and trends. In particular, we estimate gross job flows by size class at the establishment, firm, and enterprise levels and assess the effect of aggregation on the level and trend of gross job flows.
We analyzed our data by size class because many users wish to track economic data by size and believe that the unit of classification is important. The perception is that multiunit businesses act as a whole rather than as a collection of individual establishments. On the one hand, it could be that larger multiunit businesses make more unified decisions to control hiring, close a plant or store, or lay off workers during economic downturns. This argument supports the use of a higher level of aggregation than the establishment level. On the other hand, businesses might make such decisions on the basis of each establishment’s profitability, product line, and longer term prospects for contributions to the overall business. Why restrict hiring at a fully profitable and growing location when other locations are suffering from insufficient demand? In this case, the firm may act more like a set of individual establishments rather than a unified set of establishments.
When it comes to EIN-defined firm-level data, as opposed to the enterprise-level data for multilocation businesses, the same argument for unified decisions at the top of the corporate structure favors data at the enterprise level. However, businesses, especially large ones, may use different EINs not merely for administrative purposes, but for economic reasons, such as making a deliberate distinction in their operation in accordance with the heterogeneity of their economic activities (e.g., differentiating between manufacturing, on the one hand, and retail and services, on the other). This distinction could also be based on giving a subsidiary independence in its decisionmaking—a distinction that is highly relevant in selecting a unit of analysis. Therefore, there are benefits in recognizing the EIN as a distinct company identifier and not combining many heterogeneous economic activities of a large enterprise into one unit of analysis.
Most businesses are single-establishment firms. Establishment-level data allow each individual location to be classified into a specific industry. This kind of classification is critically important to local decisionmakers and to businesses deciding where to locate.
For multiestablishment businesses, firm-level data are important for understanding corporate-level decisions. However, multiestablishment firms do not always respond uniformly to economic events. Corporate decisionmakers may make decisions that are based on overall corporate objectives or, alternatively, may look at specific product lines and specific demand conditions. For example, a chain of restaurants might respond to a nationwide recession by reducing hiring uniformly in order to preserve cash levels. Or the corporate leadership might examine specific locations for slumping demand and restrict hiring in those locations or, instead, decide to close unprofitable locations on a case-by-case basis. One could argue that, if the firm makes case-by-case decisions, then it is really acting more like a series of establishments. Note that we are focused here on the decisions of establishments, firms, and enterprises that affect employment and wages. Enterprise-level data, like firm-level data, are needed to understand the behavior of the national economy, top-to-bottom decisionmaking, corporate planning, and policymaking as they relate to employment and wages. Also, corporate-level data at the highest level of aggregation may be useful for international comparisons.
Firm- and enterprise-level data present some issues for users. For example, many firms cross state lines, making accurate state or local data somewhat difficult to construct. Furthermore, firms in more than one industry pose similar issues regarding the accuracy of data. If we place the entire firm in a single, perhaps dominant industry, we may overstate the significance of one industry while understating the others.
Table 1 gives a summary of uses, along with the strengths and weaknesses, of the foregoing units of analysis. To have a better understanding of corporate business decisions, we need data at all three levels of aggregation. However, when data are not available at all levels, we need to know the significance of the differences. Quantifying these differences is the motivation for this article.
| Unit of analysis | Uses | Strengths | Weaknesses |
|---|---|---|---|
Establishment | Measuring economic activity at precise industry and geographic locations. Data are available at the national, state, and county levels. | Measures economic activity at the precise geographic (down to the county level) and detailed industry level (up to the six-digit NAICS code). Establishment-level data are critical to the full range of local decisions on training and economic development. At this level, comparisons across other local levels are possible if firm or enterprise identifiers are available. Higher level data (firm or enterprise) lose the ability to profile accurately by industry because cross-industry businesses cannot be uniquely assigned to a single industry. | May not be the unit that determines economic decisions (profit maximization, hiring, etc.). Establishment data may not demonstrate the parent company's behavior. |
Firm | Measuring economic activity in multiestablishment firms. | Measures “firm behavior” and how firms adjust to economic conditions. | Less precise industry and geographic information, because a firm may have multiple locations and multiple industries. |
Enterprise | Measuring economic activity at the corporate level. National and international comparisons (global supply chains) are possible. | Measures “enterprise behavior” and how enterprises adjust to economic conditions. Data at this level are needed for the full national picture and full business behavior view. Also, enterprise level data are valued for comparisons at the international level. | Less precise industry and geographic information, because an enterprise may have multiple locations and multiple industries. |
| Source: U.S. Bureau of Labor Statistics. | |||
The rest of the article is organized as follows: First, we discuss business identifiers of the establishment, firm, and enterprise level. Next, we report on the profile of U.S. multilocation businesses by enterprise and contrast those businesses with businesses at the firm level. Then, we report the results of Business Employment Dynamics (BED) gross job gains and losses at the establishment, firm, and enterprise levels by aggregating job flows for companies with single and companies with multiple tax identification numbers. Finally, we evaluate whether adopting the enterprise structure and generating data at a broader definitional level will change our interpretation of the BED firm-size data in any way.
Federal statistical agencies collect different business identifiers. Some agencies can publish business data at one or more levels on the basis of the availability of these identifiers. For example, the Bureau of Labor Statistics (BLS) business universe frame, the Quarterly Census of Employment and Wages (QCEW), measures business activity at the lowest level possible: the establishment level. For multiunit businesses, establishment-based information is important so that each establishment—along with its employment and wages—can be placed in the correct industry and specific geographic location. The QCEW obtains the breakouts for multiunit businesses from its Multiple Worksite Report (MWR). This quarterly report is obtained under unemployment insurance (UI) reporting laws with built-in detail that makes the QCEW a unique business register in its degree of accuracy at the establishment level. The MWR promptly identifies establishment births and deaths, because businesses must report new locations and because they have an incentive to show closing locations.
The QCEW, however, is essentially an establishment-based business register. The establishment-based reporting serves well for survey sampling. It is critical that survey samples represent the “universe” of businesses—an achievement that can be done only with an accurate depiction of the business details. The QCEW can also publish data at the firm level, given that the EIN identifier for each record represents a legal entity for a vast majority of multiestablishment employers that operate across different industries and regions in the private sector. The QCEW does not, however, have an enterprise identifier through its normal reporting and lacks data collection vehicles to link EINs under common ownership and control.
The IRS requires all active businesses to file a federal income tax return. Parent companies have the option of filing a consolidated return for all affiliated companies or filing separate returns. Because the IRS is unable to obtain establishment breakouts for multiunit businesses, it publishes data from its bulletin Statistics of Income generally at the firm level and not fully at the enterprise level.
The U.S. Census Bureau is able to collect establishment-level data from its Economic Census every 5 years and data on those businesses with employment greater than 250 in the intervening years. The Census Bureau identifies the enterprise as the entire economic unit that is under common ownership or control (defined as owning more than 50 percent of the voting stock). An enterprise includes all establishments, subsidiaries, and divisions with the same or different EINs under the same ownership. The Census Bureau also obtains EIN-based data from the IRS regularly and updates the information annually from the Report of Organization Survey and other surveys.
The QCEW longitudinal database contains both establishment and firm identifiers. BLS obtained enterprise linkages under a data-sharing agreement with the Census Bureau in 2012. As a part of this agreement, we incorporated the Census-assigned enterprise codes into the QCEW longitudinal database and developed new BED data for enterprises. Currently, in the BED job flow calculation, the establishment-level data are measured by tracking employment changes at a single unit identified by unemployment insurance (UI) numbers and reporting unit numbers (RUNs), and the firm-level data are measured by aggregating employment for all establishments under the same EIN. The Census enterprise code provides a new level of aggregation encompassing all of the various activities of the same parent company that are reported under different EINs.
In March 2011, Census files had information on 168,000 multiunit enterprises that owned and operated approximately 1.9 million establishments across the nation. The 168,000 parent companies in the Census business register represented 301,000 EINs. The difference between the number of parent companies and the number of EINs reveals that companies possess and report more than one EIN and shows the extent of the difference in the number of businesses using the EIN or the Census company code as a business identifier. However, in 2011, a total of 128,000 multilocation companies reported only one EIN. That leaves 40,000 businesses with multiple EINs, according to the Census business register. During the same period, using the EIN as the parent company identifier, the QCEW reported that a total of 294,000 multilocation firms owned 2.3 million establishments. (See table 2.)
| Category | Census Bureau file | QCEW file | ||||||||
|---|---|---|---|---|---|---|---|---|---|---|
| 2007 | 2008 | 2009 | 2010 | 2011 | 2007 | 2008 | 2009 | 2010 | 2011 | |
Number of enterprise codes | 186 | 177 | 176 | 173 | 168 | – | – | – | – | – |
Number of EINs | 317 | 311 | 309 | 305 | 301 | 281 | 289 | 291 | 289 | 294 |
Number of establishments | 1,844 | 1,872 | 1,866 | 1,878 | 1,885 | 2,190 | 2,283 | 2,323 | 2,306 | 2,346 |
Note: Dash indicates QCEW has no enterprise codes. Sources: U.S. Census Bureau and U.S. Bureau of Labor Statistics. | ||||||||||
Do the 40,000 enterprises with more than one EIN make a significant difference in the measures of employment dynamics? Employment dynamics measure job flows in terms of business births, deaths, growth, and decline over a given period (a quarter or a year) and measure net employment change as the difference between job inflows and job outflows. This approach is in contrast to the standard static employment data, which show employment levels at various points in time and measure changes as the difference between levels. The BED program measures gross job gains created by units that open or expand, and gross job losses by units that close or contract, over the course of a quarter or a year.1 The magnitude of these gains and losses depends on whether the unit of analysis is an establishment or a firm. For single establishments, which constitute two-thirds of the total records in the BED and 43 percent of total employment, this distinction is irrelevant, since the establishment is the firm. For multilocation firms, however, the estimates of job flows by openings, closings, expansions, and contractions at the firm level are lower than they are at the establishment level. The reason is that expansions in some units of a multiestablishment firm may be offset by contractions in other units and make the total expansions or contractions for the firm less than the sum of the individual expansions or contractions. Moreover, if a multilocation retailer opens a new branch, it would be counted as an opening at the establishment level but an expansion at the firm level. The net change in employment will not be affected by the unit of measurement. However, both flow measures and net change will be different with regard to employment dynamics by size class.
In the QCEW, firms are identified by EIN, which is a reasonable proxy for identifying firms in the BED size-class data. However, table 2 shows that some firms—especially large firms operating across many states and industries—possess more than one EIN, for a variety of reasons.2 Through its Economic Census and Annual Report of Organization Surveys, the Census Bureau has identified these companies and lists them under the same ownership by issuing a company identifier or an enterprise code. We merged the Census multifirm records with QCEW data by their common EINs, transferred company code information from the Census file into the QCEW, and calculated the BED by aggregating employment for all establishments under the same enterprise code. We then compared the results of the BED calculation of gross job gains and gross job losses at the enterprise level with the corresponding results at the firm and establishment levels. Table 3 shows the differences in gross job flows, as well as the number of units at the national level, among these three units of measurement.
| Level of aggregation | Employment level | Gross job gains | Gross job losses | ||||||
|---|---|---|---|---|---|---|---|---|---|
| March 2010 | March 2011 | Net change | Total | Expanding units | Opening units | Total | Contracting units | Closing units | |
Employment | |||||||||
Establishment | 103,524 | 105,430 | 1,905 | 11,621 | 8,331 | 3,289 | 9,715 | 6,645 | 3,070 |
Firm | 103,525 | 105,431 | 1,906 | 9,225 | 7,047 | 2,178 | 7,319 | 5,215 | 2,104 |
Enterprise | 103,525 | 105,431 | 1,906 | 8,745 | 6,627 | 2,118 | 6,839 | 4,789 | 2,050 |
Number of units | |||||||||
Establishment | 6,672 | 6,707 | 34 | 2,506 | 1,732 | 774 | 2,381 | 1,642 | 740 |
Firm | 4,799 | 4,823 | 24 | 1,793 | 1,224 | 569 | 1,686 | 1,140 | 546 |
Enterprise | 4,721 | 4,744 | 24 | 1,759 | 1,192 | 567 | 1,654 | 1,111 | 543 |
| Source: U.S. Bureau of Labor Statistics. | |||||||||
As expected, the net employment change remains the same for all levels of aggregation, but the magnitude of gross job flows varies with the unit of analysis chosen. There is a higher level of churning when job flows are estimated at a lower level of aggregation (the establishment). At a higher level of aggregation (the enterprise or firm), expansions in some units offset contractions in other units, leaving job flows at a lesser magnitude. For example, if a multiunit firm expands employment in some units and reduces employment in others over a given period, so that the total employment of the firm remains unchanged over the period, then the impact of labor turnover in the firm on both total gross job gains and total gross job losses will be zero. However, job gains and losses at single units of this firm will add directly to the total gross job gains and gross job losses when estimated at the establishment level. For this reason, gross job gains and gross job losses are always higher at the establishment level than the firm level, and at the firm level than the enterprise level. Similarly, the number of openings and employment from openings are also lower at the enterprise level than at the firm and establishment levels. These openings are counted as expansions at a higher level of definition of a firm.
The gap between BED data elements measured at the firm level and at the enterprise level is not as significant as the gap between BED data elements measured at the firm level and at the establishment level. For the total number of units, there were 6,707,000 active establishments in the U.S. private sector in March 2011, compared with 4,823,000 active firms and 4,744,000 active enterprises. The difference between the number of firms and the number of enterprises suggests that, for the year ending March 2011, a total of 79,000 firms in the BED could have been linked with other firms.3 The enterprise data showed 2,349 fewer openings and 2,551 fewer closings in the same period and reduced both the number of job-gaining firms and the number of job-losing firms by 32,000 each. The enterprise aggregation reduced the total gross job gains and total gross job losses by 480,000 jobs each. The 480,000 figure represented 5.5 percent of total gross job gains.
In addition to producing effects on the magnitude of gross job flows, a higher level of aggregation affects the size distribution of employers across the nine size-class categories that the BED publishes. (See tables 4 and 5.) We found that the enterprise-level data have less employment in each of the eight size-class categories up to 999 employees and more employment in the size-class category of 1,000 or more employees. We found nearly the same thing for the number of units: the enterprise aggregation reduces the number of units in all nine size classes, with a higher reduction in the smaller size classes.
| Initial size class | Employment level | Gross job gains | Gross job losses | ||||||
|---|---|---|---|---|---|---|---|---|---|
| March 2010 | March 2011 | Net change | Total | Expanding units | Opening units | Total | Contracting units | Closing units | |
Employment | |||||||||
Total | 103,525 | 105,431 | 1,906 | 8,745 | 6,627 | 2,118 | 6,839 | 4,789 | 2,050 |
1 to 4 employees | 5,479 | 6,049 | 571 | 1,699 | 919 | 781 | 1,128 | 387 | 742 |
5 to 9 employees | 6,162 | 6,253 | 91 | 1,075 | 669 | 406 | 984 | 596 | 388 |
10 to 19 employees | 7,531 | 7,609 | 77 | 1,067 | 711 | 356 | 989 | 659 | 331 |
20 to 49 employees | 10,426 | 10,559 | 133 | 1,221 | 882 | 339 | 1,087 | 780 | 307 |
50 to 99 employees | 7,341 | 7,448 | 107 | 722 | 584 | 137 | 615 | 474 | 141 |
100 to 249 employees | 8,839 | 9,016 | 177 | 731 | 662 | 69 | 554 | 474 | 80 |
250 to 499 employees | 5,860 | 5,998 | 138 | 423 | 406 | 17 | 285 | 257 | 28 |
500 to 999 employees | 5,549 | 5,650 | 101 | 334 | 326 | 8 | 233 | 224 | 8 |
1,000 or more employees | 46,338 | 46,848 | 510 | 1,474 | 1,469 | 5 | 964 | 937 | 26 |
Number of units | |||||||||
Total | 4,721 | 4,744 | 24 | 1,759 | 1,192 | 567 | 1,654 | 1,111 | 543 |
1 to 4 employees | 2,676 | 2,694 | 18 | 931 | 468 | 462 | 761 | 317 | 444 |
5 to 9 employees | 938 | 941 | 3 | 337 | 273 | 63 | 383 | 323 | 60 |
10 to 19 employees | 561 | 563 | 2 | 228 | 201 | 27 | 256 | 231 | 25 |
20 to 49 employees | 348 | 349 | 1 | 159 | 147 | 12 | 164 | 153 | 11 |
50 to 99 employees | 107 | 107 | 0 | 54 | 52 | 2 | 50 | 48 | 2 |
100 to 249 employees | 58 | 58 | 0 | 31 | 31 | 1 | 26 | 25 | 1 |
250 to 499 employees | 17 | 17 | 0 | 10 | 10 | 0 | 7 | 7 | 0 |
500 to 999 employees | 8 | 8 | 0 | 5 | 5 | 0 | 3 | 3 | 0 |
1,000 or more employees | 8 | 8 | 0 | 5 | 5 | 0 | 3 | 3 | 0 |
| Source: U.S. Bureau of Labor Statistics. | |||||||||
| Initial size class | Employment level | Gross job gains | Gross job losses | ||||||
|---|---|---|---|---|---|---|---|---|---|
| March 2010 | March 2011 | Net change | Total | Expanding units | Opening units | Total | Contracting units | Closing units | |
Employment | |||||||||
Total | 103,525 | 105,431 | 1,906 | 9,225 | 7,047 | 2,178 | 7,319 | 5,215 | 2,104 |
1 to 4 employees | 5,502 | 6,082 | 580 | 1,712 | 929 | 783 | 1,132 | 388 | 744 |
5 to 9 employees | 6,221 | 6,320 | 98 | 1,090 | 681 | 408 | 991 | 601 | 390 |
10 to 19 employees | 7,685 | 7,772 | 86 | 1,092 | 731 | 361 | 1,005 | 669 | 336 |
20 to 49 employees | 10,974 | 11,132 | 159 | 1,289 | 937 | 352 | 1,130 | 812 | 319 |
50 to 99 employees | 8,236 | 8,372 | 136 | 810 | 659 | 151 | 674 | 523 | 151 |
100 to 249 employees | 10,609 | 10,819 | 210 | 862 | 782 | 81 | 652 | 565 | 87 |
250 to 499 employees | 7,285 | 7,426 | 141 | 508 | 489 | 20 | 368 | 334 | 34 |
500 to 999 employees | 7,120 | 7,222 | 102 | 421 | 406 | 15 | 319 | 303 | 16 |
1,000 or more employees | 39,892 | 40,285 | 393 | 1,440 | 1,432 | 8 | 1,047 | 1,019 | 28 |
Number of units | |||||||||
Total | 4,799 | 4,823 | 24 | 1,793 | 1,224 | 569 | 1,686 | 1,140 | 546 |
1 to 4 employees | 2,686 | 2,704 | 18 | 934 | 470 | 463 | 763 | 318 | 445 |
5 to 9 employees | 946 | 949 | 3 | 340 | 276 | 64 | 386 | 326 | 61 |
10 to 19 employees | 572 | 574 | 2 | 233 | 206 | 27 | 261 | 235 | 26 |
20 to 49 employees | 365 | 366 | 1 | 167 | 155 | 12 | 171 | 160 | 11 |
50 to 99 employees | 120 | 120 | 0 | 60 | 58 | 2 | 55 | 53 | 2 |
100 to 249 employees | 70 | 70 | 0 | 37 | 36 | 1 | 31 | 31 | 1 |
250 to 499 employees | 21 | 21 | 0 | 12 | 12 | 0 | 9 | 9 | 0 |
500 to 999 employees | 10 | 10 | 0 | 6 | 6 | 0 | 5 | 5 | 0 |
1,000 or more employees | 9 | 9 | 0 | 5 | 5 | 0 | 4 | 4 | 0 |
| Source: U.S. Bureau of Labor Statistics. | |||||||||
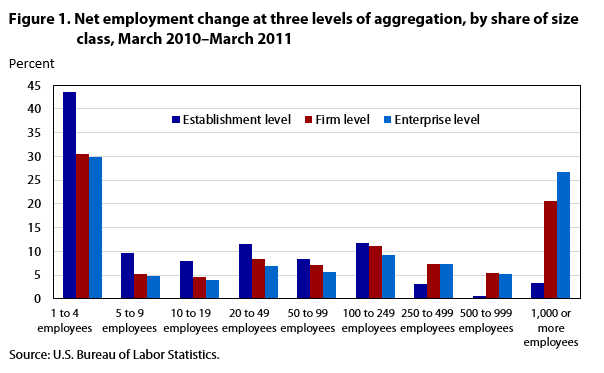
Are these changes large enough to have significant implications for the relative contributions of small and large firms to employment growth? Table 6 shows the share of the net employment change for each size class, for the year ending March 2011, for all three levels of aggregation. There is a wide gap between the size-class shares at the establishment level, on the one hand, and both firm and enterprise levels, on the other. The shares, however, are moderately close between the firm and enterprise levels. Data show that a shift from the firm to the enterprise level of aggregation reduces the share of companies with 1 to 999 employees by 6.2 percentage points and increases the share of companies with 1,000 or more employees by the same magnitude. The change, however, does not alter the ranking of each size class or the relative contribution of each to the total net change. Firms with 1 to 4 employees remain the largest contributors, followed by firms with 1,000 or more employees. Other size classes also kept their relative rankings unchanged under both definitions.
| Size class (number of employees) | Establishments | Firms | Enterprises |
|---|---|---|---|
Total | 100.0 | 100.0 | 100.0 |
1 to 4 | 43.7 | 30.4 | 30.0 |
5 to 9 | 9.6 | 5.2 | 4.8 |
10 to 19 | 8.0 | 4.5 | 4.1 |
20 to 49 | 11.5 | 8.3 | 7.0 |
50 to 99 | 8.3 | 7.2 | 5.6 |
100 to 249 | 11.8 | 11 | 9.3 |
250 to 499 | 3.2 | 7.4 | 7.2 |
500 to 999 | .6 | 5.4 | 5.3 |
1,000 or more | 3.4 | 20.6 | 26.8 |
| Source: U.S. Bureau of Labor Statistics. | |||
Figure 1 shows the share of net employment change by size class for all three levels of aggregation. One finding is that, between the firm and establishment levels, there is a shift in share from establishments with 1 to 249 employees to firms with 250 or higher, while there is a shift in share from firms with 1 to 999 employees to firms with 1,000 or more employees between the firm and enterprise levels.
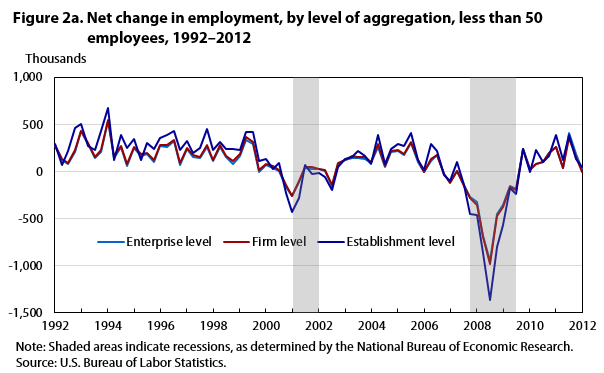
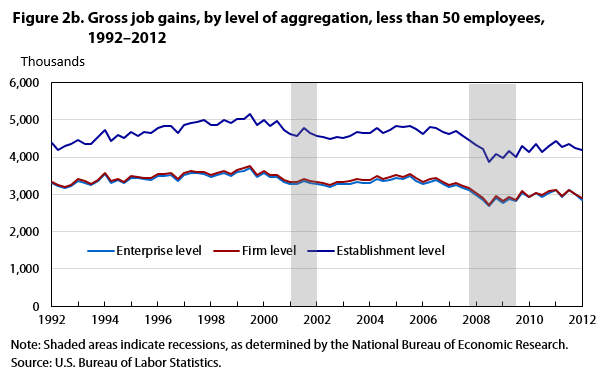
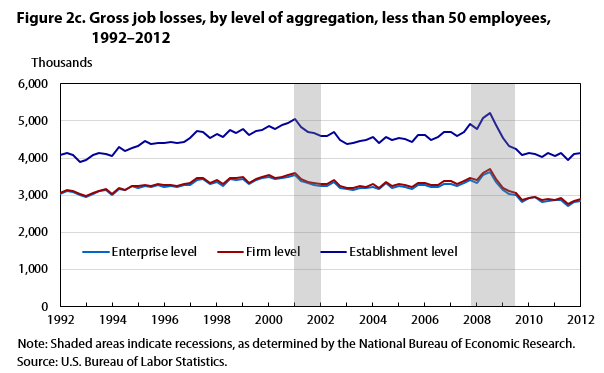
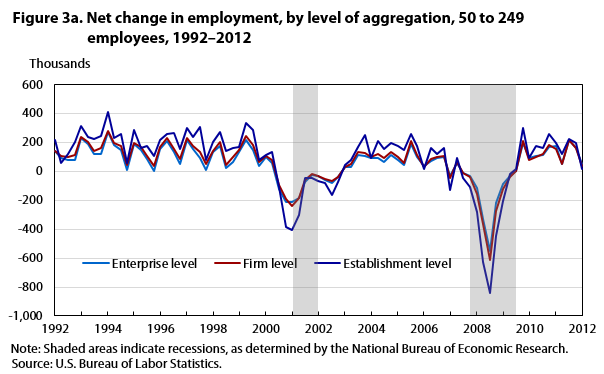
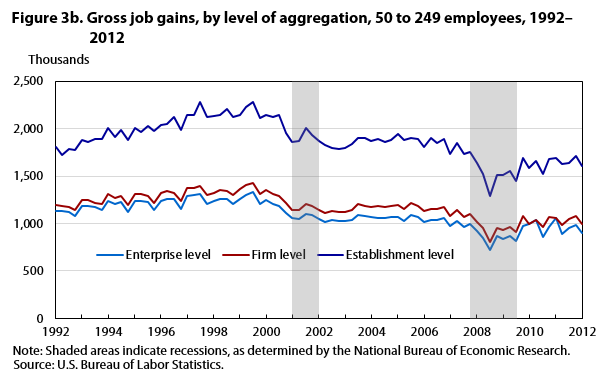
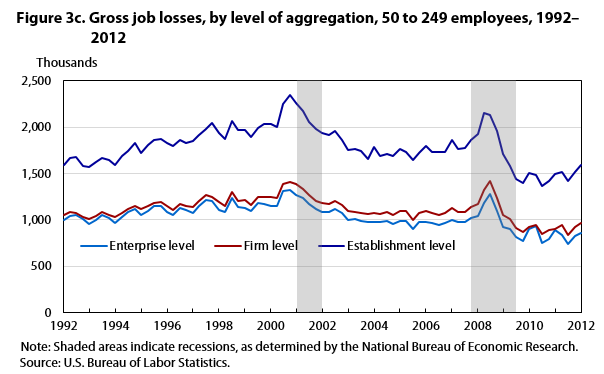
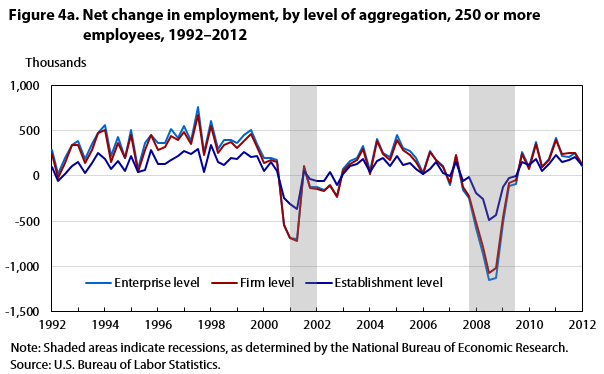
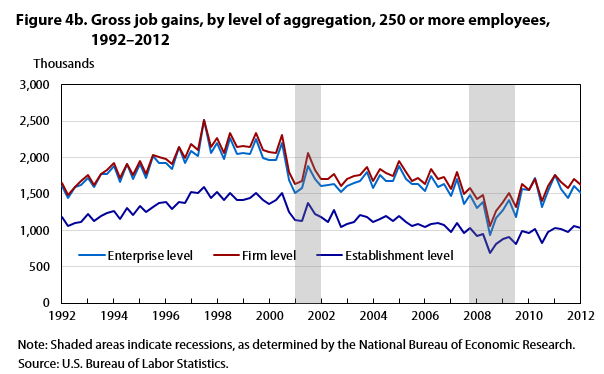
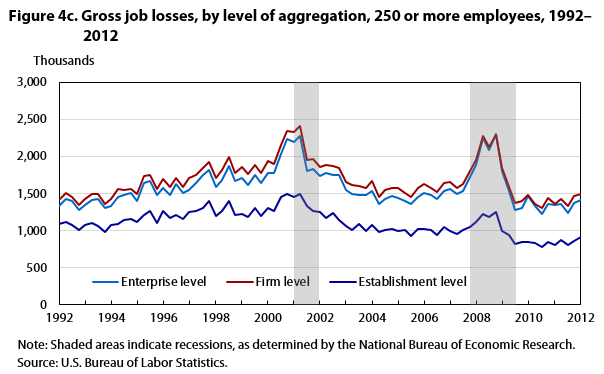
How do the two measures differ over a longer timeframe and over the phases of business cycles? The differences in the BED data elements between using EINs and using the enterprise codes as shown in tables 3–5 highlight only one observation: for the year ending March 2011. Looking over the period from 2007 to 2011, we matched the enterprise codes and corresponding EINs, and merged them with QCEW EINs from the third quarter of 1992 to the first quarter of 2012. The enterprise identifiers for 2007 were used for all quarters prior to March 2007, and the enterprise codes for 2011 were used for 2012 merged records. The standard BED tabulating procedures and the dynamic-sizing method were applied in calculating gross job gains and gross job losses at the enterprise level. The series were then seasonally adjusted and compared against the same estimates at the firm and establishment levels. Figures 2a–c, 3 a–c, and 4 a–c show the net employment change, gross job gains, and gross job losses by major size classes.
Two findings emerge from these figures. First, gross job flows by size class at the enterprise level are very close to gross job flows at the firm level. Second, the gap between the two series is stable and does not change noticeably over time, making the patterns similar. In particular, business cycle properties of the series remain intact and the increase in gross job losses and the drop in gross job gains and in net employment change coincide in both the 2001 and 2007–09 recessions as defined by the National Bureau of Economic Research. In a similar study comparing size classes by firm and establishment data,4 the peak-to-trough analysis yielded two findings: similar cyclical movements, and different magnitudes of net employment change, across all nine size classes. Adding an enterprise level to the mix, we found similar cyclical movements and an extremely close magnitude of net employment change between the firm and enterprise size classes. Compared with firm-level data, BED enterprise size-class data are slightly lower in gross job gains, gross job losses, and net employment changes in size classes of less than 1,000 employees and higher in enterprises with 1,000 or more employees. However, as table 6 shows, the relative ranking of the size classes in terms of their contributions to employment growth remains unchanged.
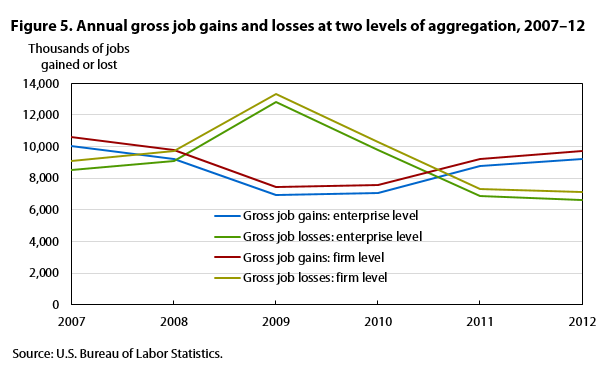
We also made annual estimates of gross job gains and losses for 2007 through 2012. The results are shown in figure 5, and they indicate that the differences in the magnitude of gross job gains and gross job losses between the firm and enterprise levels are somewhat larger than they are in the quarterly data (because of a higher level of job flows in the annual estimation). Even then, the gap remained stable and showed more consistency over time.
The BED quarterly and annual enterprise-level series were consistently close to the firm-level series, and the size-class data based on both levels of aggregation were not substantially different and followed a similar pattern of peaks and troughs over the business cycle. With these findings, it appears that the current BLS approach of using employer’s EINs as a proxy for company identifiers generates firm-based employment dynamics data that are uniform, dependable, and consistent with other employment series, including Census Bureau data. Although there are differences in the level of job flows based on firm and enterprise estimates, the similarity in the trend data, stability in the relative share of the size-class data, and the fact that BLS data are more frequent (quarterly) and more up to date (available 7 months after the close of the quarter) provide users a powerful tool for understanding employment dynamics. However, data sharing and the use of the Census enterprise code on a continual basis will help BLS to identify parent companies within the QCEW business register.
The QCEW and Census business registers are both coherent and consistent by themselves, but there are differences in their source, the periodicity of the data, and their definitions and collection methods. The Census data come mainly from the Economic Census and annual Report of Organization Surveys and other administrative records. The QCEW data, by contrast, are compiled from a single source: the quarterly contribution reports on the employment and wages of workers covered by UI law. The QCEW’s business register is updated quarterly, whereas the Census business register is updated on a broad basis every 5 years by the Economic Census and on a limited basis annually. Despite difficulties in matching records, the information in these two registers, which is derived from different sources, can complement each other and, if shared, can improve the quality of both registers, especially if used for all records. The QCEW provides data on employment and wages, and information on mergers, acquisitions, spinoffs, and other corporate restructurings, on a quarterly basis. The information is robust, accurate, and timely at the establishment level as well as at the EIN-based firm level. The Census business register carries valuable information on corporate structures and company organizations across states. Both statistical agencies can benefit from sharing various aspects of their registers.
Akbar Sadeghi, David M. Talan, and Richard L. Clayton, "Establishment, firm, or enterprise: does the unit of analysis matter?," Monthly Labor Review, U.S. Bureau of Labor Statistics, November 2016, https://doi.org/10.21916/mlr.2016.51
1 For a thorough description of the concepts, linkage methodology, and definitions associated with BED, see James Spletzer, Jason Faberman, Akbar Sadeghi, David Talan, and Richard Clayton, “Business employment dynamics: new data on gross job gains and losses,” Monthly Labor Review, April 2004, pp. 29–42, https://www.bls.gov/opub/mlr/2004/04/art3full.pdf.
2 For reasons when a new EIN is needed, see Do you need a new EIN? (Internal Revenue Service, July 14, 2016), https://www.irs.gov/businesses/small-businesses-self-employed/do-you-need-a-new-ein.
3 79,000 is the difference between the number of firms defined by EINs and the number of firms defined by the Census Bureau company identifiers.
4 See Sherry Dalton, Erik Friesenhahn, James Spletzer, and David Talan, “Employment growth by size class: firm and establishment data,” Monthly Labor Review, December 2011, pp. 3–12, https://www.bls.gov/opub/mlr/2011/12/art1full.pdf.