An official website of the United States government
An official website of the United States government
The .gov means it's official.
Federal government websites often end in .gov or .mil. Before sharing sensitive information,
make sure you're on a federal government site.
The site is secure.
The
https:// ensures that you are connecting to the official website and that any
information you provide is encrypted and transmitted securely.
Out of the 8.4 million workers employed in the education, training, and library occupations throughout the United States in 2014, 27 died on the job and 36,540 had nonfatal occupational injuries and illnesses that resulted in days away from work.1 Compared with all workers in the United States, those in the education, training, and library occupations (henceforth referred to as “educators”) were at less risk of both fatal injuries and nonfatal injuries and illnesses.2 The fatal injury incidence rate for educators, at 0.4 per 100,000 workers, was significantly lower than the rate for all workers (3.4 per 100,000 workers). Likewise, the nonfatal injury and illness incidence rate for educators for days away from work was 59 cases per 10,000 full-time workers and was almost half the rate for all workers at 107.1 per 10,000 full-time workers. All work injuries and illnesses are unfortunate, but among them, events of violence and other injuries by persons or animals (henceforth referred to as “violent events”) stand out as preventable. Violent events from 2011 through 2014 composed 27 percent (29 deaths) of the fatal injuries of educators. In 2014, they composed 24 percent of the nonfatal days-away-from-work cases (8,620 cases) that educators experienced. This article explores occupational fatal injuries and nonfatal injuries and illnesses that resulted in days away from work for educators, with a focus on violent events.
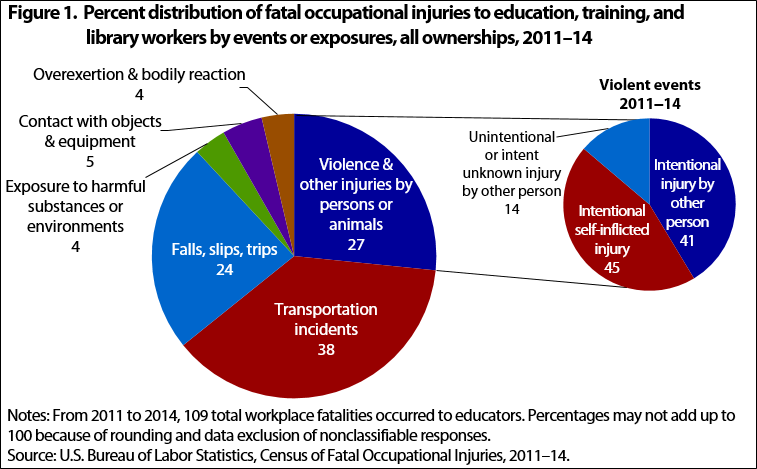
For this article, violent events are considered any event that falls into event category 1 in the Occupational Injury and Illness Classification System 2.01 coding structure.3 This category includes all intentional injuries (homicides and suicides), injuries involving weapons, and injuries from direct physical contact by another person or oneself. From 2011 through 2014, 109 educators were fatally injured on the job.4 Violent events accounted for 27 percent of fatal injuries (29 deaths) to educators and were the second most frequent type of fatal incident after transportation incidents (see figure 1). Of the educators who were fatally injured in violent events from 2011 through 2014, 69 percent (20 of the 29) were employed in state or local government.5Of the 29 violent deaths, 25 were reported as intentional injuries by persons (this category includes injuries by other persons and self-inflicted injuries or suicides). Self-inflicted intentional injuries numbered 13 of the 29 violent fatalities (45 percent), and intentional injuries (i.e., homicides) by other person were the second most common fatal violent event, with 12 fatalities. Among the educators who were victims of homicides from 2011 through 2014, eight occurred as intentional shootings by other persons (67 percent). Four cases were classified as “injury by other person—unintentional or intent unknown.” These cases can include accidental shootings or physical contact during activities such as sports or attempts to restrain another person.
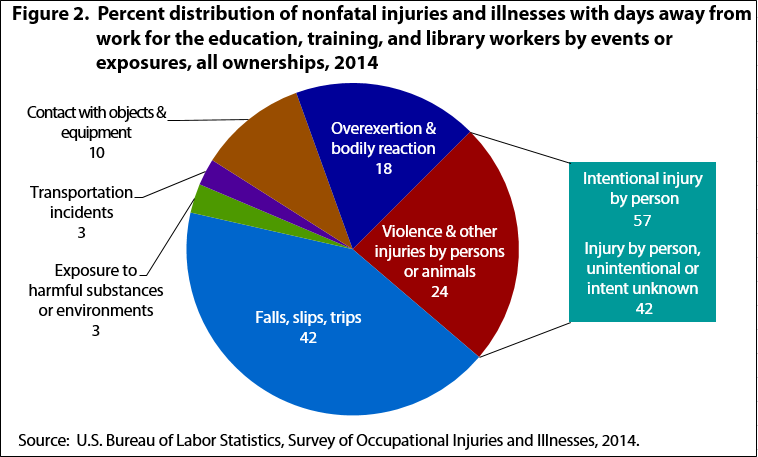
Of the 36,540 nonfatal injuries and illnesses that resulted in days away from work reported in 2014 for educators,6nearly a quarter (8,620 cases) were the result of violent events (see figure 2). The share of the number of violent events to all nonfatal days-away-from-work cases was more than three times higher for educators than for all workers in the United States in 2014. Also, the incidence rate of violent events among educators (13.9 per 10,000 full-time workers) was almost twice the incidence rate (6.8) of violent events for all workers in the United States. Compared with major occupation groups with high rates of violent nonfatal events, educators were at low risk. For example, protective service workers (such as police officers or fire fighters) or healthcare support workers (such as home health aides or personal care assistants) had higher rates, at least by a factor of two, of violent events at work than educators (see table 1).
Surpassed only by falls, slips, and trips in number of days-away-from-work cases, violent events were the second most frequent nonfatal event. Violent events were split by intent, with 57 percent (4,910 cases) categorized as intentional injury by person and 42 percent (3,580 cases) categorized as unintentional or intent-unknown injury by person. Three-quarters of violent events to educators occurred among workers in local government with 6,550 cases, followed by 1,930 cases in private industry, and 140 cases in state government. This pattern was similar to both the distribution of total employment by ownership of educators across the United States as well as the distribution of total number of nonfatal cases by ownership involving days away from work in 2014.7
| Major occupation groups (1) | Incidence rate for events of violence and other injuries by persons or animals | Total incidence rate |
|---|---|---|
Protective service | 68.4 | 298.7 |
Healthcare support | 37.3 | 220.6 |
Community and social service | 24.1 | 94.9 |
Personal care and service | 23.1 | 110.3 |
Farming, fishing, and forestry | 19.7 | 149.8 |
Healthcare practitioners and technical | 15.0 | 103.6 |
Education, training, and library | 13.9 | 59.0 |
All workers | 6.8 | 107.1 |
Arts, design, entertainment, sports, and media | 6.7 | 47.9 |
Building and grounds cleaning and maintenance | 4.4 | 258.5 |
Construction and extraction | 3.2 | 189.5 |
Installation, maintenance, and repair | 2.3 | 202.9 |
Life, physical, and social science | 2.1 | 37.1 |
Management | 1.9 | 36.9 |
Sales and related | 1.7 | 51.8 |
Food preparation and serving related | 1.2 | 96.9 |
Office and administrative support | .9 | 50.4 |
Production | .7 | 136.5 |
Business and financial operations | .5 | 15.7 |
Architecture and engineering | .2 | 18.8 |
Computer and mathematical | .1 | 8.3 |
Legal | (2) | 15.5 |
Notes: (1) Data on transportation occupations and military-specific occupations are not displayed. Data on the transportation occupations were only available for private industry (i.e., not for all ownerships). The Survey of Occupational Injuries and Illnesses does not collect data on military personnel. (2) Data did not meet publication guidelines because of rounding and data exclusion of nonclassifiable responses or because data were too small to be displayed. Note: Major occupations are grouped according to the “2010 Standard Occupational Classification Manual,” Office of Management and Budget. The incidence rates represent the number of injuries and illnesses per 10,000 full-time workers. Source: U.S. Bureau of Labor Statistics, Survey of Occupational Injuries and Illnesses, 2014. | ||
For educators in 2014, the total days-away-from-work incidence rate per 10,000 full-time workers was statistically the same for those employed in private industry and those employed by local governments (69.3 and 66.3, respectively) (see table 2). However, local government educators experienced a higher rate of violent events than those in the private industry (17.0 and 13.5, respectively).
| Characteristic | All educators | Pre-K–12 educators(1) |
|---|---|---|
Total all ownerships | ||
All events or exposures | 59.0 | (2) |
Violent events or exposures | 13.9 | — |
Local government | ||
All events or exposures | 66.3 | 49.2 |
Violent events or exposures | 17.0 | 8.9 |
Private industry | ||
All events or exposures | 69.3 | 85.8 |
Violent events or exposures | 13.5 | 12.4 |
State government | ||
All events or exposures | 16.9 | — |
Violent events or exposures | 2.2 | — |
Notes: (1) Pre-K-12 educators represent the minor occupation group "preschool, primary, secondary, and special education school teachers," with code 25-2000 according to the "2010 Standard Occupational Classification Manual,” (https://www.bls.gov/soc/2010/). (2) The total all ownership rate for pre-K–12 educators is not available for all events or exposures and violent events because the state government rates were not available. Note: Incidence rates for days-away-from-work cases are calculated per 10,000 full-time workers. Dash indicates data not available. Source: U.S. Bureau of Labor Statistics, Survey of Occupational Injuries and Illnesses, 2014. | ||
However, this pattern of local government educators having higher rates than those of private industry educators did not hold among preschool, primary, secondary, and special education school teachers (henceforth referred to as “pre-K–12 teachers”). Private industry pre-K–12 teachers had higher rates of both total nonfatal cases and violent events than local government pre-K–12 teachers. In fact, the total nonfatal incidence rate for private pre-K–12 teachers was almost twice that of local government pre-K–12 teachers (85.8 and 49.2 per 10,000 full-time workers, respectively). The rate of violent events for pre-K–12 teachers in the private industry increased from 8.8 per 10,000 full-time workers in 2011 to 12.4 in 2014.
The primary source of an occupational injury is the object, substance, person, bodily motion, or exposure that most directly led to, produced, or inflicted the injury or illness. The secondary source of an occupational injury is the object, substance, person, or exposure, other than the primary source, if any, that most actively generated the source or contributed to the injury or illness. When a source is referred to as “primary” or “secondary,” it does not indicate the number or rate of cases. It simply indicates the level of importance an object, a piece or equipment, or machinery had in an event or exposure leading to a fatal or nonfatal injury or illness.
In cases of suicide, workers are considered the primary source and the means that they used to kill themselves is considered the secondary source.8In addition, in fatal violent events toward another person, the assailant is considered the primary source. The object or means used to kill the other person is considered the secondary source. Therefore, in fatal violent events overall, the fatally injured worker was the primary source of all 13 suicides from 2011 to 2014. Relatives or domestic partners were the primary source of 4 of the 12 homicides. For all workers in the United States, in 2014, relatives or domestic partners were the primary source of 32 percent of homicides for women and 2 percent for men.9 Students were the primary source of three of the homicides of educators. In 8 of the 12 homicides, a firearm was the secondary source. The most frequently used firearm was categorized as a pistol, handgun, or revolver, which was used in five of the eight cases in which a firearm was the secondary source.
Students were the primary source of injury or illness in 92 percent (7,900 cases) of the 8,620 nonfatal violent events that educators experienced in 2014. This percentage of violent events involving students increased 23 percent since 2011 from 6,410 cases. Although students were the primary source of the majority of violent events to educators, students were the primary source of only 26 percent (9,580 cases) of the total days-away-from-work cases on the job in 2014.
In 2014, students were the source of nonfatal injury or illness in nearly twice as many intentional violent events by persons experienced by educators as they were for unintentional or intent-unknown violent events. Although students were the primary source in more intentional violent events, the median days away from work due to unintentional or intent-unknown events (7 median days away) was 4 days higher than the median for intentional cases. Hitting, kicking, beating, and shoving accounted for 93 percent (4,360 cases) of intentional violent nonfatal events by persons and kept educators away from work for a median of 3 days to recuperate. Nearly half of the educators injured unintentionally or with unknown intent (1,500 cases) were injured during physical contact while restraining or subduing a student. Injuries by physical contact during horseplay with students numbered 200 cases.
Transportation incidents were the most common event or exposure that resulted in fatal injuries among educators from 2011 through 2014.10 They represented 38 percent of all fatal injuries (41 deaths) to educators. Of the transportation incidents, roadway incidents involving motorized land vehicles accounted for 37 percent of fatal injuries for educators (15 deaths). Examples of educators fatally injured in roadway incidents could include those which occur when educators supervise students on a school bus, a school-sponsored field trip, or other work-related trip. Another 29 percent (12 deaths) of the transportation incidents that resulted in fatal injuries to educators were aircraft incidents. Of the 12 aircraft transportation incidents resulting in fatal injuries to educators, 8 involved skydiving instructors. Falls, slips, and trips were the third most common fatal event or exposure from 2011 through 2014 (with violent events as the second most frequent, as discussed earlier). They composed 24 percent of all educator fatalities (26 deaths). Approximately, two-thirds of the fatal falls, slips, and trips were falls on the same level (16 deaths), and one-third were falls to a lower level (10 deaths).
Since transportation incidents and falls, slips, and trips were the two most common fatal nonviolent injury events for educators, vehicles along with floors, walkways, and ground surfaces were consequently their most common primary sources. Among vehicles, passenger vehicles were the source of 17 cases or 41 percent of fatal transportation incidents. Floors, walkways, and ground surfaces were the sources reported for 20 educator fatalities (18 percent) from 2011 through 2014.
In 2014, falls, slips, and trips were the most common nonfatal event or exposure for all educators whose injuries or illnesses resulted in days away from work (15,360 cases). Educators were at a higher risk of nonfatal falls, slips, and trips (24.8 per 10,000 full-time workers) on the job than they were of violent events (13.9 per 10,000 full-time workers). Those who did fall, slip, or trip required a median of 6 days away from work to recuperate—1 day more than those who experienced violent events. Falls on the same level far outnumbered violent events and accounted for 31 percent of the educators' total nonfatal days-away-from-work injuries and illnesses (11,280 cases). Floors, walkways, and ground surfaces accounted for 88 percent (9,960 cases) of the sources of falls on the same level. Ice, sleet, and snow (1,400 cases) and furniture and fixtures (1,040 cases) were two notable factors that contributed to persons falling on the same level while walking on floors, walkways, and ground surfaces.
Following violent events in 2014, cases of overexertion and bodily reaction were the next most common nonfatal event or exposure (6,540 cases).11 These types of events or exposures resulted after low- or no-impact physical effort in a single episode or repetitive motion over time. Educators were out for similar periods for these types of cases as they were for violent events. Specifically, everyday work activities such as bending, crawling, reaching, twisting, climbing, or stepping led to a median of 5 days away from work, the same median as that for violent events. Educators with less than 1 year length of service at an establishment had substantially higher medians (40 median days away) because of these everyday types of motions than those with 1 year or more length of service (5 median days away).
Contact with objects and equipment (3,810 cases), exposure to harmful substances or environments (1,030 cases), and transportation incidents (950 cases) together composed 16 percent of nonfatal injuries and illnesses to educators. Educators injured from contact with objects and equipment required 3 median days away from work to recuperate, whereas those injured either from exposure to harmful substances or environment or from transportation incidents required only 2 median days away. Approximately 930 educators were struck by recreation and athletic equipment, and another 950 were injured in transportation incidents involving vehicles. Of those who were exposed to harmful substances or environments, two out of five were exposed to bacteria and general chemical products (410 cases).
Pre-K–12 teachers accounted for 36 percent (39 of 109 deaths) of all fatally injured educators from 2011 through 2014 across all ownerships.12 Of all educators, pre-K–12 teachers also suffered the highest number of fatal violent events during this period and were the victims in 12 of the 29 fatal violent events (41 percent). Postsecondary teachers, the second most common occupation, accounted for 22 percent of fatalities (24 deaths) across all ownerships and were the victim in 34 percent of all violent events (10 of the 29 events). Half of the pre-K–12 teachers who were fatally injured in a violent event were killed in a homicide (6 deaths). Whereas, of the postsecondary teachers fatally injured in violent events, 70 percent committed suicide (7 deaths).
Self-enrichment education teachers had the most fatal injuries among educators in private industry (21 of 48 deaths). Self-enrichment teachers instruct courses other than those which normally lead to an occupational objective or degree and can include nonvocational and nonacademic subjects. Examples of these subjects include skydiving instruction and firearm instruction, among others. Elementary and middle school teachers had the most fatal injuries among educators in local government with 15 of 42 (36 percent) fatal injuries.
Teacher assistants had the highest number of nonfatal injuries and illnesses that resulted in days away from work in 2014 among educators (12,620 cases) for all ownerships, state government as well as local government. They required a median of 6 days away from work to recuperate from injuries and illnesses. For private industry educators in 2014, preschool teachers, except special education, had the highest number of days-away-from-work cases at 3,140—280 of those were due to violent events. They required 12 median days away from work to recuperate from a violent event, 7 more than the median for all their events. Teacher assistants accounted for 56 percent (4,830 cases) of educators who experienced violent events on the job in 2014 and required 3 median days away to recuperate after a violent event. From 2011 to 2014, teacher assistants accounted for approximately 33 percent of total days-away-from-work cases and 45 percent of nonfatal violent event cases.
Following teacher assistants, those employed as elementary and middle school teachers experienced the second most frequent number of violent events by any detailed educator occupation (1,820 cases) and required 7 median days away from work to recuperate after a violent event.
The detailed educator occupation with the longest median days away from work due to violent events (52 median days away from work, 290 cases) was the secondary school teachers, except special education and career technical education. Special education teachers in middle schools followed them at 26 median days away from work (50 cases).
From 2011 through 2014, women composed 42 percent of fatal injuries within the educator occupation and 8 percent of all workers fatally injured on the job across the United States. In 2014, nearly 75 percent of the educators in the United States were women and women represented 48 percent of educators’ workplace fatalities (13 deaths).13 From 2011 through 2014, women were the victims in 13 of 29 fatal violent events (45 percent) and men the victims in 16 of 29 (55 percent) fatal violent events.
The share of days-away-from-work cases for women in 2014 was similar to their share of total employment. Among educators, women experienced 87 percent of nonfatal violent events and 85 percent of all days-away-from-work injuries. Although men had fewer cases, they required nearly twice the recuperation time after violent events (9 median days away from work) and 1 more median day for all injuries (6 days way from work). Women took 5 median days away from work for both total injuries and illnesses and violent events. Using the median days away as a proxy for a measure of severity indicates that when male educators were hurt or injured during a violent event on the job, they sustained more severe injuries and thus required more days away from work. For example, in cases in which female educators required 3 median days away from work (4,140 cases) to recuperate because of hitting, kicking, beating, and shoving by students, male educators who experienced these same events (440 cases) required a median of 8 days away from work.
Violent events were not the leading fatal event category under which educators were reported as killed on the job. From 2011 through 2014, more educators died in transportation incidents than in any other event. Hence, vehicles were the leading source of educator fatalities on the job from 2011 through 2014 (38 percent) (see table 3). The most frequent type of violent event was suicides.
| Primary source (1) | Fatal injuries | Nonfatal injuries or illnesses with days away from work |
|---|---|---|
Total percentage | 100 | 100 |
Vehicles | 38 | 3 |
Floors, walkways, ground surfaces | 18 | 33 |
Person—injured or ill worker | 15 | 15 |
Student | 5 | 25 |
All other sources | 25 | 24 |
Notes: (1) Data shown in columns correspond to the “Occupational Injury and Illness Classification Manual” 2.01 source codes in which vehicles = 8; floors, walkways, and ground surfaces = 66; person—injured or ill worker = 56; and student = 573. Sources: U.S. Bureau of Labor Statistics, Census of Fatal Occupational Injuries (fatal injuries), and Survey of Occupational Injuries and Illnesses (nonfatal injuries and illnesses). | ||
Violent events were also not the leading nonfatal event category under which educators required days away from work. The leading event for nonfatal days-away-from-work cases from 2011 through 2014 was falls, slips, and trips (43 percent). Hence, floors, walkways, and ground surfaces were the primary sources of nonfatal injuries and illnesses that resulted in educators taking days away from work (see table 3).
Aisha H. Spencer and Ryan P. Farrell, "Putting violence in perspective: how safe are America’s educators in the workplace?," Monthly Labor Review, U.S. Bureau of Labor Statistics, August 2016, https://doi.org/10.21916/mlr.2016.37
1 Total employment data on educators were taken from the BLS Occupational Employment Statistics program, May 2014, https://www.bls.gov/oes/tables.htm. Educators represent all occupational groups under the education, training, and library occupations 25-0000 category that is based on the “2010 Standard Occupational Classification Manual,” https://www.bls.gov/soc/2010/.
2 Data on fatalities were taken from the Census of Fatal Occupational Injuries (CFOI). Fatality data for 2014 are based on final counts released April 21, 2016. Data on nonfatal occupational injuries and illnesses involving days away from work were taken from the Survey of Occupational Injuries and Illnesses (SOII). BLS conducts both the CFOI and SOII. For a detailed explanation of the scopes of CFOI and SOII, see the BLS Handbook of Methods, chapter 9, “Occupational safety and health statistics” (U.S. Bureau of Labor Statistics), https://www.bls.gov/opub/hom/pdf/homch9.pdf.
3 Events discussed in this article are defined under the Occupational Injury and Illness Classification System 2.01 structure as events or exposures at https://www.bls.gov/iif/oiics_manual_2010.pdf. They describe the manner in which the injury or illness was produced or inflicted by the source of injury or illness.
4 Fatal injury data focused on the years 2011 through 2014, whereas nonfatal days-away-from-work data focused on 2014. The average number of fatalities was 27 annually. As a result, fatal injury data from 2011 through 2014 are presented as an aggregate to avoid issues of data suppression. The nonfatal occupational estimates mentioned throughout this article are for 2014, unless otherwise mentioned.
5 Occupational injuries and illnesses are presented by ownership: private industry, local government, and state government. Cities, parishes, etc., are classified as local government. All ownerships are the sum of private, local, and state governments. Educators of all levels of instruction can work in each sector. The Census of Fatal Occupational Injuries includes federal and self-employed workers, whereas federal and self-employed workers are not included in the Survey of Occupational Injuries and Illnesses.
6 Days away from work are a type of nonfatal occupational injury or illness wherein the worker is out of work a minimum of 1 full day or more after the event or exposure occurs. These cases include workers who return to their regular job duties or are put on restricted work once they return.
7 Within the education, training, and library occupations, the local government employed 65 percent (5,470,880 workers), private industry employed 24 percent (2,052,620 workers), and the state employed 10 percent (880,770 workers) of educators. For more information, see BLS Occupational Employment Statistics program, May 2014, at https://www.bls.gov/oes/tables.htm.
8 Of the 16 fatalities in which the educator was the primary source, 13 were suicides and 3 were from bodily motion, specifically as events of overexertion and bodily reaction.
9 See BLS 2014 chart package of the “Census of Fatal Occupational Injuries—current and revised data,” charts titled “Fatal work injuries and hours worked by gender of worker, 2014,” p. 8; “Distribution of fatal injury events by gender of worker, 2014,” p. 9; and “Work related homicides by gender of decedent and assailant type, 2014,” p. 10, https://www.bls.gov/iif/oshwc/cfoi/cfch0013.pdf.
10 Fatal injuries that occurred during a person’s normal commute to or from work are out of scope, unless the incident occurred on the employer’s premises.
11 In 2014, the educator was the primary source of 5,920 nonfatal days-away-from-work cases—58 percent involved events of overexertion and bodily reaction (3,450 cases) and 38 percent involved falls, slips, and trips (2,230 cases).
12 Detailed occupations mentioned in this section are from the “2010 Standard Occupational Classification Manual,” as follows: preschool, primary, secondary, and special education school teachers = 25-2000; postsecondary teachers = 25-1000; self-enrichment education teachers = 25-3020; elementary and middle school teachers = 25-2020; teacher assistants = 25-9041; secondary school teachers, except special education and career technical education = 25-2031; and special education teachers, middle school = 25-3053. Fatal injury rates for educators are not available past the two-digit detail level for occupations. Selected rate categories for rates that the Census of Fatal Occupational Injuries (CFOI) produced had 15 or more reported fatal work injuries in 2014 and 40 million or more work hours (20,000 full-time equivalent employees). Rates may not be produced if they do not meet this threshold in 2014. Rates that the CFOI produced can be found at https://www.bls.gov/iif/oshcfoi1.htm.
13 Current Population Survey, “Employed persons by detailed occupation, sex, race, and Hispanic or Latino ethnicity” (U.S. Bureau of Labor Statistics, 2014), p. 3, https://www.bls.gov/cps/aa2014/cpsaat11.htm.