
An official website of the United States government
An official website of the United States government
The .gov means it's official.
Federal government websites often end in .gov or .mil. Before sharing sensitive information,
make sure you're on a federal government site.
The site is secure.
The
https:// ensures that you are connecting to the official website and that any
information you provide is encrypted and transmitted securely.
There were 3.8 million job openings on the last business day in March, little changed from 3.9 million in February. The job openings rate (2.8 percent), hires rate (3.2 percent), and the separations rate (3.1 percent) were little changed in March (seasonally adjusted).
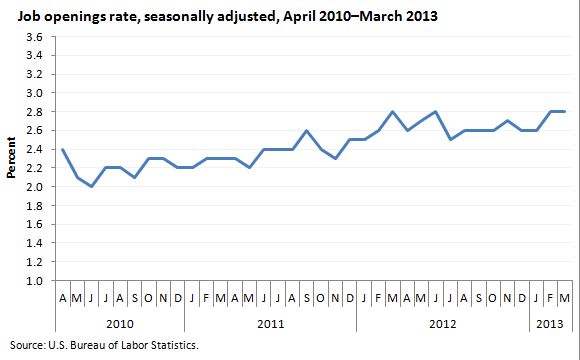
| Month | Job openings rate |
|---|---|
Apr 2010 | 2.4 |
May 2010 | 2.1 |
Jun 2010 | 2.0 |
Jul 2010 | 2.2 |
Aug 2010 | 2.2 |
Sep 2010 | 2.1 |
Oct 2010 | 2.3 |
Nov 2010 | 2.3 |
Dec 2010 | 2.2 |
Jan 2011 | 2.2 |
Feb 2011 | 2.3 |
Mar 2011 | 2.3 |
Apr 2011 | 2.3 |
May 2011 | 2.2 |
Jun 2011 | 2.4 |
Jul 2011 | 2.4 |
Aug 2011 | 2.4 |
Sep 2011 | 2.6 |
Oct 2011 | 2.4 |
Nov 2011 | 2.3 |
Dec 2011 | 2.5 |
Jan 2012 | 2.5 |
Feb 2012 | 2.6 |
Mar 2012 | 2.8 |
Apr 2012 | 2.6 |
May 2012 | 2.7 |
Jun 2012 | 2.8 |
Jul 2012 | 2.5 |
Aug 2012 | 2.6 |
Sep 2012 | 2.6 |
Oct 2012 | 2.6 |
Nov 2012 | 2.7 |
Dec 2012 | 2.6 |
Jan 2013 | 2.6 |
Feb 2013 | 2.8 |
Mar 2013 | (p)2.8 |
Footnotes: | |
From March 2012 to March 2013, job openings (not seasonally adjusted) decreased for nondurable goods manufacturing and federal government; openings increased over the year for accommodations and food services.
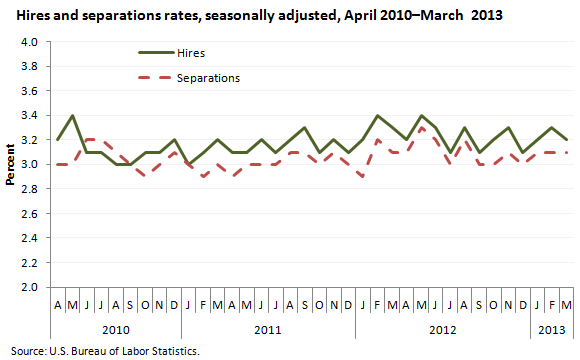
| Month | Hires rate | Separations rate |
|---|---|---|
Apr 2010 | 3.2 | 3.0 |
May 2010 | 3.4 | 3.0 |
Jun 2010 | 3.1 | 3.2 |
Jul 2010 | 3.1 | 3.2 |
Aug 2010 | 3.0 | 3.1 |
Sep 2010 | 3.0 | 3.0 |
Oct 2010 | 3.1 | 2.9 |
Nov 2010 | 3.1 | 3.0 |
Dec 2010 | 3.2 | 3.1 |
Jan 2011 | 3.0 | 3.0 |
Feb 2011 | 3.1 | 2.9 |
Mar 2011 | 3.2 | 3.0 |
Apr 2011 | 3.1 | 2.9 |
May 2011 | 3.1 | 3.0 |
Jun 2011 | 3.2 | 3.0 |
Jul 2011 | 3.1 | 3.0 |
Aug 2011 | 3.2 | 3.1 |
Sep 2011 | 3.3 | 3.1 |
Oct 2011 | 3.1 | 3.0 |
Nov 2011 | 3.2 | 3.1 |
Dec 2011 | 3.1 | 3.0 |
Jan 2012 | 3.2 | 2.9 |
Feb 2012 | 3.4 | 3.2 |
Mar 2012 | 3.3 | 3.1 |
Apr 2012 | 3.2 | 3.1 |
May 2012 | 3.4 | 3.3 |
Jun 2012 | 3.3 | 3.2 |
Jul 2012 | 3.1 | 3.0 |
Aug 2012 | 3.3 | 3.2 |
Sep 2012 | 3.1 | 3.0 |
Oct 2012 | 3.2 | 3.0 |
Nov 2012 | 3.3 | 3.1 |
Dec 2012 | 3.1 | 3.0 |
Jan 2013 | 3.2 | 3.1 |
Feb 2013 | 3.3 | 3.1 |
Mar 2013 | (p)3.2 | (p)3.1 |
Footnotes: | ||
Over the 12 months ending in March, the hires rate (not seasonally adjusted) decreased in durable goods manufacturing; nondurable goods manufacturing; and arts, entertainment and recreation. The hires rate decreased in the Midwest.
Total separations include quits, layoffs and discharges, and other separations. The quits rate (not seasonally adjusted) decreased in the South but otherwise was little changed. The layoffs and discharges rate and other separations rates (not seasonally adjusted) were little changed for total private, government, and all four regions.
These data are from the Job Openings and Labor Turnover Survey. Data for the most recent month are preliminary and subject to revision. To learn more, see “Job Openings and Labor Turnover — March 2013” (HTML) (PDF), news release USDL-13-0846. More charts featuring data on job openings, hires, and employment separations can be found in Job Openings and Labor Turnover Survey Highlights: March 2013 (PDF).
Bureau of Labor Statistics, U.S. Department of Labor, The Economics Daily, Job openings, hires, and separations rates in March 2013 at https://www.bls.gov/opub/ted/2013/ted_20130509.htm (visited April 18, 2024).

