
An official website of the United States government
An official website of the United States government
The .gov means it's official.
Federal government websites often end in .gov or .mil. Before sharing sensitive information,
make sure you're on a federal government site.
The site is secure.
The
https:// ensures that you are connecting to the official website and that any
information you provide is encrypted and transmitted securely.
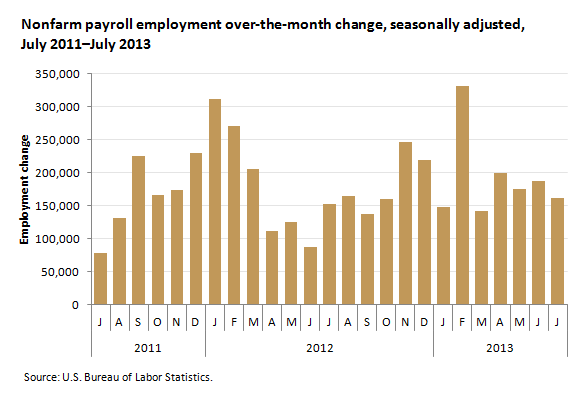
Total nonfarm payroll employment increased by 162,000 in July, with gains in retail trade, food services and drinking places, financial activities, and wholesale trade. Over the prior 12 months, nonfarm employment growth averaged 189,000 per month.
| Month | Employment change |
|---|---|
July 2011 | 78,000 |
August 2011 | 132,000 |
September 2011 | 225,000 |
October 2011 | 166,000 |
November 2011 | 174,000 |
December 2011 | 230,000 |
January 2012 | 311,000 |
February 2012 | 271,000 |
March 2012 | 205,000 |
April 2012 | 112,000 |
May 2012 | 125,000 |
June 2012 | 87,000 |
July 2012 | 153,000 |
August 2012 | 165,000 |
September 2012 | 138,000 |
October 2012 | 160,000 |
November 2012 | 247,000 |
December 2012 | 219,000 |
January 2013 | 148,000 |
February 2013 | 332,000 |
March 2013 | 142,000 |
April 2013 | 199,000 |
May 2013 | 176,000 |
June 2013 | 188,000(p) |
July 2013 | 162,000(p) |
(p) preliminary | |
Retail trade added 47,000 jobs in July and has added 352,000 over the past 12 months. Within leisure and hospitality, employment in food services and drinking places increased by 38,000 in July and by 381,000 over the year.
Financial activities employment increased by 15,000 in July, with a gain of 6,000 in securities, commodity contracts, and investments. Over the year, financial activities has added 120,000 jobs.
Employment increased in wholesale trade (+14,000) in July. Over the past 12 months, this industry has added 83,000 jobs.
Employment in professional and business services continued to trend up in July (+36,000). Within the industry, job growth continued in management of companies and enterprises (+7,000) and in management and technical consulting services (+7,000). Employment in temporary help services changed little over the month.
Manufacturing employment was essentially unchanged in July and has changed little, on net, over the past 12 months.
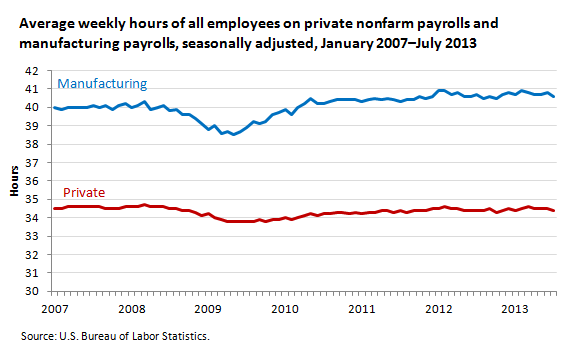
The average workweek for all employees on private nonfarm payrolls decreased by 0.1 hour in July to 34.4 hours. In manufacturing, the workweek decreased by 0.2 hour to 40.6 hours.
| Month | Total private | Manufacturing |
|---|---|---|
January 2007 | 34.5 | 40.0 |
February 2007 | 34.5 | 39.9 |
March 2007 | 34.6 | 40.0 |
April 2007 | 34.6 | 40.0 |
May 2007 | 34.6 | 40.0 |
June 2007 | 34.6 | 40.0 |
July 2007 | 34.6 | 40.1 |
August 2007 | 34.6 | 40.0 |
September 2007 | 34.5 | 40.1 |
October 2007 | 34.5 | 39.9 |
November 2007 | 34.5 | 40.1 |
December 2007 | 34.6 | 40.2 |
January 2008 | 34.6 | 40.0 |
February 2008 | 34.6 | 40.1 |
March 2008 | 34.7 | 40.3 |
April 2008 | 34.6 | 39.9 |
May 2008 | 34.6 | 40.0 |
June 2008 | 34.6 | 40.1 |
July 2008 | 34.5 | 39.8 |
August 2008 | 34.5 | 39.9 |
September 2008 | 34.4 | 39.6 |
October 2008 | 34.4 | 39.6 |
November 2008 | 34.3 | 39.4 |
December 2008 | 34.1 | 39.1 |
January 2009 | 34.2 | 38.8 |
February 2009 | 34.0 | 39.0 |
March 2009 | 33.9 | 38.6 |
April 2009 | 33.8 | 38.7 |
May 2009 | 33.8 | 38.5 |
June 2009 | 33.8 | 38.7 |
July 2009 | 33.8 | 38.9 |
August 2009 | 33.8 | 39.2 |
September 2009 | 33.9 | 39.1 |
October 2009 | 33.8 | 39.2 |
November 2009 | 33.9 | 39.6 |
December 2009 | 33.9 | 39.7 |
January 2010 | 34.0 | 39.9 |
February 2010 | 33.9 | 39.6 |
March 2010 | 34.0 | 40.0 |
April 2010 | 34.1 | 40.2 |
May 2010 | 34.2 | 40.5 |
June 2010 | 34.1 | 40.2 |
July 2010 | 34.2 | 40.2 |
August 2010 | 34.2 | 40.3 |
September 2010 | 34.3 | 40.4 |
October 2010 | 34.3 | 40.4 |
November 2010 | 34.2 | 40.4 |
December 2010 | 34.3 | 40.4 |
January 2011 | 34.2 | 40.3 |
February 2011 | 34.3 | 40.4 |
March 2011 | 34.3 | 40.5 |
April 2011 | 34.4 | 40.4 |
May 2011 | 34.4 | 40.5 |
June 2011 | 34.3 | 40.4 |
July 2011 | 34.4 | 40.3 |
August 2011 | 34.3 | 40.4 |
September 2011 | 34.4 | 40.4 |
October 2011 | 34.4 | 40.6 |
November 2011 | 34.4 | 40.5 |
December 2011 | 34.5 | 40.6 |
January 2012 | 34.5 | 40.9 |
February 2012 | 34.6 | 40.9 |
March 2012 | 34.5 | 40.7 |
April 2012 | 34.5 | 40.8 |
May 2012 | 34.4 | 40.6 |
June 2012 | 34.4 | 40.6 |
July 2012 | 34.4 | 40.7 |
August 2012 | 34.4 | 40.5 |
September 2012 | 34.5 | 40.6 |
October 2012 | 34.3 | 40.5 |
November 2012 | 34.4 | 40.7 |
December 2012 | 34.5 | 40.8 |
January 2013 | 34.4 | 40.7 |
February 2013 | 34.5 | 40.9 |
March 2013 | 34.6 | 40.8 |
April 2013 | 34.5 | 40.7 |
May 2013 | 34.5 | 40.7 |
June 2013 | 34.5(p) | 40.8(p) |
July 2013 | 34.4(p) | 40.6(p) |
(p) preliminary | ||
These data are from the Current Employment Statistics (CES) program and are seasonally adjusted. Data for the most recent two months are preliminary. To learn more, see "The Employment Situation — July 2013," (HTML) (PDF) news release USDL‑13‑1527. More charts featuring CES employment data can be found in Current Employment Statistics Highlights: July 2013 (PDF).
Bureau of Labor Statistics, U.S. Department of Labor, The Economics Daily, Payroll employment up 162,000 in July 2013 at https://www.bls.gov/opub/ted/2013/ted_20130805.htm (visited April 19, 2024).

