
An official website of the United States government
An official website of the United States government
The .gov means it's official.
Federal government websites often end in .gov or .mil. Before sharing sensitive information,
make sure you're on a federal government site.
The site is secure.
The
https:// ensures that you are connecting to the official website and that any
information you provide is encrypted and transmitted securely.
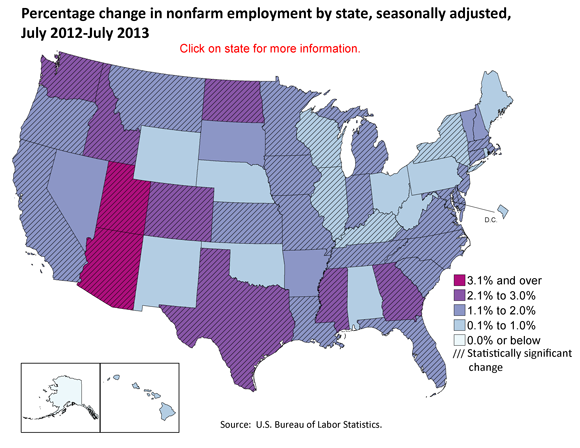
From July 2012 to July 2013, nonfarm employment increased in 49 states and the District of Columbia and decreased in 1 state. The largest over-the-year percentage increase occurred in Utah (+3.2 percent), followed by Arizona (+3.1 percent) and Georgia (+2.8 percent). The only over-the-year percentage decrease in employment occurred in Alaska (−0.5 percent).
| State | Percent change in nonfarm employment from July 2012 to July 2013 (p) | Statistical significance |
|---|---|---|
Alabama | 0.9 | Not statistically significant change |
Alaska | -0.5 | Not statistically significant change |
Arizona | 3.1 | Statistically significant, increase |
Arkansas | 1.2 | Not statistically significant change |
California | 1.6 | Statistically significant, increase |
Colorado | 2.7 | Statistically significant, increase |
Connecticut | 1.4 | Statistically significant, increase |
Delaware | 1.7 | Statistically significant, increase |
District of Columbia | 0.5 | Not statistically significant change |
Florida | 1.9 | Statistically significant, increase |
Georgia | 2.8 | Statistically significant, increase |
Hawaii | 1.0 | Not statistically significant change |
Idaho | 2.7 | Statistically significant, increase |
Illinois | 1.0 | Statistically significant, increase |
Indiana | 1.9 | Statistically significant, increase |
Iowa | 1.7 | Statistically significant, increase |
Kansas | 1.2 | Statistically significant, increase |
Kentucky | 1.0 | Statistically significant, increase |
Louisiana | 1.2 | Statistically significant, increase |
Maine | 0.8 | Not statistically significant change |
Maryland | 1.5 | Statistically significant, increase |
Massachusetts | 1.2 | Statistically significant, increase |
Michigan | 1.7 | Statistically significant, increase |
Minnesota | 2.0 | Statistically significant, increase |
Mississippi | 2.2 | Statistically significant, increase |
Missouri | 1.8 | Statistically significant, increase |
Montana | 1.9 | Statistically significant, increase |
Nebraska | 0.7 | Not statistically significant change |
Nevada | 1.3 | Not statistically significant change |
New Hampshire | 1.1 | Not statistically significant change |
New Jersey | 1.9 | Statistically significant, increase |
New Mexico | 1.0 | Not statistically significant change |
New York | 0.9 | Statistically significant, increase |
North Carolina | 1.7 | Statistically significant, increase |
North Dakota | 2.7 | Statistically significant, increase |
Ohio | 0.7 | Not statistically significant change |
Oklahoma | 0.6 | Not statistically significant change |
Oregon | 1.7 | Statistically significant, increase |
Pennsylvania | 0.5 | Not statistically significant change |
Rhode Island | 0.2 | Not statistically significant change |
South Carolina | 2.0 | Statistically significant, increase |
South Dakota | 1.1 | Not statistically significant change |
Tennessee | 1.2 | Statistically significant, increase |
Texas | 2.7 | Statistically significant, increase |
Utah | 3.2 | Statistically significant, increase |
Vermont | 1.5 | Not statistically significant change |
Virginia | 1.4 | Statistically significant, increase |
Washington | 2.3 | Statistically significant, increase |
West Virginia | 0.8 | Not statistically significant change |
Wisconsin | 0.9 | Statistically significant, increase |
Wyoming | 0.9 | Not statistically significant change |
Footnotes: | ||
Over the year, 33 states had statistically significant changes in employment, all of which were positive. Among those states, the largest over-the-year job increase occurred in Texas (+293,000, or +2.7 percent), followed by California (+236,400, or +1.6 percent) and Florida (+143,700, or +1.9 percent).
In July 2013, 16 states had statistically significant over-the-month changes in employment, 12 of which were increases. The largest statistically significant job gain occurred in California (+38,100), followed by Georgia (+30,900) and Florida (+27,600). The largest statistically significant job decreases occurred in New Jersey (−11,800) and Nevada (−10,200).
These data are from the Current Employment Statistics (State and Metro Area) program. Data for the most recent month are preliminary and subject to revision. To learn more, see "Regional and State Employment and Unemployment — July 2013" (HTML) (PDF), news release USDL-13-1697.
Bureau of Labor Statistics, U.S. Department of Labor, The Economics Daily, Utah has largest over-the-year percentage increase in employment among states, July 2013 at https://www.bls.gov/opub/ted/2013/ted_20130821.htm (visited April 17, 2024).

