An official website of the United States government
An official website of the United States government
The .gov means it's official.
Federal government websites often end in .gov or .mil. Before sharing sensitive information,
make sure you're on a federal government site.
The site is secure.
The
https:// ensures that you are connecting to the official website and that any
information you provide is encrypted and transmitted securely.
24-169-CHI
Thursday, March 07, 2024
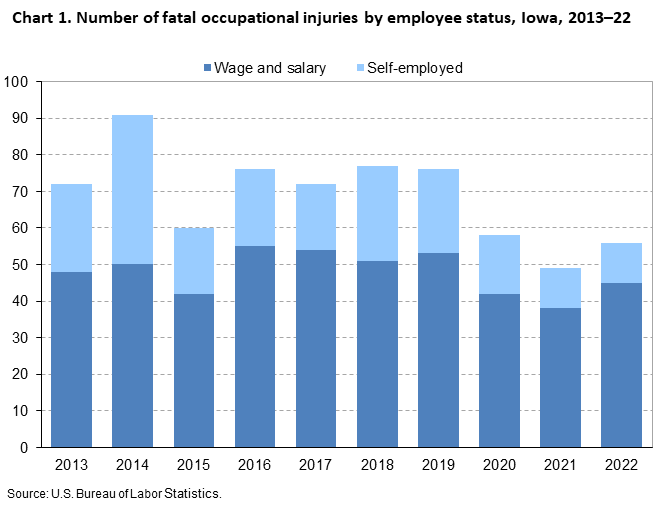
Fatal work injuries totaled 56 in 2022 for Iowa, the U.S. Bureau of Labor Statistics reported today. Regional Commissioner Jason Palmer noted that the number of work-related fatalities in Iowa was up from the previous year. (See chart 1.) Fatal occupational injuries in the state have ranged from a high of 110 in 1992 to a low of 49 in 2021. Nationwide, a total of 5,486 fatal work injuries were recorded in 2022, a 5.7-percent increase from 5,190 in 2021, according to the results from the Census of Fatal Occupational Injuries (CFOI).
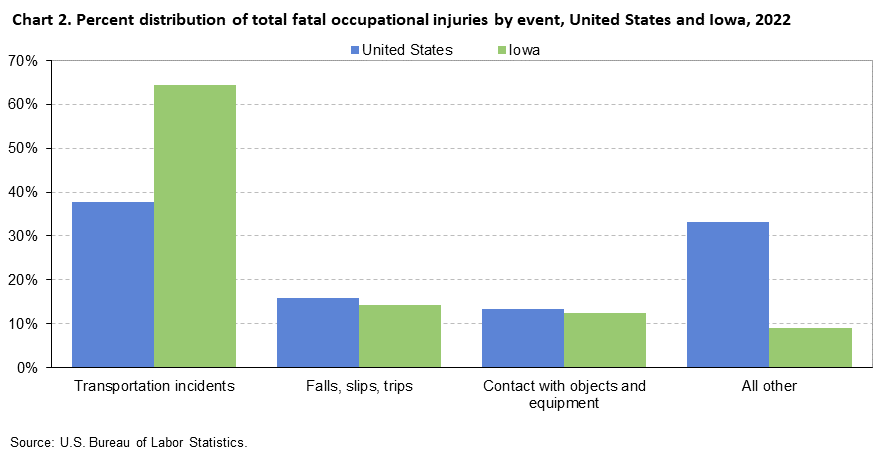
In Iowa, transportation incidents resulted in 36 fatal work injuries, accounting for 64 percent of all fatal workplace injuries in the state. (See chart 2 and table 1.) Worker deaths from transportation incidents were up from 25 over the year.
Falls, slips, and trips and contact with objects and equipment had eight and seven workplace fatalities, respectively. Worker deaths from falls, slips, and trips were up from seven over the year.
Nationally, transportation incidents were the most frequent fatal event in 2022, accounting for 38 percent of fatal work injuries. Falls, slips, and trips was the second-most common fatal event (16 percent), followed by violence and other injuries by persons or animals along with exposure to harmful substances or environments (15 percent each).
The private transportation and warehousing industry sector had the highest number of fatalities in Iowa with 17, up from 13 in the previous year. (See table 2.) The general freight trucking industry group accounted for 12 of the 17 fatal workplace injuries in the transportation and warehousing industry.
The private agriculture, forestry, fishing, and hunting industry sector had 8 fatal workplace injuries, down from 11 in the previous year. The oilseed and grain farming industry group accounted for five, or 63 percent, of the fatal injuries in this industry.
OccupationThe transportation and material moving occupational group had the highest number of fatal workplace injuries with 22. (See table 3.) Heavy and tractor-trailer truck drivers suffered 15 of the work-related deaths within the transportation and material moving group. The construction and extraction occupational group had the second-highest number of fatal workplace injuries with eight, followed by management occupations, with seven. Construction trades workers suffered 5 of the 8 work-related deaths within the construction and extraction workers group.
Additional highlightsBackground of the program. The Census of Fatal Occupational Injuries (CFOI), part of the Bureau of Labor Statistics (BLS) Occupational Safety and Health Statistics (OSHS) program, is a count of all fatalities resulting from workplace injuries occurring in the U.S. during the calendar year. The CFOI uses a variety of state, federal, and independent data sources to identify, verify, and describe fatal work injuries. This ensures counts are as complete and accurate as possible. For the 2022 national data, over 27,200 unique source documents were reviewed as part of the data collection process. For technical information and definitions for the CFOI, see the BLS Handbook of Methods and the CFOI definitions.
Federal/State agency coverage. The CFOI includes data for all fatal work injuries, some of which may be outside the scope of other agencies or regulatory coverage. Comparisons between CFOI counts and those released by other agencies should account for the different coverage requirements and definitions used by each agency. For more information on the scope of CFOI, see Scope of the Census of Fatal Occupational Injuries and Census of Fatal Occupational Injuries: Concepts.
Latency Cases. Latent fatal occupational injury cases occur when the date of injury differs from the date of death. In some cases, the death occurs in a different year than the occupational injury and are known as cross-year latent cases. In 2022, there were 186 cases nationally where this occurred, and 157 of these latent cases occurred more than 30 days prior to the start of 2022. For more information on latent cases, see Understanding latency in fatal occupational injuries.
Coronavirus (COVID-19) Pandemic and the Census of Fatal Occupational Injuries. CFOI reports fatal workplace injuries only. These may include fatal workplace injuries complicated by an illness such as COVID-19. Fatal workplace illnesses not precipitated by an injury are not in scope for CFOI. CFOI does not report any illness related information, including COVID-19. Additional information is available on the Effects of COVID-19 Pandemic on Workplace Injuries and Illnesses, Compensation, Occupational Requirements, and Work Stoppages Statistics.
Acknowledgments. BLS thanks the Iowa Division of Labor for their efforts in collecting accurate, comprehensive, and useful data on fatal work injuries. BLS also appreciates the efforts of all federal, state, local, and private sector entities that provided source documents used to identify fatal work injuries. Among these agencies are the Occupational Safety and Health Administration; the National Transportation Safety Board; the U.S. Coast Guard; the Mine Safety and Health Administration; the Office of Workers’ Compensation Programs (Federal Employees' Compensation and Longshore and Harbor Workers' Compensation divisions); the Federal Railroad Administration; the National Highway Traffic Safety Administration; state vital statistics registrars, coroners, and medical examiners; state departments of health, labor, and industrial relations and workers' compensation agencies; state and local police departments; and state farm bureaus.
Information in this release will be made available to individuals with sensory impairments upon request. Voice phone: (202) 691-5200; Telecommunications Relay Service: 7-1-1.
| Event or exposure (1) | 2021 | 2022 | |
|---|---|---|---|
| Number | Number | Percent | |
|
Total |
49 | 56 | 100 |
|
Transportation incidents |
25 | 36 | 64 |
|
Pedestrian vehicular incident |
-- | 5 | 9 |
|
Roadway incidents involving motorized land vehicle |
20 | 24 | 43 |
|
Roadway collision with other vehicle |
5 | 11 | 20 |
|
Roadway collision--moving in same direction |
-- | 3 | 5 |
|
Roadway collision--moving perpendicularly |
-- | 5 | 9 |
|
Roadway collision with object other than vehicle |
5 | 5 | 9 |
|
Vehicle struck object or animal on side of roadway |
5 | 3 | 5 |
|
Roadway noncollision incident |
10 | 8 | 14 |
|
Jack-knifed or overturned, roadway |
9 | 7 | 13 |
|
Nonroadway incident involving motorized land vehicles |
3 | 4 | 7 |
|
Nonroadway noncollision incident |
3 | 3 | 5 |
|
Fall or jump from and struck by same vehicle in normal operation, nonroadway |
-- | 1 | 2 |
|
Falls, slips, trips |
7 | 8 | 14 |
|
Falls to lower level |
5 | 6 | 11 |
|
Other fall to lower level |
-- | 6 | 11 |
|
Contact with objects and equipment |
-- | 7 | 13 |
|
Struck by object or equipment |
-- | 3 | 5 |
|
Footnotes: |
|||
|
NOTE: Data for all years are revised and final. Totals for major categories may include subcategories not shown separately. Dashes indicate no data reported or data that do not meet publication criteria. N.e.c. means "not elsewhere classified." CFOI fatal injury counts exclude illness-related deaths unless precipitated by an injury event. |
|||
| Industry (1) | 2021 | 2022 | |
|---|---|---|---|
| Number | Number | Percent | |
|
Total |
49 | 56 | 100 |
|
Private Industry (2) |
45 | 52 | 93 |
|
Goods producing |
-- | -- | -- |
|
Natural resources and mining |
11 | 8 | 14 |
|
Agriculture, forestry, fishing and hunting |
11 | 8 | 14 |
|
Crop production |
4 | 5 | 9 |
|
Oilseed and grain farming |
4 | 5 | 9 |
|
Corn farming |
4 | 5 | 9 |
|
Animal production and aquaculture |
4 | 2 | 4 |
|
Cattle ranching and farming |
1 | 2 | 4 |
|
Support activities for agriculture and forestry |
2 | 1 | 2 |
|
Support activities for crop production |
2 | 1 | 2 |
|
Support activities for crop production |
2 | 1 | 2 |
|
Soil preparation, planting, and cultivating |
-- | 1 | 2 |
|
Construction |
7 | 6 | 11 |
|
Construction |
7 | 6 | 11 |
|
Heavy and civil engineering construction |
1 | 3 | 5 |
|
Specialty trade contractors |
5 | 3 | 5 |
|
Manufacturing |
5 | 4 | 7 |
|
Manufacturing |
5 | 4 | 7 |
|
Service providing (3) |
-- | -- | -- |
|
Trade, transportation, and utilities |
16 | 23 | 41 |
|
Wholesale trade |
1 | 4 | 7 |
|
Retail trade |
2 | 2 | 4 |
|
Building material and garden equipment and supplies dealers |
1 | 1 | 2 |
|
Lawn and garden equipment and supplies stores |
1 | 1 | 2 |
|
General merchandise stores |
-- | 1 | 2 |
|
General merchandise stores, including warehouse clubs and supercenters |
-- | 1 | 2 |
|
General merchandise stores, including warehouse clubs and supercenters |
-- | 1 | 2 |
|
Transportation and warehousing |
13 | 17 | 30 |
|
Truck transportation |
11 | 14 | 25 |
|
General freight trucking |
8 | 12 | 21 |
|
General freight trucking, long-distance |
4 | 8 | 14 |
|
General freight trucking, long-distance, truckload |
-- | 3 | 5 |
|
Financial activities |
-- | 1 | 2 |
|
Real estate and rental and leasing |
-- | 1 | 2 |
|
Rental and leasing services |
-- | 1 | 2 |
|
Automotive equipment rental and leasing |
-- | 1 | 2 |
|
Passenger car rental and leasing |
-- | 1 | 2 |
|
Passenger car rental |
-- | 1 | 2 |
|
Professional and business services |
-- | 3 | 5 |
|
Administrative and support and waste management and remediation services |
-- | 3 | 5 |
|
Educational and health services |
-- | 4 | 7 |
|
Educational services |
-- | 1 | 2 |
|
Educational services |
-- | 1 | 2 |
|
Other schools and instruction |
-- | 1 | 2 |
|
All other schools and instruction |
-- | 1 | 2 |
|
Automobile driving schools |
-- | 1 | 2 |
|
Health care and social assistance |
-- | 3 | 5 |
|
Nursing and residential care facilities |
-- | 1 | 2 |
|
Nursing care facilities--skilled nursing facilities |
-- | 1 | 2 |
|
Nursing care facilities--skilled nursing facilities |
-- | 1 | 2 |
|
Leisure and hospitality |
2 | 1 | 2 |
|
Accommodation and food services |
1 | 1 | 2 |
|
Food services and drinking places |
-- | 1 | 2 |
|
Restaurants and other eating places |
-- | 1 | 2 |
|
Restaurants and other eating places |
-- | 1 | 2 |
|
Full-service restaurants |
-- | 1 | 2 |
|
Government (4) |
4 | 4 | 7 |
|
State government |
4 | 1 | 2 |
|
Local government |
-- | 3 | 5 |
|
Footnotes: |
|||
|
NOTE: Data for all years are revised and final. Totals for major categories may include subcategories not shown separately. Dashes indicate no data reported or data that do not meet publication criteria. N.e.c. means "not elsewhere classified." CFOI fatal injury counts exclude illness-related deaths unless precipitated by an injury event. |
|||
| Occupation (1) | 2021 | 2022 | |
|---|---|---|---|
| Number | Number | Percent | |
|
Total |
49 | 56 | 100 |
|
Management occupations |
6 | 7 | 13 |
|
Educational instruction and library occupations |
-- | 1 | 2 |
|
Other teachers and instructors |
-- | 1 | 2 |
|
Miscellaneous teachers and instructors |
-- | 1 | 2 |
|
Healthcare practitioners and technical occupations |
-- | 1 | 2 |
|
Healthcare diagnosing or treating practitioners |
-- | 1 | 2 |
|
Nurse practitioners |
-- | 1 | 2 |
|
Nurse practitioners |
-- | 1 | 2 |
|
Food preparation and serving related occupations |
-- | 1 | 2 |
|
Food and beverage serving workers |
-- | 1 | 2 |
|
Waiters and waitresses |
-- | 1 | 2 |
|
Waiters and waitresses |
-- | 1 | 2 |
|
Building and grounds cleaning and maintenance occupations |
4 | 4 | 7 |
|
Grounds maintenance workers |
3 | 4 | 7 |
|
Grounds maintenance workers |
3 | 4 | 7 |
|
Tree trimmers and pruners |
-- | 1 | 2 |
|
Sales and related occupations |
2 | 2 | 4 |
|
Retail sales workers |
2 | 1 | 2 |
|
Counter and rental clerks and parts salespersons |
-- | 1 | 2 |
|
Other sales and related workers |
-- | 1 | 2 |
|
Miscellaneous sales and related workers |
-- | 1 | 2 |
|
Office and administrative support occupations |
1 | 1 | 2 |
|
Other office and administrative support workers |
-- | 1 | 2 |
|
Office clerks, general |
-- | 1 | 2 |
|
Office clerks, general |
-- | 1 | 2 |
|
Farming, fishing, and forestry occupations |
2 | 1 | 2 |
|
Agricultural workers |
1 | 1 | 2 |
|
Miscellaneous agricultural workers |
1 | 1 | 2 |
|
Farmworkers and laborers, crop, nursery, and greenhouse |
-- | 1 | 2 |
|
Construction and extraction occupations |
7 | 8 | 14 |
|
Construction trades workers |
7 | 5 | 9 |
|
Brickmasons, blockmasons, and stonemasons |
-- | 1 | 2 |
|
Installation, maintenance, and repair occupations |
4 | 4 | 7 |
|
Other installation, maintenance, and repair occupations |
3 | 4 | 7 |
|
Maintenance and repair workers, general |
-- | 1 | 2 |
|
Maintenance and repair workers, general |
-- | 1 | 2 |
|
Miscellaneous installation, maintenance, and repair workers |
-- | 3 | 5 |
|
Transportation and material moving occupations |
18 | 22 | 39 |
|
Motor vehicle operators |
17 | 19 | 34 |
|
Driver/sales workers and truck drivers |
17 | 16 | 29 |
|
Driver/sales workers |
-- | 1 | 2 |
|
Heavy and tractor-trailer truck drivers |
17 | 15 | 27 |
|
Footnotes: |
|||
|
NOTE: Data for all years are revised and final. Totals for major categories may include subcategories not shown separately. Dashes indicate no data reported or data that do not meet publication criteria. N.e.c. means "not elsewhere classified." CFOI fatal injury counts exclude illness-related deaths unless precipitated by an injury event. |
|||
| Worker characteristics | 2021 | 2022 | |
|---|---|---|---|
| Number | Number | Percent | |
|
Total |
49 | 56 | 100 |
|
Employee status |
|||
|
Wage and salary workers (1) |
38 | 45 | 80 |
|
Self-employed (2) |
11 | 11 | 20 |
|
Gender |
|||
|
Men |
45 | 53 | 95 |
|
Women |
4 | 3 | 5 |
|
Age (3) |
|||
|
20 to 24 years |
2 | 4 | 7 |
|
25 to 34 years |
4 | 8 | 14 |
|
35 to 44 years |
10 | 5 | 9 |
|
45 to 54 years |
17 | 11 | 20 |
|
55 to 64 years |
10 | 16 | 29 |
|
65 years and over |
5 | 12 | 21 |
|
Race or ethnic origin (4) |
|||
|
White, non-Hispanic |
38 | 35 | 63 |
|
Black or African-American, non-Hispanic |
-- | 5 | 9 |
|
Footnotes: |
|||
|
NOTE: Data for all years are revised and final. Totals for major categories may include subcategories not shown separately. Dashes indicate no data reported or data that do not meet publication criteria. N.e.c. means "not elsewhere classified." CFOI fatal injury counts exclude illness-related deaths unless precipitated by an injury event. |
|||
Last Modified Date: Thursday, March 07, 2024