An official website of the United States government
An official website of the United States government
The .gov means it's official.
Federal government websites often end in .gov or .mil. Before sharing sensitive information,
make sure you're on a federal government site.
The site is secure.
The
https:// ensures that you are connecting to the official website and that any
information you provide is encrypted and transmitted securely.
24-171-CHI
Thursday, March 07, 2024
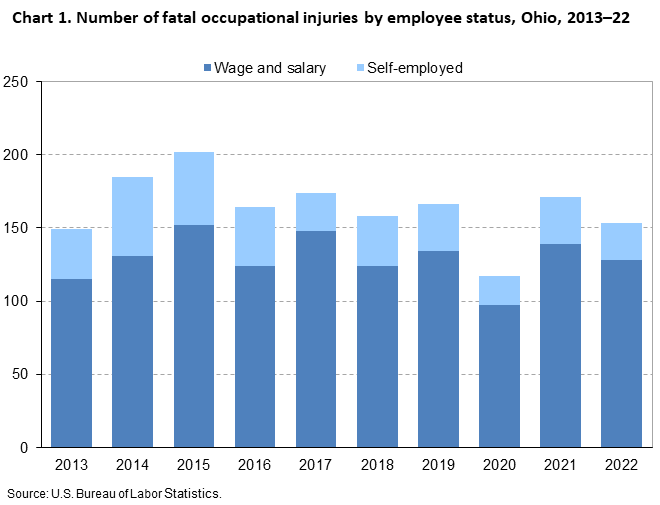
Fatal work injuries totaled 153 in 2022 for Ohio, the U.S. Bureau of Labor Statistics reported today. Regional Commissioner Jason Palmer noted that the number of work-related fatalities in Ohio was down from the previous year. (See chart 1.) Fatal occupational injuries in the state have ranged from a high of 222 in 1999 to a low of 117 in 2020. Nationwide, a total of 5,486 fatal work injuries were recorded in 2022, a 5.7-percent increase from 5,190 in 2021, according to the results from the Census of Fatal Occupational Injuries (CFOI).
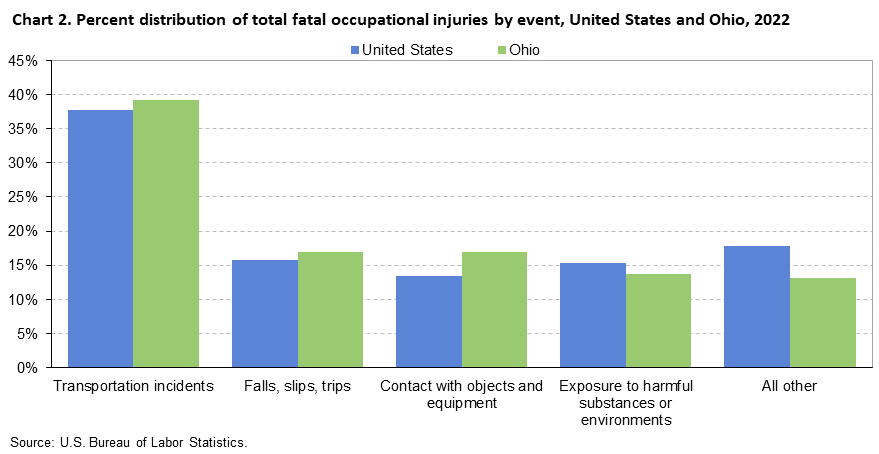
In Ohio, transportation incidents resulted in 60 fatal work injuries, accounting for 39 percent of all fatal workplace injuries in the state. (See chart 2 and table 1.) Worker deaths from transportation incidents were down from 67 over the year.
Falls, slips, and trips as well as contact with objects and equipment accounted for 26 fatalities each. Worker fatalities due to falls, slips, and trips were down from 34 over the year, while contact with objects or equipment work-related deaths were up from 25 in 2021.
Nationally, transportation incidents were the most frequent fatal event in 2022, accounting for 38 percent of fatal work injuries. Falls, slips, and trips were the second-most common fatal event (16 percent), followed by violence and other injuries by persons or animals along with exposure to harmful substances or environments (15 percent each).
The private transportation and warehousing industry sector had the highest number of fatalities in Ohio with 26, down from 28 in the previous year. (See table 2.) Transportation incidents resulted in 17 of the 26 fatalities in the industry. The truck transportation subsector accounted for 21 of the 26 fatal workplace injuries in the transportation and warehousing industry.
The private manufacturing industry sector had 25 fatal workplace injuries, down from 30 in the previous year. Contact with objects or equipment resulted in 10 of the 25 fatalities in the manufacturing industry.
OccupationThe transportation and material moving occupational group had the highest number of fatal workplace injuries with 45. (See table 3.) Heavy and tractor-trailer truck drivers accounted for 29 of the 45 fatalities among transportation and material moving workers. The construction and extraction occupational group had the second-highest number of fatal workplace injuries with 23, followed by installation, maintenance, and repair occupations with 20. General maintenance and repair workers suffered five work-related deaths within the installation, maintenance, and repair occupational group.
Additional highlightsBackground of the program. The Census of Fatal Occupational Injuries (CFOI), part of the Bureau of Labor Statistics (BLS) Occupational Safety and Health Statistics (OSHS) program, is a count of all fatalities resulting from workplace injuries occurring in the U.S. during the calendar year. The CFOI uses a variety of state, federal, and independent data sources to identify, verify, and describe fatal work injuries. This ensures counts are as complete and accurate as possible. For the 2022 national data, over 27,200 unique source documents were reviewed as part of the data collection process. For technical information and definitions for the CFOI, see the BLS Handbook of Methods and the CFOI definitions.
Federal/State agency coverage. The CFOI includes data for all fatal work injuries, some of which may be outside the scope of other agencies or regulatory coverage. Comparisons between CFOI counts and those released by other agencies should account for the different coverage requirements and definitions used by each agency. For more information on the scope of CFOI, see Scope of the Census of Fatal Occupational Injuries and Census of Fatal Occupational Injuries: Concepts.
Latency Cases. Latent fatal occupational injury cases occur when the date of injury differs from the date of death. In some cases, the death occurs in a different year than the occupational injury and are known as cross-year latent cases. In 2022, there were 186 cases nationally where this occurred, and 157 of these latent cases occurred more than 30 days prior to the start of 2022. For more information on latent cases, see Understanding latency in fatal occupational injuries.
Coronavirus (COVID-19) Pandemic and the Census of Fatal Occupational Injuries. CFOI reports fatal workplace injuries only. These may include fatal workplace injuries complicated by an illness such as COVID-19. Fatal workplace illnesses not precipitated by an injury are not in scope for CFOI. CFOI does not report any illness related information, including COVID-19. Additional information is available on the Effects of COVID-19 Pandemic on Workplace Injuries and Illnesses, Compensation, Occupational Requirements, and Work Stoppages Statistics.
Acknowledgments. BLS thanks the Ohio BWC Division of Safety and Hygiene for their efforts in collecting accurate, comprehensive, and useful data on fatal work injuries. BLS also appreciates the efforts of all federal, state, local, and private sector entities that provided source documents used to identify fatal work injuries. Among these agencies are the Occupational Safety and Health Administration; the National Transportation Safety Board; the U.S. Coast Guard; the Mine Safety and Health Administration; the Office of Workers’ Compensation Programs (Federal Employees' Compensation and Longshore and Harbor Workers' Compensation divisions); the Federal Railroad Administration; the National Highway Traffic Safety Administration; state vital statistics registrars, coroners, and medical examiners; state departments of health, labor, and industrial relations and workers' compensation agencies; state and local police departments; and state farm bureaus.
Information in this release will be made available to individuals with sensory impairments upon request. Voice phone: (202) 691-5200; Telecommunications Relay Service: 7-1-1.
| Event or exposure (1) | 2021 | 2022 | |
|---|---|---|---|
| Number | Number | Percent | |
|
Total |
171 | 153 | 100 |
|
Violence and other injuries by persons or animals |
15 | 14 | 9 |
|
Intentional injury by person |
14 | 14 | 9 |
|
Homicides--Intentional injury by other person |
-- | 12 | 8 |
|
Shooting by other person--intentional |
-- | 9 | 6 |
|
Transportation incidents |
67 | 60 | 39 |
|
Pedestrian vehicular incident |
13 | 13 | 8 |
|
Pedestrian struck by vehicle on side of road |
-- | 3 | 2 |
|
Pedestrian struck by vehicle in nonroadway area |
4 | 3 | 2 |
|
Roadway incidents involving motorized land vehicle |
47 | 40 | 26 |
|
Roadway collision with other vehicle |
21 | 24 | 16 |
|
Roadway collision--moving in same direction |
-- | 8 | 5 |
|
Roadway collision--moving in opposite directions, oncoming |
10 | 6 | 4 |
|
Roadway collision--moving perpendicularly |
-- | 6 | 4 |
|
Roadway collision with object other than vehicle |
18 | 6 | 4 |
|
Vehicle struck object or animal on side of roadway |
14 | 6 | 4 |
|
Roadway noncollision incident |
7 | 10 | 7 |
|
Jack-knifed or overturned, roadway |
3 | 10 | 7 |
|
Nonroadway incident involving motorized land vehicles |
6 | 5 | 3 |
|
Fires and explosions |
-- | 6 | 4 |
|
Explosions |
-- | 6 | 4 |
|
Falls, slips, trips |
34 | 26 | 17 |
|
Falls on same level |
9 | 5 | 3 |
|
Falls to lower level |
23 | 21 | 14 |
|
Fall from collapsing structure or equipment |
-- | 4 | 3 |
|
Other fall to lower level |
-- | 13 | 8 |
|
Other fall to lower level 6 to 10 feet |
-- | 4 | 3 |
|
Exposure to harmful substances or environments |
27 | 21 | 14 |
|
Exposure to electricity |
3 | 4 | 3 |
|
Exposure to other harmful substances |
22 | 13 | 8 |
|
Nonmedical use of drugs or alcohol--unintentional overdose |
17 | 11 | 7 |
|
Contact with objects and equipment |
25 | 26 | 17 |
|
Struck by object or equipment |
15 | 14 | 9 |
|
Struck by powered vehicle--nontransport |
-- | 4 | 3 |
|
Struck by other falling powered vehicle |
-- | 3 | 2 |
|
Struck by falling object or equipment--other than powered vehicle |
11 | 9 | 6 |
|
Struck by object falling from vehicle or machinery--other than vehicle part |
4 | 3 | 2 |
|
Footnotes: |
|||
|
NOTE: Data for all years are revised and final. Totals for major categories may include subcategories not shown separately. Dashes indicate no data reported or data that do not meet publication criteria. N.e.c. means "not elsewhere classified." CFOI fatal injury counts exclude illness-related deaths unless precipitated by an injury event. |
|||
| Industry (1) | 2021 | 2022 | |
|---|---|---|---|
| Number | Number | Percent | |
|
Total |
171 | 153 | 100 |
|
Private Industry (2) |
160 | 144 | 94 |
|
Goods producing |
-- | -- | -- |
|
Natural resources and mining |
20 | -- | -- |
|
Agriculture, forestry, fishing and hunting |
16 | 11 | 7 |
|
Crop production |
8 | 5 | 3 |
|
Animal production and aquaculture |
8 | 4 | 3 |
|
Construction |
24 | 22 | 14 |
|
Construction |
24 | 22 | 14 |
|
Construction of buildings |
-- | 3 | 2 |
|
Heavy and civil engineering construction |
-- | 4 | 3 |
|
Utility system construction |
-- | 4 | 3 |
|
Specialty trade contractors |
20 | 13 | 8 |
|
Foundation, structure, and building exterior contractors |
11 | 6 | 4 |
|
Roofing contractors |
6 | 5 | 3 |
|
Building equipment contractors |
4 | 3 | 2 |
|
Manufacturing |
30 | 25 | 16 |
|
Manufacturing |
30 | 25 | 16 |
|
Food manufacturing |
-- | 3 | 2 |
|
Nonmetallic mineral product manufacturing |
3 | 4 | 3 |
|
Primary metal manufacturing |
4 | 3 | 2 |
|
Machinery manufacturing |
-- | 3 | 2 |
|
Service providing (3) |
-- | -- | -- |
|
Trade, transportation, and utilities |
38 | -- | -- |
|
Wholesale trade |
-- | 8 | 5 |
|
Merchant wholesalers, durable goods |
-- | 4 | 3 |
|
Lumber and other construction materials merchant wholesalers |
-- | 3 | 2 |
|
Merchant wholesalers, nondurable goods |
-- | 4 | 3 |
|
Retail trade |
6 | 7 | 5 |
|
Transportation and warehousing |
28 | 26 | 17 |
|
Truck transportation |
23 | 21 | 14 |
|
General freight trucking |
20 | 17 | 11 |
|
General freight trucking, long-distance |
-- | 8 | 5 |
|
Professional and business services |
13 | 19 | 12 |
|
Professional, scientific, and technical services |
5 | 6 | 4 |
|
Professional, scientific, and technical services |
5 | 6 | 4 |
|
Architectural, engineering, and related services |
-- | 3 | 2 |
|
Administrative and support and waste management and remediation services |
8 | 13 | 8 |
|
Administrative and support services |
4 | 9 | 6 |
|
Investigation and security services |
-- | 3 | 2 |
|
Investigation, guard, and armored car services |
-- | 3 | 2 |
|
Security guards and patrol services |
-- | 3 | 2 |
|
Services to buildings and dwellings |
4 | 5 | 3 |
|
Landscaping services |
4 | 5 | 3 |
|
Waste management and remediation services |
4 | 4 | 3 |
|
Educational and health services |
13 | 4 | 3 |
|
Health care and social assistance |
11 | 4 | 3 |
|
Leisure and hospitality |
8 | 8 | 5 |
|
Accommodation and food services |
4 | 7 | 5 |
|
Food services and drinking places |
-- | 6 | 4 |
|
Other services, except public administration |
4 | 6 | 4 |
|
Other services, except public administration |
4 | 6 | 4 |
|
Repair and maintenance |
4 | 5 | 3 |
|
Automotive repair and maintenance |
-- | 5 | 3 |
|
Government (4) |
11 | 9 | 6 |
|
Local government |
8 | 9 | 6 |
|
Footnotes: |
|||
|
NOTE: Data for all years are revised and final. Totals for major categories may include subcategories not shown separately. Dashes indicate no data reported or data that do not meet publication criteria. N.e.c. means "not elsewhere classified." CFOI fatal injury counts exclude illness-related deaths unless precipitated by an injury event. |
|||
| Occupation (1) | 2021 | 2022 | |
|---|---|---|---|
| Number | Number | Percent | |
|
Total |
171 | 153 | 100 |
|
Management occupations |
19 | 10 | 7 |
|
Other management occupations |
-- | 5 | 3 |
|
Farmers, ranchers, and other agricultural managers |
-- | 4 | 3 |
|
Farmers, ranchers, and other agricultural managers |
-- | 4 | 3 |
|
Business and financial operations occupations |
-- | -- | -- |
|
Protective service occupations |
-- | 9 | 6 |
|
Other protective service workers |
-- | 4 | 3 |
|
Security guards and gambling surveillance officers |
-- | 4 | 3 |
|
Security guards |
-- | 4 | 3 |
|
Food preparation and serving related occupations |
-- | 3 | 2 |
|
Building and grounds cleaning and maintenance occupations |
11 | 9 | 6 |
|
Grounds maintenance workers |
6 | 8 | 5 |
|
Grounds maintenance workers |
6 | 8 | 5 |
|
Landscaping and groundskeeping workers |
-- | 4 | 3 |
|
Tree trimmers and pruners |
-- | 4 | 3 |
|
Personal care and service occupations |
4 | 2 | 1 |
|
Sales and related occupations |
5 | 4 | 3 |
|
Farming, fishing, and forestry occupations |
-- | 4 | 3 |
|
Agricultural workers |
-- | 3 | 2 |
|
Miscellaneous agricultural workers |
-- | 3 | 2 |
|
Construction and extraction occupations |
23 | 23 | 15 |
|
Installation, maintenance, and repair occupations |
12 | 20 | 13 |
|
Other installation, maintenance, and repair occupations |
7 | 11 | 7 |
|
Maintenance and repair workers, general |
4 | 5 | 3 |
|
Maintenance and repair workers, general |
4 | 5 | 3 |
|
Production occupations |
13 | 11 | 7 |
|
Metal workers and plastic workers |
3 | 5 | 3 |
|
Transportation and material moving occupations |
47 | 45 | 29 |
|
Motor vehicle operators |
35 | 39 | 25 |
|
Driver/sales workers and truck drivers |
34 | 37 | 24 |
|
Heavy and tractor-trailer truck drivers |
27 | 29 | 19 |
|
Material moving workers |
11 | 4 | 3 |
|
Footnotes: |
|||
|
NOTE: Data for all years are revised and final. Totals for major categories may include subcategories not shown separately. Dashes indicate no data reported or data that do not meet publication criteria. N.e.c. means "not elsewhere classified." CFOI fatal injury counts exclude illness-related deaths unless precipitated by an injury event. |
|||
| Worker characteristics | 2021 | 2022 | |
|---|---|---|---|
| Number | Number | Percent | |
|
Total |
171 | 153 | 100 |
|
Employee status |
|||
|
Wage and salary workers (1) |
139 | 128 | 84 |
|
Self-employed (2) |
32 | 25 | 16 |
|
Gender |
|||
|
Men |
161 | 143 | 93 |
|
Women |
10 | 10 | 7 |
|
Age (3) |
|||
|
20 to 24 years |
-- | 8 | 5 |
|
25 to 34 years |
28 | 31 | 20 |
|
35 to 44 years |
32 | 24 | 16 |
|
45 to 54 years |
42 | 32 | 21 |
|
55 to 64 years |
34 | 28 | 18 |
|
65 years and over |
27 | 30 | 20 |
|
Race or ethnic origin (4) |
|||
|
White, non-Hispanic |
126 | 117 | 76 |
|
Black or African-American, non-Hispanic |
27 | 20 | 13 |
|
Hispanic or Latino |
11 | 8 | 5 |
|
Asian, non-Hispanic |
4 | 4 | 3 |
|
Footnotes: |
|||
|
NOTE: Data for all years are revised and final. Totals for major categories may include subcategories not shown separately. Dashes indicate no data reported or data that do not meet publication criteria. N.e.c. means "not elsewhere classified." CFOI fatal injury counts exclude illness-related deaths unless precipitated by an injury event. |
|||
Last Modified Date: Thursday, March 07, 2024