An official website of the United States government
An official website of the United States government
The .gov means it's official.
Federal government websites often end in .gov or .mil. Before sharing sensitive information,
make sure you're on a federal government site.
The site is secure.
The
https:// ensures that you are connecting to the official website and that any
information you provide is encrypted and transmitted securely.
24-254-ATL
Friday, February 16, 2024
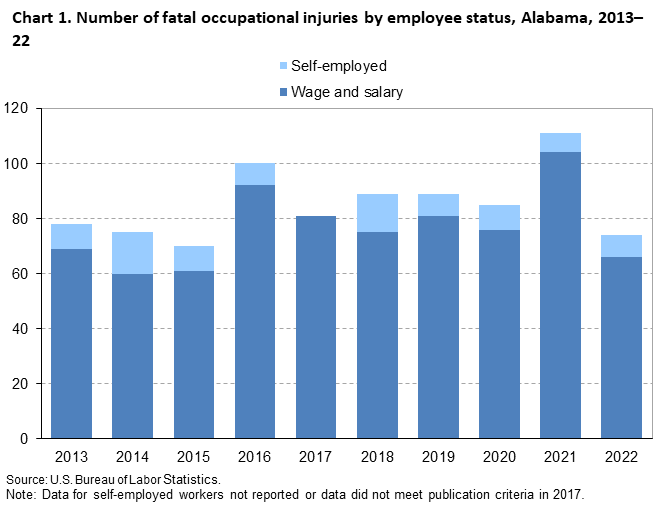
Fatal work injuries totaled 74 in 2022 for Alabama, the U.S. Bureau of Labor Statistics reported today. Regional Commissioner Victoria G. Lee noted that the number of work-related fatalities in Alabama was down from the previous year. (See chart 1.) Fatal occupational injuries in the state have ranged from a high of 155 in 1996 to a low of 70 in 2015. Nationwide, a total of 5,486 fatal work injuries were recorded in 2022, a 5.7-percent increase from 5,190 in 2021, according to the results from the Census of Fatal Occupational Injuries (CFOI).
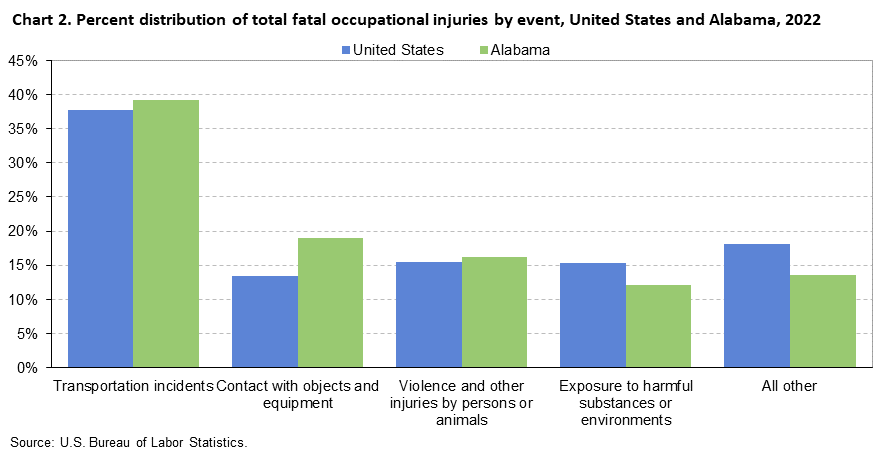
In Alabama, transportation incidents resulted in 29 fatal work injuries and accounted for 39 percent of all fatal workplace injuries in the state (See chart 2 and table 1.) Worker deaths from transportation incidents were down from 42 over the year.
Contact with objects and equipment was the second-most frequent fatal work event with 14 fatalities, down from 17 in the prior year. Violence and other injuries by persons or animals resulted in 12 work-related deaths compared to 22 in 2021.
Nationally, transportation incidents were the most frequent fatal event in 2022, accounting for 38 percent of fatal work injuries. Falls, slips, and trips were the second-most common fatal event (16 percent), followed by violence and other injuries by persons or animals along with exposure to harmful substances or environments (15 percent each).
The private transportation and warehousing industry sector had the highest number of fatalities in Alabama with 23, down from 25 in the previous year. (See table 2.) Transportation incidents resulted in 15 of the 23 fatalities in the industry. The general freight trucking industry group accounted for 14, or 61 percent, of fatal workplace injuries in this industry.
The private construction industry sector had 10 fatal workplace injuries, down from 22 in the previous year. The specialty trade contractors subsector accounted for 7 of the 10 fatal injuries in this industry.
OccupationThe transportation and material moving occupational group had the highest number of fatal workplace injuries with 28. (See table 3.) Motor vehicle operators accounted for 23 of the 28 fatalities among transportation and material workers.
Additional highlightsBackground of the program. The Census of Fatal Occupational Injuries (CFOI), part of the Bureau of Labor Statistics (BLS) Occupational Safety and Health Statistics (OSHS) program, is a count of all fatalities resulting from workplace injuries occurring in the U.S. during the calendar year. The CFOI uses a variety of state, federal, and independent data sources to identify, verify, and describe fatal work injuries. This ensures counts are as complete and accurate as possible. For the 2022 national data, over 27,200 unique source documents were reviewed as part of the data collection process. For technical information and definitions for the CFOI, see the BLS Handbook of Methods and the CFOI definitions.
Federal/State agency coverage. The CFOI includes data for all fatal work injuries, some of which may be outside the scope of other agencies or regulatory coverage. Comparisons between CFOI counts and those released by other agencies should account for the different coverage requirements and definitions used by each agency. For more information on the scope of CFOI, see Scope of the Census of Fatal Occupational Injuries and Census of Fatal Occupational Injuries: Concepts.
Latency Cases. Latent fatal occupational injury cases occur when the date of injury differs from the date of death. In some cases, the death occurs in a different year than the occupational injury and are known as cross-year latent cases. In 2022, there were 186 cases nationally where this occurred, and 157 of these latent cases occurred more than 30 days prior to the start of 2022. For more information on latent cases, see Understanding latency in fatal occupational injuries.
Coronavirus (COVID-19) Pandemic and the Census of Fatal Occupational Injuries. CFOI reports fatal workplace injuries only. These may include fatal workplace injuries complicated by an illness such as COVID-19. Fatal workplace illnesses not precipitated by an injury are not in scope for CFOI. CFOI does not report any illness related information, including COVID-19. Additional information is available on the Effects of COVID-19 Pandemic on Workplace Injuries and Illnesses, Compensation, Occupational Requirements, and Work Stoppages Statistics.
Acknowledgments. BLS thanks the Alabama Department of Labor for their efforts in collecting accurate, comprehensive, and useful data on fatal work injuries. BLS also appreciates the efforts of all federal, state, local, and private sector entities that provided source documents used to identify fatal work injuries. Among these agencies are the Occupational Safety and Health Administration; the National Transportation Safety Board; the U.S. Coast Guard; the Mine Safety and Health Administration; the Office of Workers’ Compensation Programs (Federal Employees' Compensation and Longshore and Harbor Workers' Compensation divisions); the Federal Railroad Administration; the National Highway Traffic Safety Administration; state vital statistics registrars, coroners, and medical examiners; state departments of health, labor, and industrial relations and workers' compensation agencies; state and local police departments; and state farm bureaus.
Information in this release will be made available to individuals with sensory impairments upon request. Voice phone: (202) 691-5200; Telecommunications Relay Service: 7-1-1.
| Event or exposure (1) | 2021 | 2022 | |
|---|---|---|---|
| Number | Number | Percent | |
|
Total |
111 | 74 | 100 |
|
Violence and other injuries by persons or animals |
22 | 12 | 16 |
|
Intentional injury by person |
21 | 11 | 15 |
|
Homicides--Intentional injury by other person |
-- | 7 | 9 |
|
Suicides--Self-inflicted injury--intentional |
-- | 4 | 5 |
|
Shooting--intentional self-harm |
-- | 4 | 5 |
|
Transportation incidents |
42 | 29 | 39 |
|
Roadway incidents involving motorized land vehicle |
25 | 21 | 28 |
|
Roadway collision with object other than vehicle |
12 | 11 | 15 |
|
Fires and explosions |
-- | -- | -- |
|
Falls, slips, trips |
20 | -- | -- |
|
Exposure to harmful substances or environments |
10 | 9 | 12 |
|
Exposure to other harmful substances |
4 | 4 | 5 |
|
Contact with objects and equipment |
17 | 14 | 19 |
|
Struck by object or equipment |
10 | 10 | 14 |
|
Struck by falling object or equipment--other than powered vehicle |
6 | 5 | 7 |
|
Overexertion and bodily reaction |
-- | -- | -- |
|
Footnotes: |
|||
|
NOTE: Data for all years are revised and final. Totals for major categories may include subcategories not shown separately. Dashes indicate no data reported or data that do not meet publication criteria. CFOI fatal injury counts exclude illness-related deaths unless precipitated by an injury event. |
|||
| Industry (1) | 2021 | 2022 | |
|---|---|---|---|
| Number | Number | Percent | |
|
Total |
111 | 74 | 100 |
|
Private Industry (2) |
100 | 67 | 91 |
|
Goods producing |
-- | -- | -- |
|
Natural resources and mining |
4 | 6 | 8 |
|
Agriculture, forestry, fishing and hunting |
4 | 6 | 8 |
|
Construction |
22 | 10 | 14 |
|
Construction |
22 | 10 | 14 |
|
Specialty trade contractors |
13 | 7 | 9 |
|
Manufacturing |
17 | 7 | 9 |
|
Service providing (3) |
-- | -- | -- |
|
Trade, transportation, and utilities |
-- | 30 | 41 |
|
Wholesale trade |
6 | 4 | 5 |
|
Retail trade |
-- | 3 | 4 |
|
Transportation and warehousing |
25 | 23 | 31 |
|
Truck transportation |
16 | 17 | 23 |
|
General freight trucking |
13 | 14 | 19 |
|
Information |
-- | -- | -- |
|
Financial activities |
-- | -- | -- |
|
Professional and business services |
-- | 8 | 11 |
|
Administrative and support and waste management and remediation services |
7 | 8 | 11 |
|
Educational and health services |
-- | -- | -- |
|
Leisure and hospitality |
-- | -- | -- |
|
Other services, except public administration |
4 | 2 | 3 |
|
Public administration |
-- | -- | -- |
|
Government (4) |
-- | -- | -- |
|
Federal government |
1 | -- | -- |
|
State government |
2 | 3 | 4 |
|
Local government |
7 | 3 | 4 |
|
Footnotes: |
|||
|
NOTE: Data for all years are revised and final. Totals for major categories may include subcategories not shown separately. Dashes indicate no data reported or data that do not meet publication criteria. CFOI fatal injury counts exclude illness-related deaths unless precipitated by an injury event. |
|||
| Occupation (1) | 2021 | 2022 | |
|---|---|---|---|
| Number | Number | Percent | |
|
Total |
111 | 74 | 100 |
|
Management occupations |
1 | 4 | 5 |
|
Business and financial operations occupations |
-- | -- | -- |
|
Computer and mathematical occupations |
-- | -- | -- |
|
Architecture and engineering occupations |
-- | -- | -- |
|
Life, physical, and social science occupations |
-- | -- | -- |
|
Community and social service occupations |
-- | -- | -- |
|
Legal occupations |
-- | -- | -- |
|
Educational instruction and library occupations |
-- | -- | -- |
|
Arts, design, entertainment, sports, and media occupations |
-- | -- | -- |
|
Healthcare practitioners and technical occupations |
-- | -- | -- |
|
Healthcare support occupations |
-- | -- | -- |
|
Protective service occupations |
-- | -- | -- |
|
Food preparation and serving related occupations |
-- | -- | -- |
|
Building and grounds cleaning and maintenance occupations |
3 | 6 | 8 |
|
Grounds maintenance workers |
-- | 6 | 8 |
|
Personal care and service occupations |
-- | -- | -- |
|
Sales and related occupations |
1 | 5 | 7 |
|
Office and administrative support occupations |
-- | -- | -- |
|
Farming, fishing, and forestry occupations |
-- | 3 | 4 |
|
Construction and extraction occupations |
23 | 6 | 8 |
|
Construction trades workers |
17 | 6 | 8 |
|
Installation, maintenance, and repair occupations |
14 | 6 | 8 |
|
Production occupations |
9 | 8 | 11 |
|
Metal workers and plastic workers |
-- | 4 | 5 |
|
Welding, soldering, and brazing workers |
-- | 4 | 5 |
|
Welders, cutters, solderers, and brazers |
-- | 4 | 5 |
|
Transportation and material moving occupations |
42 | 28 | 38 |
|
Motor vehicle operators |
28 | 23 | 31 |
|
Footnotes: |
|||
|
NOTE: Data for all years are revised and final. Totals for major categories may include subcategories not shown separately. Dashes indicate no data reported or data that do not meet publication criteria. CFOI fatal injury counts exclude illness-related deaths unless precipitated by an injury event. |
|||
| Worker characteristics | 2021 | 2022 | |
|---|---|---|---|
| Number | Number | Percent | |
|
Total |
111 | 74 | 100 |
|
Employee status |
|||
|
Wage and salary workers (1) |
104 | 66 | 89 |
|
Self-employed (2) |
7 | 8 | 11 |
|
Gender |
|||
|
Men |
107 | 65 | 88 |
|
Women |
4 | 9 | 12 |
|
Age (3) |
|||
|
25 to 34 years |
29 | 20 | 27 |
|
45 to 54 years |
15 | 13 | 18 |
|
55 to 64 years |
25 | 13 | 18 |
|
65 years and over |
14 | 12 | 16 |
|
Race or ethnic origin (4) |
|||
|
White, non-Hispanic |
78 | 45 | 61 |
|
Black or African-American, non-Hispanic |
23 | 21 | 28 |
|
Hispanic or Latino |
-- | -- | -- |
|
Asian, non-Hispanic |
-- | -- | -- |
|
Native Hawaiian or Pacific Islander, non-Hispanic |
-- | -- | -- |
|
Footnotes: |
|||
|
NOTE: Data for all years are revised and final. Totals for major categories may include subcategories not shown separately. Dashes indicate no data reported or data that do not meet publication criteria. CFOI fatal injury counts exclude illness-related deaths unless precipitated by an injury event. |
|||
Last Modified Date: Friday, February 16, 2024