An official website of the United States government
An official website of the United States government
The .gov means it's official.
Federal government websites often end in .gov or .mil. Before sharing sensitive information,
make sure you're on a federal government site.
The site is secure.
The
https:// ensures that you are connecting to the official website and that any
information you provide is encrypted and transmitted securely.
24-377-SAN
Thursday, February 22, 2024
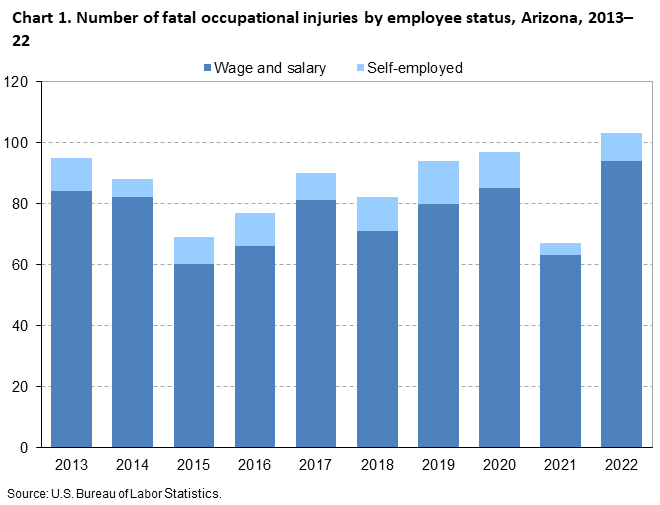
Fatal work injuries totaled 103 in 2022 for Arizona, the U.S. Bureau of Labor Statistics reported today. Regional Commissioner Chris Rosenlund noted that the number of work-related fatalities in Arizona was up from the previous year. (See chart 1.) Fatal occupational injuries in the state have ranged from a high of 118 in 2000 to a low of 55 in 1993. Nationwide, a total of 5,486 fatal work injuries were recorded in 2022, a 5.7-percent increase from 5,190 in 2021, according to the results from the Census of Fatal Occupational Injuries (CFOI).
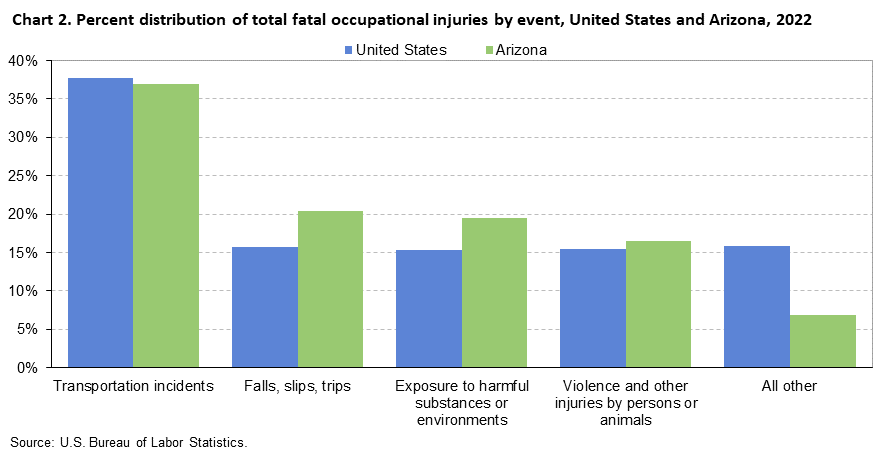
Fatal event or exposureIn Arizona, transportation incidents resulted in 38 fatal work injuries and accounted for 37 percent of all fatal workplace injuries in the state. (See chart 2 and table 1.) Worker deaths from transportation incidents were down from 46 over the year.
Falls, slips and trips was the second-most frequent fatal work event with 21 fatalities, followed closely by exposure to harmful substances or environments with 20 fatalities. Violence and other injuries by persons or animals resulted in 17 work-related deaths compared to 9 in 2021.
Nationally, transportation incidents were the most frequent fatal event in 2022, accounting for 38 percent of fatal work injuries. Falls, slips, and trips were the second-most common fatal event (16 percent), followed by both violence and other injuries by persons or animals and exposure to harmful substances or environments (15 percent each).
IndustryThe private transportation and warehousing industry sector had the highest number of fatalities in Arizona with 25, down from 28 in the previous year. (See table 2.) Transportation incidents resulted in 20 of the 25 fatalities in the industry. The general freight trucking industry group accounted for 14 of the 25 fatal workplace injuries in the transportation and warehousing industry.
The private construction industry sector had 19 fatal workplace injuries, up from 6 in the previous year. The specialty trade contractors subsector accounted for 9, or 47 percent, of the fatal injuries in this industry.
OccupationThe transportation and material moving occupational group had the highest number of fatal workplace injuries with 34. (See table 3.) Motor vehicle operators accounted for 28 of the 34 fatalities among transportation and material moving workers. The construction and extraction occupational group had the second-highest number of fatal workplace injuries with 17.
Additional highlights:White non-Hispanics accounted for 43 percent of those who died from a workplace injury. Nationwide, this group accounted for 58 percent of work-related deaths.
Workers 25-54 years old accounted for 58 percent of the state’s work-related fatalities in 2022, compared to 57 percent of on-the-job fatalities nationally.
Of the 103 fatal work injuries in Arizona, 91 percent worked for wages and salaries; the remainder were self-employed. The most frequent fatal event for both types of workers was transportation incidents.
Background of the program. The Census of Fatal Occupational Injuries (CFOI), part of the Bureau of Labor Statistics (BLS) Occupational Safety and Health Statistics (OSHS) program, is a count of all fatalities resulting from workplace injuries occurring in the U.S. during the calendar year. The CFOI uses a variety of state, federal, and independent data sources to identify, verify, and describe fatal work injuries. This ensures counts are as complete and accurate as possible. For the 2022 national data, over 27,200 unique source documents were reviewed as part of the data collection process. For technical information and definitions for the CFOI, see the BLS Handbook of Methods and the CFOI definitions.
Federal/State agency coverage. The CFOI includes data for all fatal work injuries, some of which may be outside the scope of other agencies or regulatory coverage. Comparisons between CFOI counts and those released by other agencies should account for the different coverage requirements and definitions used by each agency. For more information on the scope of CFOI, see Scope of the Census of Fatal Occupational Injuries and Census of Fatal Occupational Injuries: Concepts.
Latency Cases. Latent fatal occupational injury cases occur when the date of injury differs from the date of death. In some cases, the death occurs in a different year than the occupational injury and are known as cross-year latent cases. In 2022, there were 186 cases nationally where this occurred, and 157 of these latent cases occurred more than 30 days prior to the start of 2022. For more information on latent cases, see Understanding latency in fatal occupational injuries.
Coronavirus (COVID-19) Pandemic and the Census of Fatal Occupational Injuries. CFOI reports fatal workplace injuries only. These may include fatal workplace injuries complicated by an illness such as COVID-19. Fatal workplace illnesses not precipitated by an injury are not in scope for CFOI. CFOI does not report any illness related information, including COVID-19. Additional information is available on the Effects of COVID-19 Pandemic on Workplace Injuries and Illnesses, Compensation, Occupational Requirements, and Work Stoppages Statistics.
Acknowledgments. BLS thanks the Industrial Commission of Arizona for their efforts in collecting accurate, comprehensive, and useful data on fatal work injuries. BLS also appreciates the efforts of all federal, state, local, and private sector entities that provided source documents used to identify fatal work injuries. Among these agencies are the Occupational Safety and Health Administration; the National Transportation Safety Board; the U.S. Coast Guard; the Mine Safety and Health Administration; the Office of Workers’ Compensation Programs (Federal Employees' Compensation and Longshore and Harbor Workers' Compensation divisions); the Federal Railroad Administration; the National Highway Traffic Safety Administration; state vital statistics registrars, coroners, and medical examiners; state departments of health, labor, and industrial relations and workers' compensation agencies; state and local police departments; and state farm bureaus.
Information in this release will be made available to individuals with sensory impairments upon request. Voice phone: (202) 691-5200; Telecommunications Relay Service: 7-1-1.
| Event or exposure (1) | 2021 | 2022 | |
|---|---|---|---|
| Number | Number | Percent | |
|
Total |
67 | 103 | 100 |
|
Violence and other injuries by persons or animals |
9 | 17 | 17 |
|
Intentional injury by person |
8 | 17 | 17 |
|
Homicides--Intentional injury by other person |
8 | 14 | 14 |
|
Shooting by other person--intentional |
5 | 13 | 13 |
|
Suicides--Self-inflicted injury--intentional |
-- | 3 | 3 |
|
Transportation incidents |
46 | 38 | 37 |
|
Pedestrian vehicular incident |
9 | 4 | 4 |
|
Pedestrian struck by vehicle on side of road |
2 | 1 | 1 |
|
Pedestrian struck by forward-moving vehicle on side of road |
2 | 1 | 1 |
|
Roadway incidents involving motorized land vehicle |
31 | 31 | 30 |
|
Roadway collision with other vehicle |
18 | 20 | 19 |
|
Roadway collision--moving in same direction |
5 | 7 | 7 |
|
Roadway collision--moving in opposite directions, oncoming |
7 | 7 | 7 |
|
Roadway collision--moving perpendicularly |
2 | 3 | 3 |
|
Roadway collision with object other than vehicle |
5 | 5 | 5 |
|
Vehicle struck object or animal on side of roadway |
5 | 5 | 5 |
|
Roadway noncollision incident |
8 | 5 | 5 |
|
Jack-knifed or overturned, roadway |
5 | 4 | 4 |
|
Ran off roadway |
-- | 1 | 1 |
|
Nonroadway incident involving motorized land vehicles |
-- | 3 | 3 |
|
Nonroadway collision with object other than vehicle |
-- | 3 | 3 |
|
Fires and explosions |
-- | -- | -- |
|
Falls, slips, trips |
-- | 21 | 20 |
|
Falls on same level |
-- | 7 | 7 |
|
Falls to lower level |
-- | 13 | 13 |
|
Other fall to lower level |
-- | 9 | 9 |
|
Other fall to lower level less than 6 feet |
-- | 3 | 3 |
|
Exposure to harmful substances or environments |
-- | 20 | 19 |
|
Exposure to other harmful substances |
-- | 16 | 16 |
|
Nonmedical use of drugs or alcohol--unintentional overdose |
-- | 16 | 16 |
|
Contact with objects and equipment |
5 | 6 | 6 |
|
Struck by object or equipment |
5 | 4 | 4 |
|
Struck by falling object or equipment--other than powered vehicle |
4 | 4 | 4 |
|
Overexertion and bodily reaction |
-- | -- | -- |
|
Footnotes: |
|||
|
NOTE: Data for all years are revised and final. Totals for major categories may include subcategories not shown separately. Dashes indicate no data reported or data that do not meet publication criteria. N.e.c. means "not elsewhere classified." CFOI fatal injury counts exclude illness-related deaths unless precipitated by an injury event. |
|||
| Industry (1) | 2021 | 2022 | |
|---|---|---|---|
| Number | Number | Percent | |
|
Total |
67 | 103 | 100 |
|
Private Industry (2) |
53 | 93 | 90 |
|
Goods producing |
-- | -- | -- |
|
Natural resources and mining |
1 | -- | -- |
|
Agriculture, forestry, fishing and hunting |
-- | 4 | 4 |
|
Construction |
6 | 19 | 18 |
|
Construction |
6 | 19 | 18 |
|
Heavy and civil engineering construction |
-- | 3 | 3 |
|
Specialty trade contractors |
3 | 9 | 9 |
|
Foundation, structure, and building exterior contractors |
-- | 4 | 4 |
|
Poured concrete foundation and structure contractors |
-- | 1 | 1 |
|
Nonresidential poured concrete foundation and structure contractors |
-- | 1 | 1 |
|
Manufacturing |
-- | 9 | 9 |
|
Manufacturing |
-- | 9 | 9 |
|
Wood product manufacturing |
-- | 3 | 3 |
|
Service providing (3) |
-- | -- | -- |
|
Trade, transportation, and utilities |
-- | -- | -- |
|
Retail trade |
-- | 5 | 5 |
|
Motor vehicle and parts dealers |
-- | 1 | 1 |
|
Other motor vehicle dealers |
-- | 1 | 1 |
|
Transportation and warehousing |
28 | 25 | 24 |
|
Truck transportation |
22 | 19 | 18 |
|
General freight trucking |
11 | 14 | 14 |
|
General freight trucking, long-distance |
-- | 11 | 11 |
|
Support activities for transportation |
3 | 3 | 3 |
|
Support activities for road transportation |
3 | 3 | 3 |
|
Couriers and messengers |
-- | 1 | 1 |
|
Couriers and express delivery services |
-- | 1 | 1 |
|
Couriers and express delivery services |
-- | 1 | 1 |
|
Information |
-- | 1 | 1 |
|
Information |
-- | 1 | 1 |
|
Telecommunications |
-- | 1 | 1 |
|
Financial activities |
1 | 3 | 3 |
|
Real estate and rental and leasing |
1 | 3 | 3 |
|
Real estate |
1 | 3 | 3 |
|
Activities related to real estate |
-- | 1 | 1 |
|
Real estate property managers |
-- | 1 | 1 |
|
Residential property managers |
-- | 1 | 1 |
|
Professional and business services |
5 | 12 | 12 |
|
Professional, scientific, and technical services |
-- | 1 | 1 |
|
Professional, scientific, and technical services |
-- | 1 | 1 |
|
Architectural, engineering, and related services |
-- | 1 | 1 |
|
Testing laboratories |
-- | 1 | 1 |
|
Administrative and support and waste management and remediation services |
5 | 11 | 11 |
|
Administrative and support services |
5 | 11 | 11 |
|
Services to buildings and dwellings |
5 | 8 | 8 |
|
Landscaping services |
4 | 5 | 5 |
|
Educational and health services |
4 | -- | -- |
|
Leisure and hospitality |
-- | 4 | 4 |
|
Accommodation and food services |
-- | 4 | 4 |
|
Food services and drinking places |
-- | 4 | 4 |
|
Restaurants and other eating places |
-- | 3 | 3 |
|
Restaurants and other eating places |
-- | 3 | 3 |
|
Other services, except public administration |
2 | 3 | 3 |
|
Other services, except public administration |
2 | 3 | 3 |
|
Repair and maintenance |
2 | 3 | 3 |
|
Personal and household goods repair and maintenance |
-- | 1 | 1 |
|
Footwear and leather goods repair |
-- | 1 | 1 |
|
Public administration |
-- | -- | -- |
|
Government (4) |
14 | 10 | 10 |
|
Federal government |
6 | 1 | 1 |
|
State government |
1 | 1 | 1 |
|
Local government |
7 | 8 | 8 |
|
Footnotes: |
|||
|
NOTE: Data for all years are revised and final. Totals for major categories may include subcategories not shown separately. Dashes indicate no data reported or data that do not meet publication criteria. N.e.c. means "not elsewhere classified." CFOI fatal injury counts exclude illness-related deaths unless precipitated by an injury event. |
|||
| Occupation (1) | 2021 | 2022 | |
|---|---|---|---|
| Number | Number | Percent | |
|
Total |
67 | 103 | 100 |
|
Management occupations |
1 | 3 | 3 |
|
Other management occupations |
-- | 3 | 3 |
|
Property, real estate, and community association managers |
-- | 1 | 1 |
|
Property, real estate, and community association managers |
-- | 1 | 1 |
|
Business and financial operations occupations |
-- | -- | -- |
|
Computer and mathematical occupations |
-- | -- | -- |
|
Architecture and engineering occupations |
-- | 4 | 4 |
|
Life, physical, and social science occupations |
-- | -- | -- |
|
Community and social service occupations |
-- | -- | -- |
|
Legal occupations |
-- | -- | -- |
|
Educational instruction and library occupations |
-- | -- | -- |
|
Arts, design, entertainment, sports, and media occupations |
-- | -- | -- |
|
Healthcare practitioners and technical occupations |
2 | -- | -- |
|
Healthcare support occupations |
-- | -- | -- |
|
Protective service occupations |
-- | 9 | 9 |
|
Other protective service workers |
-- | 4 | 4 |
|
Security guards and gambling surveillance officers |
-- | 3 | 3 |
|
Security guards |
-- | 3 | 3 |
|
Food preparation and serving related occupations |
-- | 4 | 4 |
|
Building and grounds cleaning and maintenance occupations |
5 | 8 | 8 |
|
Building cleaning and pest control workers |
-- | 3 | 3 |
|
Building cleaning workers |
-- | 3 | 3 |
|
Grounds maintenance workers |
3 | 5 | 5 |
|
Grounds maintenance workers |
3 | 5 | 5 |
|
Personal care and service occupations |
-- | -- | -- |
|
Sales and related occupations |
-- | 6 | 6 |
|
Office and administrative support occupations |
-- | -- | -- |
|
Farming, fishing, and forestry occupations |
-- | -- | -- |
|
Construction and extraction occupations |
5 | 17 | 17 |
|
Installation, maintenance, and repair occupations |
-- | 7 | 7 |
|
Other installation, maintenance, and repair occupations |
-- | 4 | 4 |
|
Production occupations |
1 | 5 | 5 |
|
Textile, apparel, and furnishings workers |
-- | 1 | 1 |
|
Shoe and leather workers |
-- | 1 | 1 |
|
Shoe and leather workers and repairers |
-- | 1 | 1 |
|
Other production occupations |
-- | 1 | 1 |
|
Inspectors, testers, sorters, samplers, and weighers |
-- | 1 | 1 |
|
Inspectors, testers, sorters, samplers, and weighers |
-- | 1 | 1 |
|
Transportation and material moving occupations |
35 | 34 | 33 |
|
Motor vehicle operators |
25 | 28 | 27 |
|
Material moving workers |
5 | 4 | 4 |
|
Footnotes: |
|||
|
NOTE: Data for all years are revised and final. Totals for major categories may include subcategories not shown separately. Dashes indicate no data reported or data that do not meet publication criteria. N.e.c. means "not elsewhere classified." CFOI fatal injury counts exclude illness-related deaths unless precipitated by an injury event. |
|||
| Worker characteristics | 2021 | 2022 | |
|---|---|---|---|
| Number | Number | Percent | |
|
Total |
67 | 103 | 100 |
|
Employee status |
|||
|
Wage and salary workers (1) |
63 | 94 | 91 |
|
Self-employed (2) |
4 | 9 | 9 |
|
Gender |
|||
|
Men |
61 | 92 | 89 |
|
Women |
6 | 11 | 11 |
|
Age (3) |
|||
|
20 to 24 years |
3 | 7 | 7 |
|
25 to 34 years |
14 | 18 | 17 |
|
35 to 44 years |
14 | 23 | 22 |
|
45 to 54 years |
14 | 19 | 18 |
|
55 to 64 years |
16 | 22 | 21 |
|
65 years and over |
5 | 12 | 12 |
|
Race or ethnic origin (4) |
|||
|
White, non-Hispanic |
31 | 44 | 43 |
|
Black or African-American, non-Hispanic |
-- | 13 | 13 |
|
Hispanic or Latino |
28 | 34 | 33 |
|
Asian, non-Hispanic |
5 | -- | -- |
|
Native Hawaiian or Pacific Islander, non-Hispanic |
-- | -- | -- |
|
Footnotes: |
|||
|
NOTE: Data for all years are revised and final. Totals for major categories may include subcategories not shown separately. Dashes indicate no data reported or data that do not meet publication criteria. N.e.c. means "not elsewhere classified." CFOI fatal injury counts exclude illness-related deaths unless precipitated by an injury event. |
|||
Last Modified Date: Thursday, February 22, 2024