
An official website of the United States government
An official website of the United States government
The .gov means it's official.
Federal government websites often end in .gov or .mil. Before sharing sensitive information,
make sure you're on a federal government site.
The site is secure.
The
https:// ensures that you are connecting to the official website and that any
information you provide is encrypted and transmitted securely.
Prepare and cook to order a variety of foods that require only a short preparation time. May take orders from customers and serve patrons at counters or tables. Excludes �Cooks, Fast Food� (35-2011).
Employment estimate and mean wage estimates for Cooks, Short Order:
| Employment (1) | Employment RSE (3) |
Mean hourly wage |
Mean annual wage (2) |
Wage RSE (3) |
|---|---|---|---|---|
| 126,370 | 5.0 % | $ 16.31 | $ 33,920 | 1.1 % |
Percentile wage estimates for Cooks, Short Order:
| Percentile | 10% | 25% | 50% (Median) |
75% | 90% |
|---|---|---|---|---|---|
| Hourly Wage | $ 11.21 | $ 13.67 | $ 16.41 | $ 18.39 | $ 21.16 |
| Annual Wage (2) | $ 23,320 | $ 28,430 | $ 34,130 | $ 38,240 | $ 44,010 |
Industries with the highest published employment and wages for Cooks, Short Order are provided. For a list of all industries with employment in Cooks, Short Order, see the Create Customized Tables function.
Industries with the highest levels of employment in Cooks, Short Order:
| Industry | Employment (1) | Percent of industry employment | Hourly mean wage | Annual mean wage (2) |
|---|---|---|---|---|
| Restaurants and Other Eating Places | 77,210 | 0.71 | $ 16.12 | $ 33,520 |
| Food and Beverage Retailers (4451 and 4452 only) | 10,290 | 0.34 | $ 17.50 | $ 36,400 |
| Drinking Places (Alcoholic Beverages) | 9,330 | 2.27 | $ 17.81 | $ 37,050 |
| Special Food Services | 8,390 | 1.16 | $ 17.08 | $ 35,520 |
| Gasoline Stations | 7,050 | 0.73 | $ 13.31 | $ 27,680 |
Industries with the highest concentration of employment in Cooks, Short Order:
| Industry | Employment (1) | Percent of industry employment | Hourly mean wage | Annual mean wage (2) |
|---|---|---|---|---|
| Drinking Places (Alcoholic Beverages) | 9,330 | 2.27 | $ 17.81 | $ 37,050 |
| Special Food Services | 8,390 | 1.16 | $ 17.08 | $ 35,520 |
| Gasoline Stations | 7,050 | 0.73 | $ 13.31 | $ 27,680 |
| Restaurants and Other Eating Places | 77,210 | 0.71 | $ 16.12 | $ 33,520 |
| Amusement Parks and Arcades | 930 | 0.41 | $ 14.04 | $ 29,200 |
Top paying industries for Cooks, Short Order:
| Industry | Employment (1) | Percent of industry employment | Hourly mean wage | Annual mean wage (2) |
|---|---|---|---|---|
| Motion Picture and Video Industries | 520 | 0.13 | $ 23.16 | $ 48,160 |
| General Medical and Surgical Hospitals | 320 | 0.01 | $ 21.81 | $ 45,360 |
| Employment Services | 290 | 0.01 | $ 21.65 | $ 45,020 |
| Clothing and Clothing Accessories Retailers | (8) | (8) | $ 21.13 | $ 43,940 |
| Colleges, Universities, and Professional Schools | 120 | (7) | $ 20.47 | $ 42,590 |
States and areas with the highest published employment, location quotients, and wages for Cooks, Short Order are provided. For a list of all areas with employment in Cooks, Short Order, see the Create Customized Tables function.
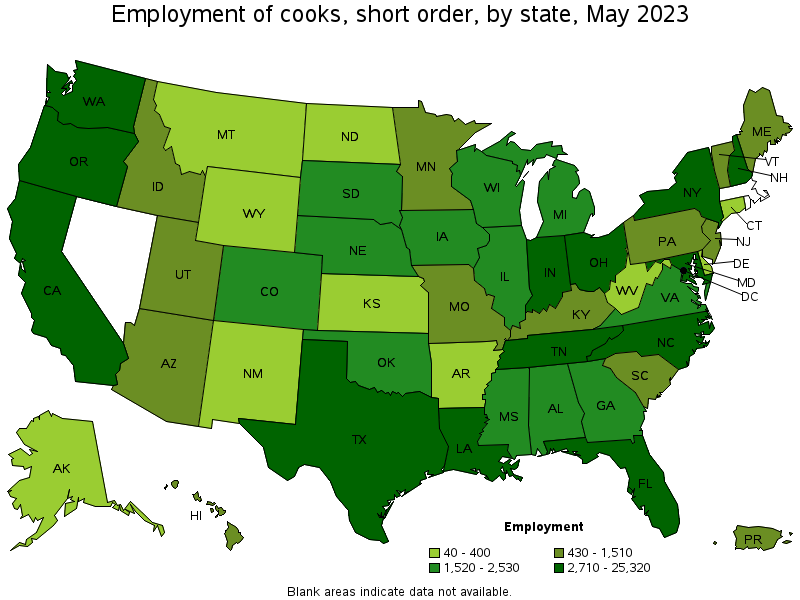
States with the highest employment level in Cooks, Short Order:
| State | Employment (1) | Employment per thousand jobs | Location quotient (9) | Hourly mean wage | Annual mean wage (2) |
|---|---|---|---|---|---|
| California | 25,320 | 1.41 | 1.70 | $ 19.00 | $ 39,520 |
| New York | 9,630 | 1.02 | 1.23 | $ 18.61 | $ 38,710 |
| Texas | 8,750 | 0.65 | 0.78 | $ 13.75 | $ 28,600 |
| Florida | 7,650 | 0.80 | 0.96 | $ 15.43 | $ 32,100 |
| Ohio | 6,270 | 1.15 | 1.38 | $ 13.41 | $ 27,900 |
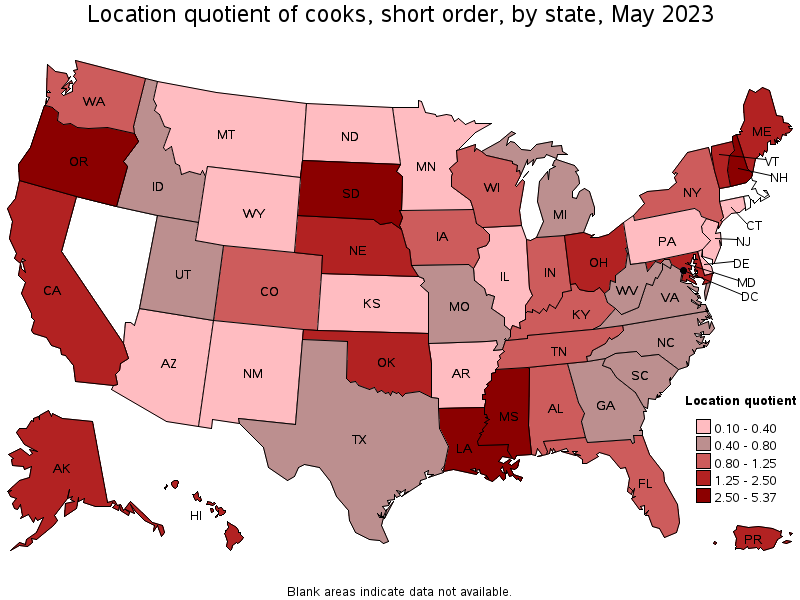
States with the highest concentration of jobs and location quotients in Cooks, Short Order:
| State | Employment (1) | Employment per thousand jobs | Location quotient (9) | Hourly mean wage | Annual mean wage (2) |
|---|---|---|---|---|---|
| New Hampshire | 3,020 | 4.47 | 5.37 | $ 15.33 | $ 31,890 |
| South Dakota | 1,810 | 4.08 | 4.90 | $ 14.86 | $ 30,900 |
| Louisiana | 5,000 | 2.70 | 3.25 | $ 12.63 | $ 26,270 |
| Oregon | 4,540 | 2.34 | 2.81 | $ 17.46 | $ 36,320 |
| Mississippi | 2,430 | 2.11 | 2.53 | $ 12.26 | $ 25,500 |
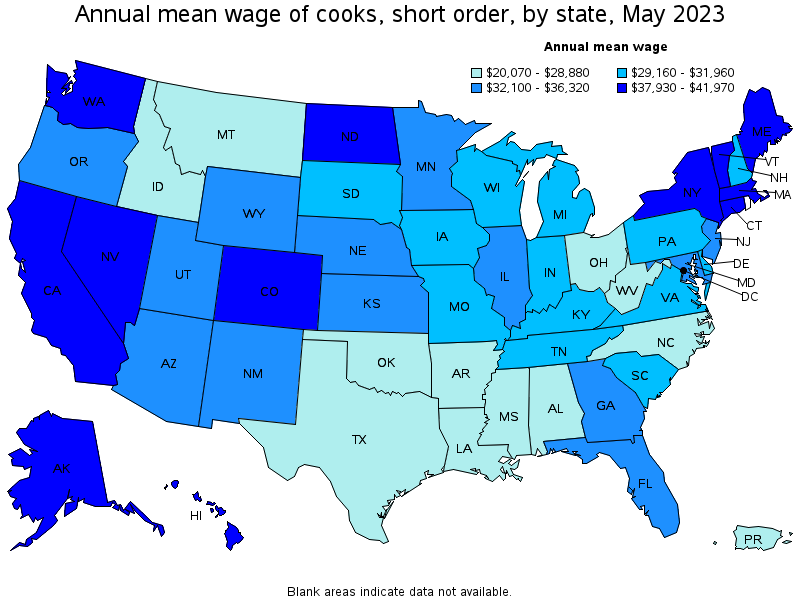
Top paying states for Cooks, Short Order:
| State | Employment (1) | Employment per thousand jobs | Location quotient (9) | Hourly mean wage | Annual mean wage (2) |
|---|---|---|---|---|---|
| Massachusetts | (8) | (8) | (8) | $ 20.18 | $ 41,970 |
| Hawaii | 910 | 1.48 | 1.78 | $ 20.09 | $ 41,790 |
| Colorado | 2,180 | 0.77 | 0.93 | $ 20.05 | $ 41,700 |
| Alaska | 360 | 1.16 | 1.39 | $ 20.04 | $ 41,690 |
| Washington | 3,270 | 0.94 | 1.13 | $ 20.00 | $ 41,600 |
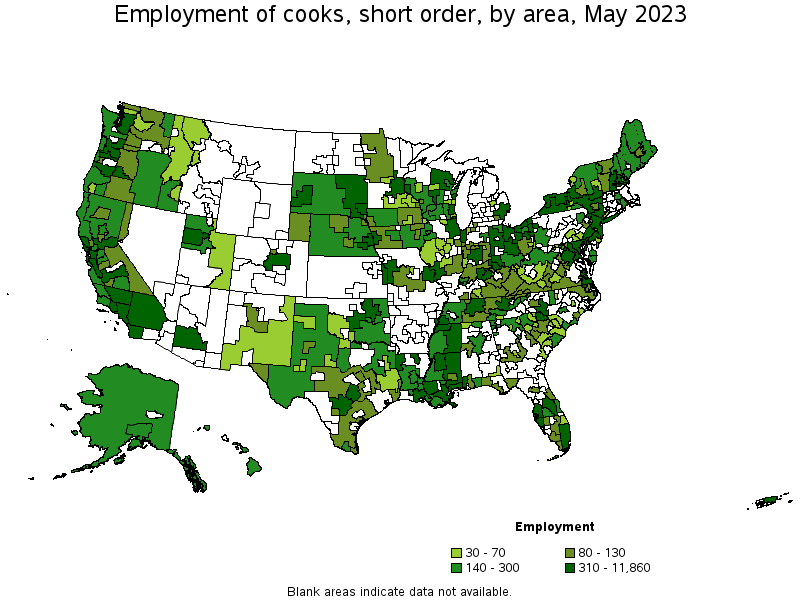
Metropolitan areas with the highest employment level in Cooks, Short Order:
| Metropolitan area | Employment (1) | Employment per thousand jobs | Location quotient (9) | Hourly mean wage | Annual mean wage (2) |
|---|---|---|---|---|---|
| Los Angeles-Long Beach-Anaheim, CA | 11,860 | 1.92 | 2.30 | $ 19.19 | $ 39,920 |
| New York-Newark-Jersey City, NY-NJ-PA | 6,870 | 0.72 | 0.87 | $ 18.90 | $ 39,320 |
| Miami-Fort Lauderdale-West Palm Beach, FL | 3,420 | 1.26 | 1.51 | $ 15.14 | $ 31,480 |
| Portland-Vancouver-Hillsboro, OR-WA | 2,710 | 2.25 | 2.70 | $ 17.97 | $ 37,370 |
| San Jose-Sunnyvale-Santa Clara, CA | 2,200 | 1.92 | 2.31 | $ 20.24 | $ 42,090 |
| San Francisco-Oakland-Hayward, CA | 2,140 | 0.88 | 1.06 | $ 20.92 | $ 43,510 |
| Seattle-Tacoma-Bellevue, WA | 2,140 | 1.03 | 1.23 | $ 20.67 | $ 42,990 |
| Washington-Arlington-Alexandria, DC-VA-MD-WV | 1,930 | 0.62 | 0.75 | $ 17.41 | $ 36,210 |
| Chicago-Naperville-Elgin, IL-IN-WI | 1,740 | 0.39 | 0.47 | $ 17.73 | $ 36,880 |
| Baltimore-Columbia-Towson, MD | 1,690 | 1.30 | 1.56 | $ 16.20 | $ 33,690 |
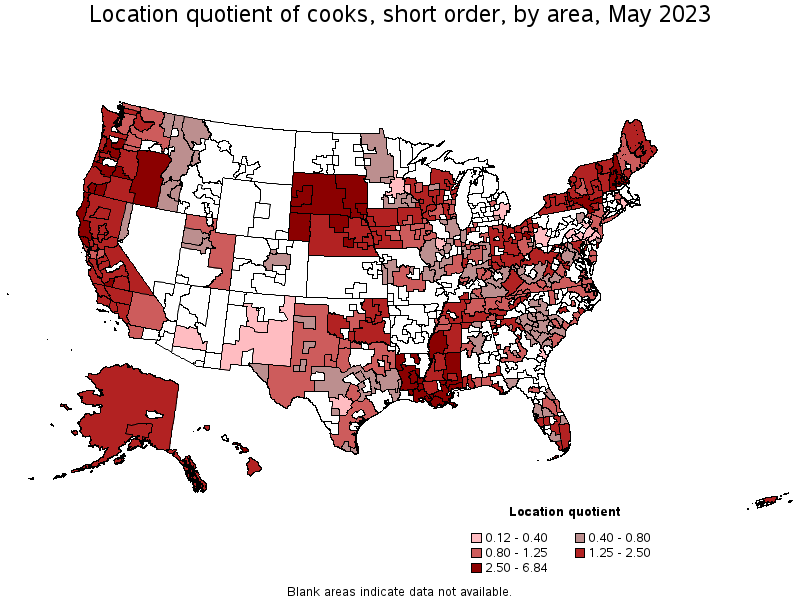
Metropolitan areas with the highest concentration of jobs and location quotients in Cooks, Short Order:
| Metropolitan area | Employment (1) | Employment per thousand jobs | Location quotient (9) | Hourly mean wage | Annual mean wage (2) |
|---|---|---|---|---|---|
| Rapid City, SD | 410 | 5.69 | 6.84 | $ 14.75 | $ 30,680 |
| Monroe, LA | 380 | 5.11 | 6.14 | $ 10.75 | $ 22,360 |
| Dover-Durham, NH-ME | 260 | 5.10 | 6.13 | $ 14.71 | $ 30,600 |
| Portsmouth, NH-ME | 420 | 4.52 | 5.43 | $ 15.81 | $ 32,870 |
| Sioux Falls, SD | 640 | 3.86 | 4.63 | $ 15.33 | $ 31,890 |
| Shreveport-Bossier City, LA | 660 | 3.84 | 4.62 | $ 11.83 | $ 24,600 |
| Manchester, NH | 410 | 3.73 | 4.48 | $ 14.87 | $ 30,940 |
| Bend-Redmond, OR | 320 | 3.57 | 4.29 | $ 17.32 | $ 36,030 |
| Lafayette, LA | 600 | 3.15 | 3.78 | $ 11.84 | $ 24,620 |
| Alexandria, LA | 170 | 2.94 | 3.53 | $ 11.94 | $ 24,840 |
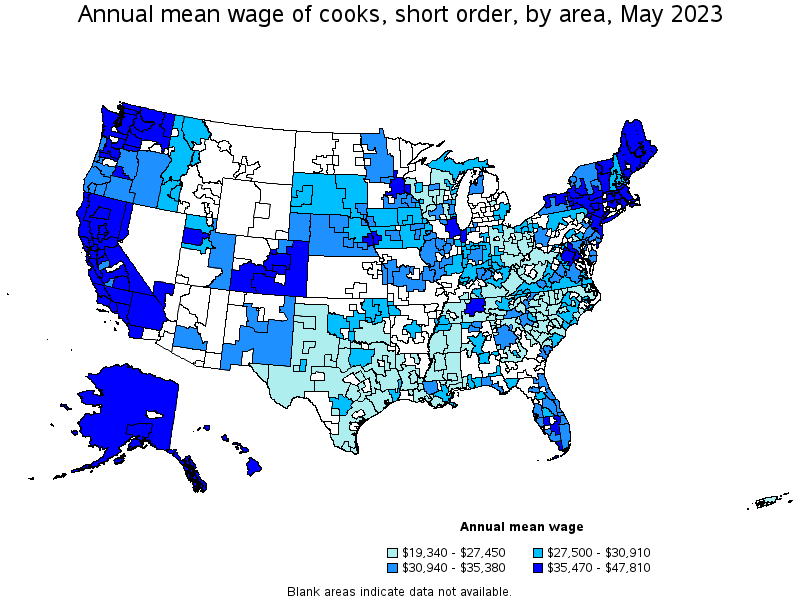
Top paying metropolitan areas for Cooks, Short Order:
| Metropolitan area | Employment (1) | Employment per thousand jobs | Location quotient (9) | Hourly mean wage | Annual mean wage (2) |
|---|---|---|---|---|---|
| Colorado Springs, CO | (8) | (8) | (8) | $ 22.99 | $ 47,810 |
| Denver-Aurora-Lakewood, CO | 980 | 0.62 | 0.74 | $ 22.68 | $ 47,180 |
| Kahului-Wailuku-Lahaina, HI | 210 | 2.74 | 3.29 | $ 21.51 | $ 44,730 |
| San Francisco-Oakland-Hayward, CA | 2,140 | 0.88 | 1.06 | $ 20.92 | $ 43,510 |
| Seattle-Tacoma-Bellevue, WA | 2,140 | 1.03 | 1.23 | $ 20.67 | $ 42,990 |
| Portland-South Portland, ME | 220 | 1.05 | 1.26 | $ 20.40 | $ 42,440 |
| Napa, CA | 130 | 1.70 | 2.04 | $ 20.35 | $ 42,320 |
| San Jose-Sunnyvale-Santa Clara, CA | 2,200 | 1.92 | 2.31 | $ 20.24 | $ 42,090 |
| Barnstable Town, MA | (8) | (8) | (8) | $ 19.97 | $ 41,550 |
| Santa Rosa, CA | 430 | 2.09 | 2.51 | $ 19.97 | $ 41,530 |
Nonmetropolitan areas with the highest employment in Cooks, Short Order:
| Nonmetropolitan area | Employment (1) | Employment per thousand jobs | Location quotient (9) | Hourly mean wage | Annual mean wage (2) |
|---|---|---|---|---|---|
| North Northeastern Ohio nonmetropolitan area (noncontiguous) | 610 | 1.89 | 2.27 | $ 11.90 | $ 24,760 |
| West Central-Southwest New Hampshire nonmetropolitan area | 520 | 5.16 | 6.20 | $ 14.49 | $ 30,140 |
| East South Dakota nonmetropolitan area | 480 | 3.63 | 4.36 | $ 14.54 | $ 30,240 |
| West Northwestern Ohio nonmetropolitan area | 440 | 1.76 | 2.12 | $ 12.70 | $ 26,420 |
| Southeast Mississippi nonmetropolitan area | 430 | 2.92 | 3.51 | $ 10.82 | $ 22,510 |
Nonmetropolitan areas with the highest concentration of jobs and location quotients in Cooks, Short Order:
| Nonmetropolitan area | Employment (1) | Employment per thousand jobs | Location quotient (9) | Hourly mean wage | Annual mean wage (2) |
|---|---|---|---|---|---|
| Northern New Hampshire nonmetropolitan area | 190 | 5.51 | 6.62 | $ 14.01 | $ 29,130 |
| West Central-Southwest New Hampshire nonmetropolitan area | 520 | 5.16 | 6.20 | $ 14.49 | $ 30,140 |
| Central New Hampshire nonmetropolitan area | 420 | 4.54 | 5.46 | $ 14.75 | $ 30,670 |
| West South Dakota nonmetropolitan area | 270 | 4.28 | 5.14 | $ 14.42 | $ 29,980 |
| East South Dakota nonmetropolitan area | 480 | 3.63 | 4.36 | $ 14.54 | $ 30,240 |
Top paying nonmetropolitan areas for Cooks, Short Order:
| Nonmetropolitan area | Employment (1) | Employment per thousand jobs | Location quotient (9) | Hourly mean wage | Annual mean wage (2) |
|---|---|---|---|---|---|
| Massachusetts nonmetropolitan area | (8) | (8) | (8) | $ 20.92 | $ 43,510 |
| Hawaii / Kauai nonmetropolitan area | 190 | 1.86 | 2.23 | $ 20.27 | $ 42,170 |
| Alaska nonmetropolitan area | 140 | 1.32 | 1.59 | $ 19.98 | $ 41,570 |
| Southern Vermont nonmetropolitan area | 120 | 1.15 | 1.38 | $ 19.22 | $ 39,970 |
| Eastern Washington nonmetropolitan area | 90 | 0.89 | 1.06 | $ 19.00 | $ 39,520 |
These estimates are calculated with data collected from employers in all industry sectors, all metropolitan and nonmetropolitan areas, and all states and the District of Columbia. The top employment and wage figures are provided above. The complete list is available in the downloadable XLS files.
The percentile wage estimate is the value of a wage below which a certain percent of workers fall. The median wage is the 50th percentile wage estimate—50 percent of workers earn less than the median and 50 percent of workers earn more than the median. More about percentile wages.
(1) Estimates for detailed occupations do not sum to the totals because the totals include occupations not shown separately. Estimates do not include self-employed workers.
(2) Annual wages have been calculated by multiplying the hourly mean wage by a "year-round, full-time" hours figure of 2,080 hours; for those occupations where there is not an hourly wage published, the annual wage has been directly calculated from the reported survey data.
(3) The relative standard error (RSE) is a measure of the reliability of a survey statistic. The smaller the relative standard error, the more precise the estimate.
(7) The value is less than .005 percent of industry employment.
(8) Estimate not released.
(9) The location quotient is the ratio of the area concentration of occupational employment to the national average concentration. A location quotient greater than one indicates the occupation has a higher share of employment than average, and a location quotient less than one indicates the occupation is less prevalent in the area than average.
Other OEWS estimates and related information:
May 2023 National Occupational Employment and Wage Estimates
May 2023 State Occupational Employment and Wage Estimates
May 2023 Metropolitan and Nonmetropolitan Area Occupational Employment and Wage Estimates
May 2023 National Industry-Specific Occupational Employment and Wage Estimates
Last Modified Date: April 3, 2024