
An official website of the United States government
An official website of the United States government
The .gov means it's official.
Federal government websites often end in .gov or .mil. Before sharing sensitive information,
make sure you're on a federal government site.
The site is secure.
The
https:// ensures that you are connecting to the official website and that any
information you provide is encrypted and transmitted securely.
Collect and organize data concerning the distribution and circulation of ground and surface water, and data on its physical, chemical, and biological properties. Measure and report on flow rates and ground water levels, maintain field equipment, collect water samples, install and collect sampling equipment, and process samples for shipment to testing laboratories. May collect data on behalf of hydrologists, engineers, developers, government agencies, or agriculture. Excludes �Hydrologists� (19-2043).
Employment estimate and mean wage estimates for Hydrologic Technicians:
| Employment (1) | Employment RSE (3) |
Mean hourly wage |
Mean annual wage (2) |
Wage RSE (3) |
|---|---|---|---|---|
| 3,000 | 4.2 % | $ 29.57 | $ 61,500 | 1.4 % |
Percentile wage estimates for Hydrologic Technicians:
| Percentile | 10% | 25% | 50% (Median) |
75% | 90% |
|---|---|---|---|---|---|
| Hourly Wage | $ 18.12 | $ 21.56 | $ 26.87 | $ 36.54 | $ 44.04 |
| Annual Wage (2) | $ 37,690 | $ 44,840 | $ 55,890 | $ 76,000 | $ 91,610 |
Industries with the highest published employment and wages for Hydrologic Technicians are provided. For a list of all industries with employment in Hydrologic Technicians, see the Create Customized Tables function.
Industries with the highest levels of employment in Hydrologic Technicians:
| Industry | Employment (1) | Percent of industry employment | Hourly mean wage | Annual mean wage (2) |
|---|---|---|---|---|
| Federal, State, and Local Government, excluding State and Local Government Schools and Hospitals and the U.S. Postal Service (OEWS Designation) | 1,720 | 0.08 | $ 30.77 | $ 64,010 |
| Local Government, excluding Schools and Hospitals (OEWS Designation) | 320 | 0.01 | $ 28.47 | $ 59,220 |
| Architectural, Engineering, and Related Services | 310 | 0.02 | $ 22.20 | $ 46,170 |
| Management, Scientific, and Technical Consulting Services | 100 | 0.01 | $ 31.43 | $ 65,370 |
| Colleges, Universities, and Professional Schools | 80 | 0.00 | $ 25.72 | $ 53,490 |
Industries with the highest concentration of employment in Hydrologic Technicians:
| Industry | Employment (1) | Percent of industry employment | Hourly mean wage | Annual mean wage (2) |
|---|---|---|---|---|
| Federal, State, and Local Government, excluding State and Local Government Schools and Hospitals and the U.S. Postal Service (OEWS Designation) | 1,720 | 0.08 | $ 30.77 | $ 64,010 |
| Electric Power Generation, Transmission and Distribution | 70 | 0.02 | $ 49.93 | $ 103,850 |
| Architectural, Engineering, and Related Services | 310 | 0.02 | $ 22.20 | $ 46,170 |
| Management, Scientific, and Technical Consulting Services | 100 | 0.01 | $ 31.43 | $ 65,370 |
| Local Government, excluding Schools and Hospitals (OEWS Designation) | 320 | 0.01 | $ 28.47 | $ 59,220 |
Top paying industries for Hydrologic Technicians:
| Industry | Employment (1) | Percent of industry employment | Hourly mean wage | Annual mean wage (2) |
|---|---|---|---|---|
| Electric Power Generation, Transmission and Distribution | 70 | 0.02 | $ 49.93 | $ 103,850 |
| Management, Scientific, and Technical Consulting Services | 100 | 0.01 | $ 31.43 | $ 65,370 |
| Federal, State, and Local Government, excluding State and Local Government Schools and Hospitals and the U.S. Postal Service (OEWS Designation) | 1,720 | 0.08 | $ 30.77 | $ 64,010 |
| Local Government, excluding Schools and Hospitals (OEWS Designation) | 320 | 0.01 | $ 28.47 | $ 59,220 |
| Colleges, Universities, and Professional Schools | 80 | (7) | $ 25.72 | $ 53,490 |
States and areas with the highest published employment, location quotients, and wages for Hydrologic Technicians are provided. For a list of all areas with employment in Hydrologic Technicians, see the Create Customized Tables function.
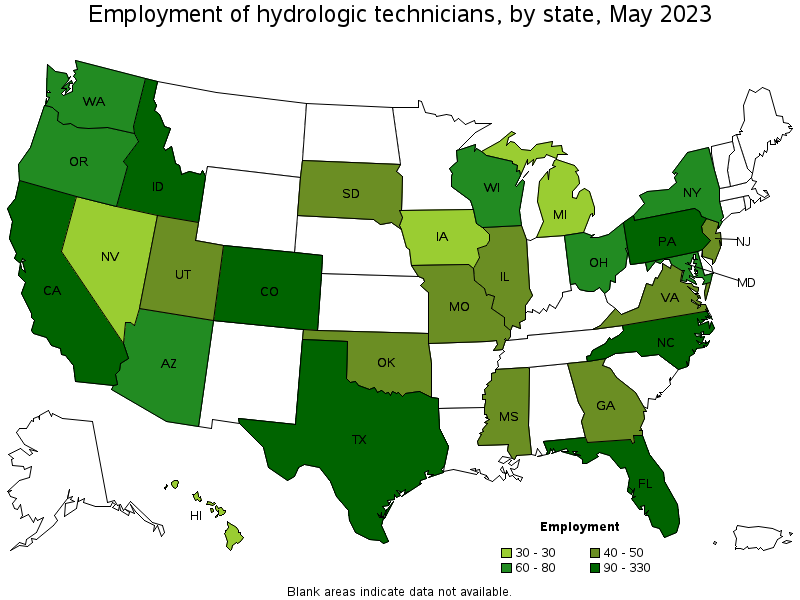
States with the highest employment level in Hydrologic Technicians:
| State | Employment (1) | Employment per thousand jobs | Location quotient (9) | Hourly mean wage | Annual mean wage (2) |
|---|---|---|---|---|---|
| California | 330 | 0.02 | 0.93 | $ 33.63 | $ 69,950 |
| Texas | 290 | 0.02 | 1.09 | $ 29.31 | $ 60,950 |
| Pennsylvania | 130 | 0.02 | 1.15 | $ 29.88 | $ 62,160 |
| North Carolina | 130 | 0.03 | 1.41 | $ 26.17 | $ 54,430 |
| Florida | 120 | 0.01 | 0.64 | $ 28.91 | $ 60,140 |
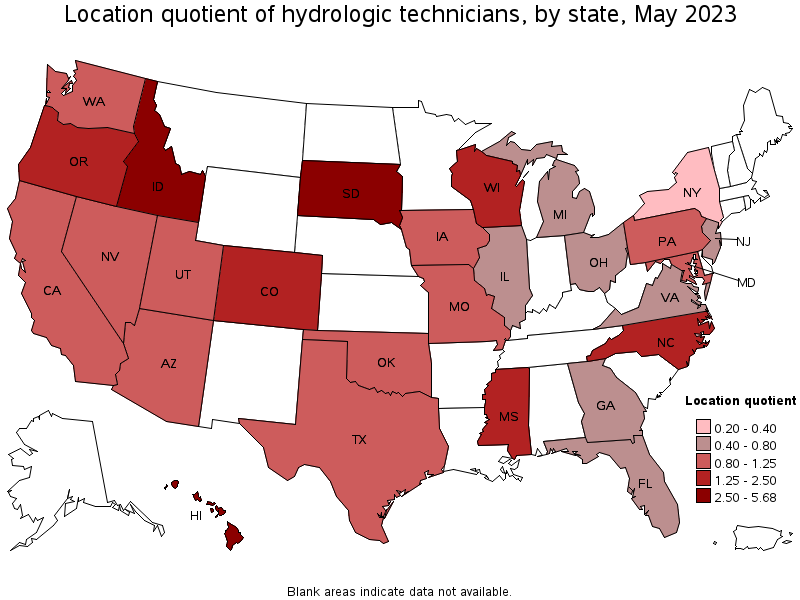
States with the highest concentration of jobs and location quotients in Hydrologic Technicians:
| State | Employment (1) | Employment per thousand jobs | Location quotient (9) | Hourly mean wage | Annual mean wage (2) |
|---|---|---|---|---|---|
| Idaho | 90 | 0.11 | 5.68 | $ 34.03 | $ 70,770 |
| South Dakota | 40 | 0.10 | 4.83 | $ 26.17 | $ 54,430 |
| Hawaii | 30 | 0.05 | 2.69 | $ 36.40 | $ 75,710 |
| Oregon | 80 | 0.04 | 2.04 | $ 30.13 | $ 62,670 |
| Colorado | 100 | 0.04 | 1.83 | $ 29.57 | $ 61,500 |
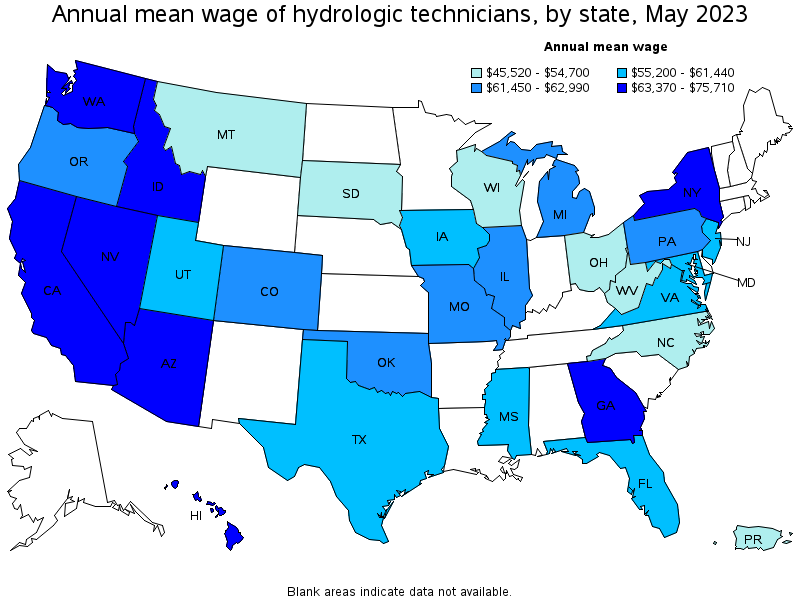
Top paying states for Hydrologic Technicians:
| State | Employment (1) | Employment per thousand jobs | Location quotient (9) | Hourly mean wage | Annual mean wage (2) |
|---|---|---|---|---|---|
| Hawaii | 30 | 0.05 | 2.69 | $ 36.40 | $ 75,710 |
| Idaho | 90 | 0.11 | 5.68 | $ 34.03 | $ 70,770 |
| Washington | 80 | 0.02 | 1.16 | $ 34.02 | $ 70,770 |
| California | 330 | 0.02 | 0.93 | $ 33.63 | $ 69,950 |
| Arizona | 80 | 0.02 | 1.22 | $ 32.77 | $ 68,150 |
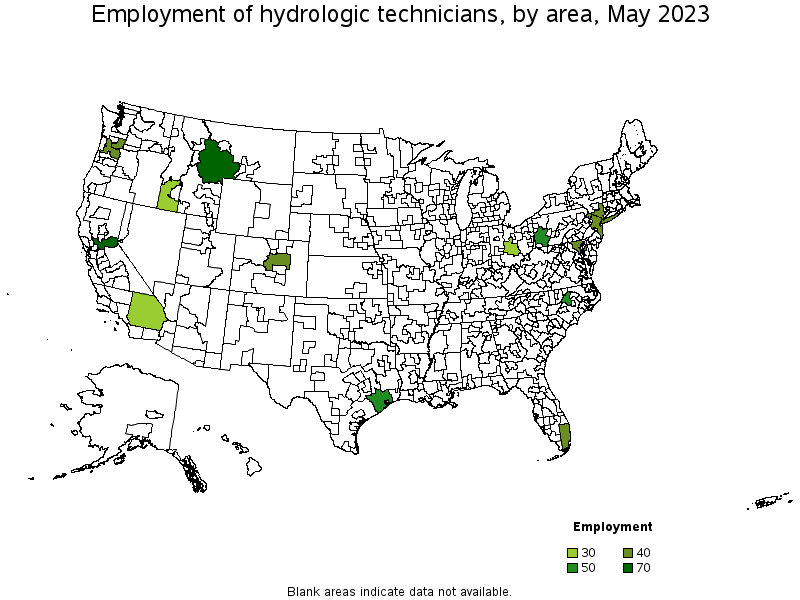
Metropolitan areas with the highest employment level in Hydrologic Technicians:
| Metropolitan area | Employment (1) | Employment per thousand jobs | Location quotient (9) | Hourly mean wage | Annual mean wage (2) |
|---|---|---|---|---|---|
| Sacramento--Roseville--Arden-Arcade, CA | 70 | 0.06 | 3.24 | $ 33.38 | $ 69,430 |
| Houston-The Woodlands-Sugar Land, TX | 50 | 0.02 | 0.86 | $ 29.22 | $ 60,780 |
| Raleigh, NC | 50 | 0.07 | 3.39 | $ 26.72 | $ 55,580 |
| Pittsburgh, PA | 50 | 0.04 | 2.20 | $ 26.95 | $ 56,060 |
| New York-Newark-Jersey City, NY-NJ-PA | 40 | 0.00 | 0.21 | $ 30.71 | $ 63,880 |
| Baltimore-Columbia-Towson, MD | 40 | 0.03 | 1.52 | $ 31.70 | $ 65,930 |
| Miami-Fort Lauderdale-West Palm Beach, FL | 40 | 0.01 | 0.72 | $ 28.74 | $ 59,770 |
| Denver-Aurora-Lakewood, CO | 40 | 0.02 | 1.23 | $ 30.28 | $ 62,970 |
| Portland-Vancouver-Hillsboro, OR-WA | 40 | 0.03 | 1.55 | $ 37.74 | $ 78,490 |
| Columbus, OH | 30 | 0.03 | 1.54 | $ 26.29 | $ 54,690 |
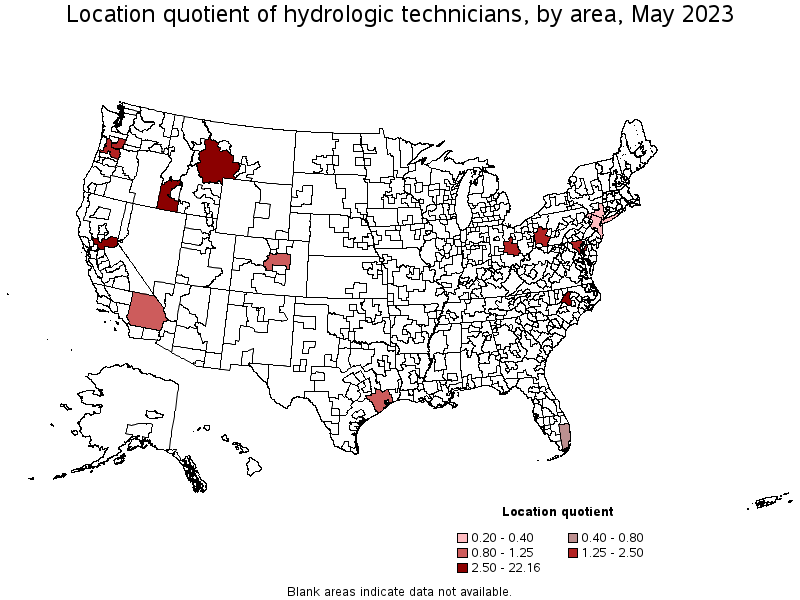
Metropolitan areas with the highest concentration of jobs and location quotients in Hydrologic Technicians:
| Metropolitan area | Employment (1) | Employment per thousand jobs | Location quotient (9) | Hourly mean wage | Annual mean wage (2) |
|---|---|---|---|---|---|
| Boise City, ID | 30 | 0.08 | 4.23 | $ 31.09 | $ 64,660 |
| Raleigh, NC | 50 | 0.07 | 3.39 | $ 26.72 | $ 55,580 |
| Sacramento--Roseville--Arden-Arcade, CA | 70 | 0.06 | 3.24 | $ 33.38 | $ 69,430 |
| Pittsburgh, PA | 50 | 0.04 | 2.20 | $ 26.95 | $ 56,060 |
| Portland-Vancouver-Hillsboro, OR-WA | 40 | 0.03 | 1.55 | $ 37.74 | $ 78,490 |
| Columbus, OH | 30 | 0.03 | 1.54 | $ 26.29 | $ 54,690 |
| Baltimore-Columbia-Towson, MD | 40 | 0.03 | 1.52 | $ 31.70 | $ 65,930 |
| Denver-Aurora-Lakewood, CO | 40 | 0.02 | 1.23 | $ 30.28 | $ 62,970 |
| Riverside-San Bernardino-Ontario, CA | 30 | 0.02 | 0.91 | $ 38.69 | $ 80,480 |
| Houston-The Woodlands-Sugar Land, TX | 50 | 0.02 | 0.86 | $ 29.22 | $ 60,780 |
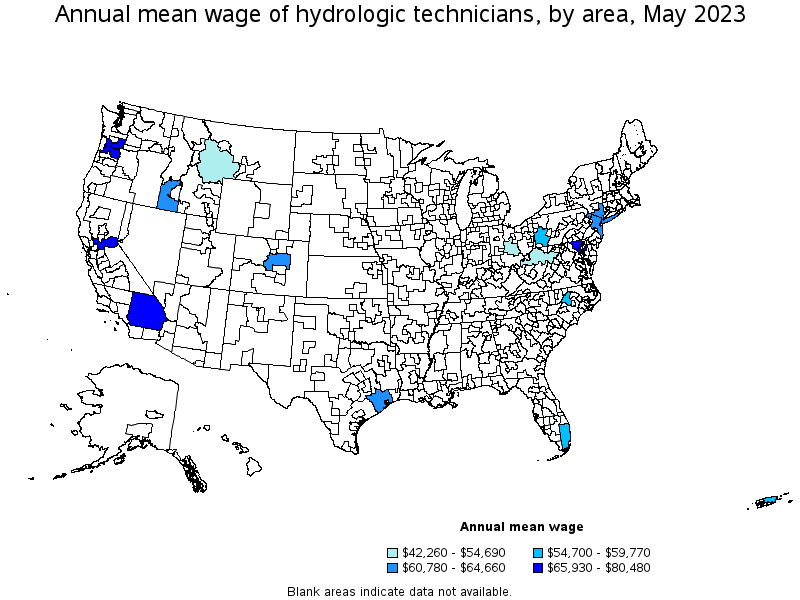
Top paying metropolitan areas for Hydrologic Technicians:
| Metropolitan area | Employment (1) | Employment per thousand jobs | Location quotient (9) | Hourly mean wage | Annual mean wage (2) |
|---|---|---|---|---|---|
| Riverside-San Bernardino-Ontario, CA | 30 | 0.02 | 0.91 | $ 38.69 | $ 80,480 |
| Portland-Vancouver-Hillsboro, OR-WA | 40 | 0.03 | 1.55 | $ 37.74 | $ 78,490 |
| Sacramento--Roseville--Arden-Arcade, CA | 70 | 0.06 | 3.24 | $ 33.38 | $ 69,430 |
| Baltimore-Columbia-Towson, MD | 40 | 0.03 | 1.52 | $ 31.70 | $ 65,930 |
| Boise City, ID | 30 | 0.08 | 4.23 | $ 31.09 | $ 64,660 |
| New York-Newark-Jersey City, NY-NJ-PA | 40 | 0.00 | 0.21 | $ 30.71 | $ 63,880 |
| Denver-Aurora-Lakewood, CO | 40 | 0.02 | 1.23 | $ 30.28 | $ 62,970 |
| Houston-The Woodlands-Sugar Land, TX | 50 | 0.02 | 0.86 | $ 29.22 | $ 60,780 |
| Miami-Fort Lauderdale-West Palm Beach, FL | 40 | 0.01 | 0.72 | $ 28.74 | $ 59,770 |
| Pittsburgh, PA | 50 | 0.04 | 2.20 | $ 26.95 | $ 56,060 |
Nonmetropolitan areas with the highest employment in Hydrologic Technicians:
| Nonmetropolitan area | Employment (1) | Employment per thousand jobs | Location quotient (9) | Hourly mean wage | Annual mean wage (2) |
|---|---|---|---|---|---|
| Southwest Montana nonmetropolitan area | 70 | 0.44 | 22.16 | $ 25.50 | $ 53,040 |
Nonmetropolitan areas with the highest concentration of jobs and location quotients in Hydrologic Technicians:
| Nonmetropolitan area | Employment (1) | Employment per thousand jobs | Location quotient (9) | Hourly mean wage | Annual mean wage (2) |
|---|---|---|---|---|---|
| Southwest Montana nonmetropolitan area | 70 | 0.44 | 22.16 | $ 25.50 | $ 53,040 |
Top paying nonmetropolitan areas for Hydrologic Technicians:
| Nonmetropolitan area | Employment (1) | Employment per thousand jobs | Location quotient (9) | Hourly mean wage | Annual mean wage (2) |
|---|---|---|---|---|---|
| Southwest Montana nonmetropolitan area | 70 | 0.44 | 22.16 | $ 25.50 | $ 53,040 |
| Northern West Virginia nonmetropolitan area | (8) | (8) | (8) | $ 20.32 | $ 42,260 |
These estimates are calculated with data collected from employers in all industry sectors, all metropolitan and nonmetropolitan areas, and all states and the District of Columbia. The top employment and wage figures are provided above. The complete list is available in the downloadable XLS files.
The percentile wage estimate is the value of a wage below which a certain percent of workers fall. The median wage is the 50th percentile wage estimate—50 percent of workers earn less than the median and 50 percent of workers earn more than the median. More about percentile wages.
(1) Estimates for detailed occupations do not sum to the totals because the totals include occupations not shown separately. Estimates do not include self-employed workers.
(2) Annual wages have been calculated by multiplying the hourly mean wage by a "year-round, full-time" hours figure of 2,080 hours; for those occupations where there is not an hourly wage published, the annual wage has been directly calculated from the reported survey data.
(3) The relative standard error (RSE) is a measure of the reliability of a survey statistic. The smaller the relative standard error, the more precise the estimate.
(7) The value is less than .005 percent of industry employment.
(8) Estimate not released.
(9) The location quotient is the ratio of the area concentration of occupational employment to the national average concentration. A location quotient greater than one indicates the occupation has a higher share of employment than average, and a location quotient less than one indicates the occupation is less prevalent in the area than average.
Other OEWS estimates and related information:
May 2023 National Occupational Employment and Wage Estimates
May 2023 State Occupational Employment and Wage Estimates
May 2023 Metropolitan and Nonmetropolitan Area Occupational Employment and Wage Estimates
May 2023 National Industry-Specific Occupational Employment and Wage Estimates
Last Modified Date: April 3, 2024