
An official website of the United States government
An official website of the United States government
The .gov means it's official.
Federal government websites often end in .gov or .mil. Before sharing sensitive information,
make sure you're on a federal government site.
The site is secure.
The
https:// ensures that you are connecting to the official website and that any
information you provide is encrypted and transmitted securely.
Employee Benefits provides comprehensive data collected as part of the National Compensation Survey. Data include estimates on the percentage of workers with access to and participating in employer provided benefit plans, as well as details of what those plans provide.
Percentage of civilian workers with access to paid leave benefits by establishment size, March 2023
Size of establishment
Personal leave
Sick leave
Vacations
Holidays
1 to 49 workers
35%
71%
70%
73%
50 to 99 workers
46%
76%
72%
73%
100 to 499 workers
57%
84%
83%
84%
500 workers or more
62%
90%
83%
85%
Access to defined contribution retirement plans
63% in 2023
![]()
Access to defined benefit retirement plans
24% in 2023
![]()
Access to paid holiday
79% in 2023
![]()
Access to paid vacation
77% in 2023
![]()
Access to paid sick leave
80% in 2023
![]()
Access to paid family leave
27% in 2023
![]()
Participating in medical care plans
49% in 2023
![]()
Access to wellness programs
46% in 2023
![]()
Access to defined contribution retirement plans
67% in 2023
![]()
Access to defined benefit retirement plans
15% in 2023
![]()
Access to paid holiday
80% in 2023
![]()
Access to paid vacation
79% in 2023
![]()
Access to paid sick leave
78% in 2023
![]()
Access to paid family leave
27% in 2023
![]()
Participating in medical care plans
46% in 2023
![]()
Access to wellness programs
43% in 2023
![]()
Access to defined contribution retirement plans
39% in 2023
![]()
Access to defined benefit retirement plans
86% in 2023
![]()
Access to paid holiday
67% in 2023
![]()
Access to paid vacation
60% in 2023
![]()
Access to paid sick leave
92% in 2023
![]()
Access to paid family leave
28% in 2023
![]()
Participating in medical care plans
67% in 2023
![]()
Access to wellness programs
63% in 2023
![]()
09/21/2023
Retirement benefits were available to 94 percent of private industry union workers. Sixty-six percent of private industry union workers had access to defined benefit plans and 63 percent had access to defined contribution plans.
HTML
|
PDF
|
RSS
|
Charts

In 2022, 10.1 percent of workers in the United States belonged to a union. This Spotlight on Statistics focuses on union membership, strike activity, and compensation in 2022. read more »
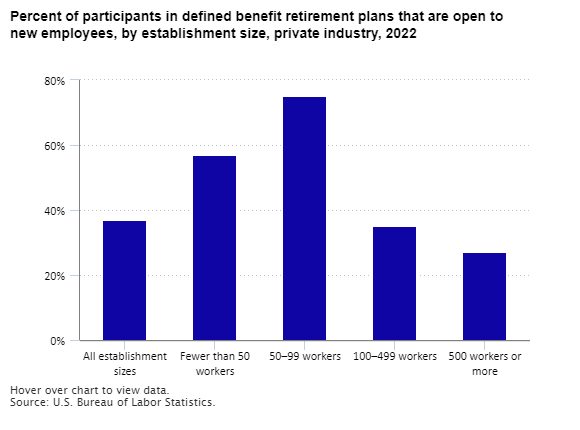
In March 2022, 15 percent of private industry workers had access to defined benefit retirement plans, and 11 percent participated in these plans. Among private industry workers participating in defined benefit plans, 37 percent participated in plans that were open to new employees. read more »

The National Compensation Survey (NCS) produces two annual publications that provide a rich amount of information on retirement plans. How retirement plans differ between private industry workers and state and local government workers is a major point of interest. What type of plans are offered to workers? Are plan characteristics different or basically the same? read more »

Using data from the U.S. Bureau of Labor Statistics (BLS) National Compensation Survey and two BLS supplemental surveys, this article examines changes to sick leave provisions and use before and during the COVID-19 pandemic. read more »