An official website of the United States government
An official website of the United States government
The .gov means it's official.
Federal government websites often end in .gov or .mil. Before sharing sensitive information,
make sure you're on a federal government site.
The site is secure.
The
https:// ensures that you are connecting to the official website and that any
information you provide is encrypted and transmitted securely.

More BLS articles about prices are available online at the following links:
Producer inflation in 2014: energy prices drop but prices for services advance
Gasoline prices experience volatility often credited to fluctuations in the crude oil market, but gasoline is subject to its own supply and demand pressures. Cyclical trends such as seasonal changes in refining costs, production adjustments, and changes in demand contribute to gasoline price movements over a typical year. Recently, however, market developments not influenced by seasonal fluctuations have affected prices. From 2010 to 2014, increased access to cost-advantaged domestic sources of crude oil has expanded domestic gasoline production, and evolving consumption patterns in the United States and abroad have altered both import and export demand.
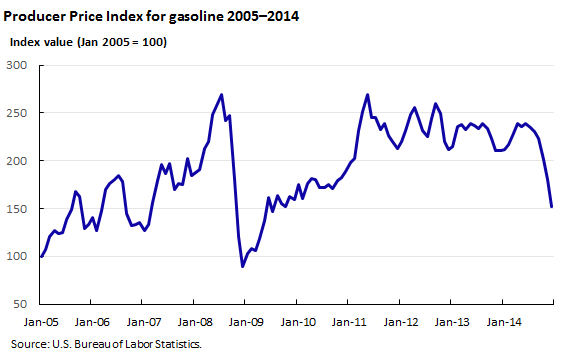
Between January 2005 and September 2008, the producer price index for gasoline trended generally higher. (See chart 1.) The onset of the Great Recession pressured producer prices lower in the fourth quarter of 2008, a 67.8-percent drop, before prices started to rebound in early 2009. By mid-2011, prices reached prerecession levels and remained in a tight range before dropping more than 50 percent in the latter half of 2014 and early 2015. This Beyond the Numbers article examines the many factors that contributed to shifting producer gasoline prices from 2005 through 2014.
The Energy Information Administration (EIA) estimates the single largest influence behind changing gasoline prices is the crude oil market, which is subject to speculation, price shocks, supply disruptions, and general uncertainty. Consumer gasoline prices also can vary depending on the cost of refining, distribution, marketing, and federal and local taxes.1 Producer gasoline prices fluctuate because of changes in crude oil prices and refining costs, both of which are highly influenced by seasonal factors.2
Environmental Protection Agency (EPA) regulations require petroleum refiners to make different blends of gasoline for the summer and the winter. Summer-blend gasoline has a lower Reid Vapor Pressure (RVP), a measure of how easily petroleum liquids evaporate, which reduces evaporative emissions that contribute to smog. EPA mandates that gasoline with lower RVP arrive at retail stations before June 1st.3 The length of the gasoline supply chain means that producers must begin refining summer-blend gasoline in March and April to meet the June 1st retail deadline. Lower RVP gasoline is sold until September 15th, after which refiners switch to winter-blend gasoline. The principal difference between the summer and winter blends of gasoline is the amount of butane blended as an additive. Winter-blend gasoline contains 10 to 12 percent butane, whereas summer-blend gasoline contains about 2 percent. Butane is less expensive and more plentiful than gasoline, so the added butane in winter-blend gasoline both lowers refining costs and effectively increases gasoline supplies.4
For gasoline refiners, there is an inverse relationship between refining costs and the RVP specification.5 Costs rise as the RVP specification decreases, therefore summer-blend gasoline typically costs several cents more per gallon to produce than the winter blend. The average monthly percent changes in the producer price index for gasoline reflect the cost differences faced by refiners during the months of transition between the winter and summer blends.6 (See chart 2.)
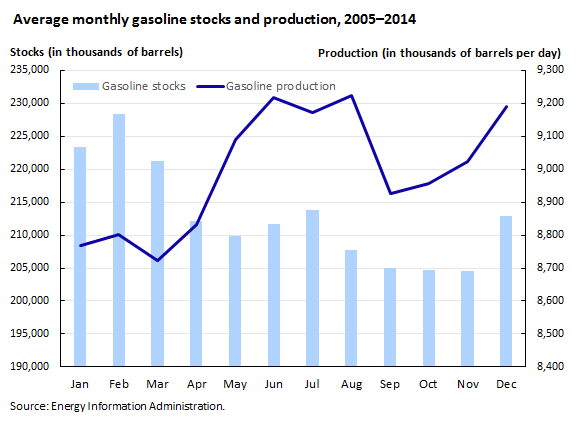
Refineries must shut down production to prepare for seasonal blend changes. Seasonal maintenance usually happens late in the first quarter and early in the fourth quarter of the year—times of relatively weak gasoline demand. Chart 3 reflects the average drop in gasoline production ahead of the gasoline blend switchovers occurring in March and September, as well as production increases in the summer and autumn months. In addition, chart 3 shows that stock levels drop off during the summer “driving season,” when domestic demand is higher.7 Production shutdowns and the added refining costs associated with summer-blend gasoline contribute to higher producer prices in the early spring months.
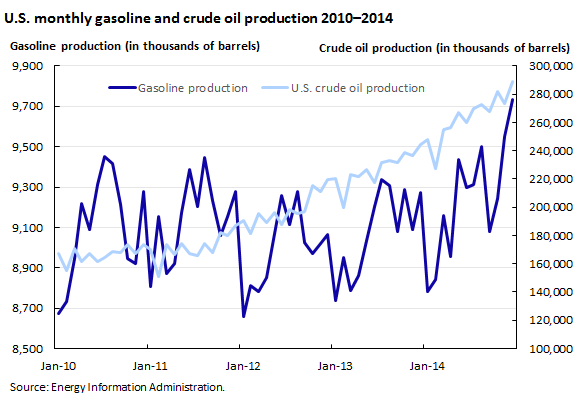
Between 2009 and 2014, the gasoline industry changed significantly because of the “shale revolution.” Crude oil extracted from shale formations using hydraulic fracturing techniques has led to expanded domestic production. EIA data shows that U.S. crude oil production increased 72.5 percent between January 2010 and December 2014. Over the same period, gasoline production increased 12.2 percent.8 (See chart 4.) These increased supplies have contributed to the PPI for gasoline decreasing 12.7 percent between January 2010 and December 2014.
In addition, refiners have increased their capacity to process crude oil. EIA annual data show refining capacity increased 1.6 percent from 2010 to 2014, mainly because of better refining capabilities.9 Refinery utilization rates increased 17.9 percent from January 2010 to December 2014.10
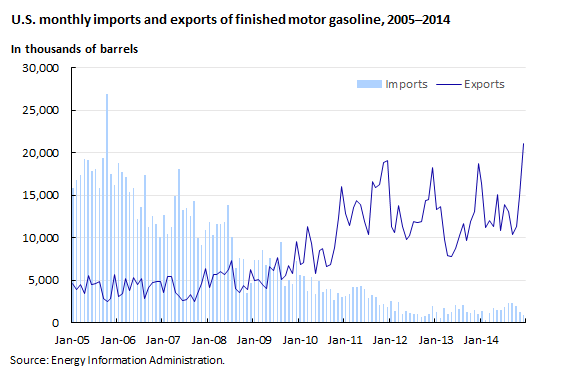
In 1975, Congress enacted the Energy Policy and Conservation Act, which placed a ban on exporting crude oil. This export ban remains in place (with some limited exceptions) to protect the domestic supply, insulate the United States from global price shocks, and keep gas prices low.11 Domestic crude oil is often held in storage in the United States, or it is refined into petroleum products and sold domestically or exported. Because much of the crude oil extracted from shale formations is ideal for gasoline refining (“light, sweet” oil), exports of gasoline have increased with the boom of domestic oil production. Gasoline exports have more than quadrupled between January 2010 and December 2014, while imports of finished gasoline fell more than 90 percent.12 (See chart 5.) The United States has been a net exporter of gasoline every month since September 2009. Exports to Latin America, Africa, and Asia continue to climb as demand increases, while imports have consistently decreased.13
The expansion of crude oil production associated with the “shale revolution” has changed the U.S. market for refined petroleum products, affecting the behavior of domestic gasoline prices beyond usual seasonal price movements. Recurring trends, such as production shutdowns and shifting refining costs related to blending protocols, will likely continue to influence seasonal gasoline price movements. However, the transition of the United States from crude oil importer to self-sufficient producer and net gasoline exporter are enormous shifts largely unforeseen a decade ago. The future impact on gasoline production, imports, exports, and, more importantly, prices has yet to be fully realized.
This Beyond the Numbers article was prepared by Lori E. Hoglund, Economist, Division of Producer Prices and Price Indexes, Office of Prices and Living Conditions, U.S. Bureau of Labor Statistics. Email: Hoglund.Lori@bls.gov, telephone: (202) 691-7024.
Lori E. Hoglund, “Gasoline prices: cyclical trends and market developments,” Beyond the Numbers: Prices & Spending, vol. 4, no. 8 (U.S. Bureau of Labor Statistics, May 2015), https://www.bls.gov/opub/btn/volume-4/gasoline-prices-cyclical-trends-market-developments.htm
1 What We Pay for a Gallon of Gasoline, U.S. Energy Information Administration (U.S. Department of Energy, April 17, 2015), www.eia.gov/petroleum/gasdiesel/.
2 U.S. Regular Gasoline Prices, U.S. Energy Information Administration (U.S. Department of Energy, April 17, 2015), www.eia.gov/petroleum/gasdiesel/.
3 Volatility / Reid Vapor Pressure (RVP), (U.S. Environmental Protection Agency, April 17, 2015), http://www.epa.gov/oms/fuels/gasolinefuels/volatility/index.htm.
4 A Primer and Gasoline Blending, (Energy Policy Research Foundation Inc., June 30, 2009), https://eprinc.org/wp-content/uploads/2015/06/Updated-Gasoline-Primer-2015.pdf.
5 Gasoline Specification Changes and Price Effects, U.S. Energy Information Administration (U.S. Department of Energy, March 25, 2015), http://www.eia.gov/petroleum/weekly/archive/2015/150325/includes/analysis_print.cfm.
6 All PPI data are recalculated 4 months after original publication, to reflect late data received from survey respondents. Data for December 2014 were revised with the release of PPI data on May 14, 2015.
7 Weekly Petroleum Status Report, Table 4, Stocks of Crude Oil by PAD District, and Stocks of Petroleum Products, U.S. Products, U.S. Energy Information Administration (U.S. Department of Energy, April 17, 2015), http://www.eia.gov/petroleum/supply/weekly/.
8 U.S. Field Production of Crude Oil, Monthly, U.S. Energy Information Administration (U.S. Department of Energy, April 17, 2015), http://www.eia.gov/dnav/pet/hist/LeafHandler.ashx?n=PET&s=MCRFPUS1&f=M.
9 U.S. Refinery Utilization and Capacity, Annual, U.S. Energy Administration (U.S. Department of Energy, April 17, 2015), http://www.eia.gov/dnav/pet/pet_pnp_unc_dcu_nus_a.htm.
10 U.S. Refinery Utilization and Capacity, Monthly, U.S. Energy Administration (U.S. Department of Energy, April 17, 2015), http://www.eia.gov/dnav/pet/pet_pnp_unc_dcu_nus_m.htm.
11 Brad Plumer, “U.S. oil exports have been banned for 40 Years. Is it time for that to change?” The Washington Post, January 8, 2014, http://www.washingtonpost.com/blogs/wonkblog/wp/2014/01/08/u-s-oil-exports-have-been-banned-for-40-years-is-it-time-for-that-to-change/. Also, see Energy Policy and Conservation Act, Pub. L. Nos. 94-163 and 113-67, Section 103 (January 15, 2014), http://legcounsel.house.gov/Comps/EPCA.pdf.
12 U.S. Exports of Finished Motor Gasoline, Monthly, U.S. Energy Information Administration (U.S. Department of Energy, April 17, 2015), http://www.eia.gov/dnav/pet/hist/LeafHandler.ashx?n=PET&s=MGFEXUS1&f=M.
13 U.S. Imports by Country of Origin, Finished Motor Gasoline, U.S Energy Information Administration (U.S. Department of Energy, April 17, 2015), http://www.eia.gov/dnav/pet/pet_move_impcus_a2_nus_epm0f_im0_mbbl_m.htm.
Publish Date: Monday, May 18, 2015