An official website of the United States government
An official website of the United States government
The .gov means it's official.
Federal government websites often end in .gov or .mil. Before sharing sensitive information,
make sure you're on a federal government site.
The site is secure.
The
https:// ensures that you are connecting to the official website and that any
information you provide is encrypted and transmitted securely.

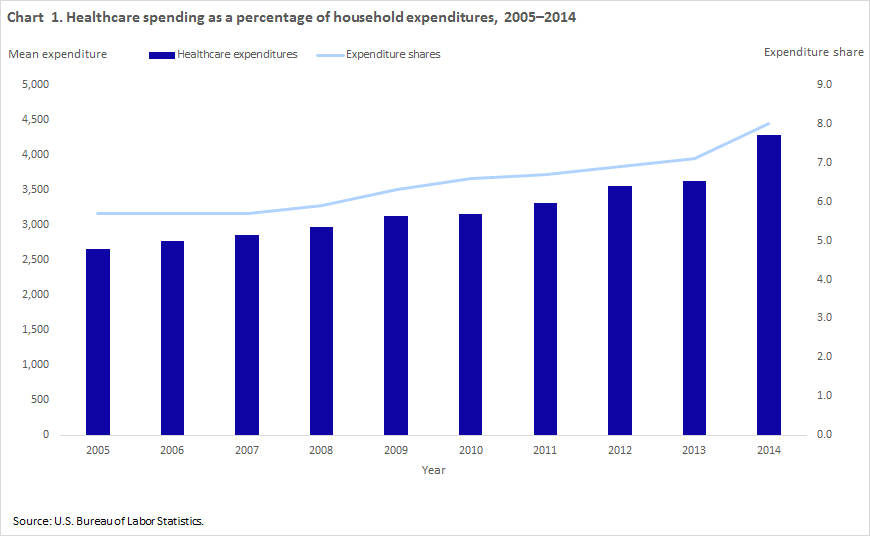
Household healthcare spending has increased in dollar amount and as a share of household spending, even during the last recession when average household expenditures (and pretax income) declined. Consumer Expenditure Survey (CE) data show that household out-of-pocket healthcare spending rose steadily from an average of $2,664 (in nominal dollars) in 2005 to $4,290 in 2014 while the share of the household budget accounted for by healthcare spending held steady at 5.7 percent over the 2005–2007 period, but increased to 8 percent in 2014. (See chart 1.)1 In contrast, average total household expenditures rose from $46,409 in 2005 to $50,486 in 2008, then fell from 2009 to 2011. Spending increased to $51,442 in 2012, fell to $51,110 in 2013, and then rose once again to $53,495 in 2014.
This Beyond the Numbers article uses 2014 CE data to examine household spending on healthcare2 and its components. The article first examines the relationship between healthcare spending and household pretax income and then the relationship between healthcare spending and the age of the reference person.3
Income and healthcare spending in 2014
Income is positively associated with most household expenditures. This means that the higher the household income, the greater the dollar amount spent on goods and services. However, the percentage of income that a household spends on a particular category depends on the item. For example, as income increases, households spend more money on food but food makes up a smaller percentage of the total household budget. In contrast, both the dollar amount and the percentage of household income spent on pensions and Social Security increase with household income. Spending on apparel and services also increases with income, but nearly all income groups spend the same percentage of their budget on this category.4
Table 1 shows household demographic information, categorized by quintiles of pretax income. Quintiles are a way of grouping data into five equal segments (or 20 percent). For this article, the first quintile represents the lowest earning 20 percent of households. Likewise the fifth quintile represents the highest earning 20 percent of households (in this case, five categories of household income; from 20 percent with the lowest income to 20 percent with the highest). Table 2 shows spending on healthcare and its components by these income groups. As incomes rose, the total amount spent on healthcare increased from $1,868 for households in the lowest income quintile to $7,219 for those in the highest. However, the share of total expenditures accounted for by healthcare followed no particular pattern and ranged from 6.9 percent for the highest income quintile to 9.7 percent for the second income quintile.
| Item | All | Lowest 20 percent | Second 20 percent | Third 20 percent | Fourth 20 percent | Highest 20 percent |
|---|---|---|---|---|---|---|
| Number of consumer units (in thousands) | 127,006 | 25,364 | 25,384 | 25,499 | 25,349 | 25,410 |
| Percent of consumer units | 100.0 | 20.0 | 20.0 | 20.0 | 20.0 | 20.0 |
| Consumer unit characteristics: | ||||||
|
Pretax income |
$66,877 | $10,308 | $27,028 | $47,056 | $76,988 | $172,952 |
|
Age of reference person |
50.3 | 51.1 | 53.6 | 49.8 | 48.3 | 48.5 |
| Average number in consumer unit: | ||||||
| Persons | 2.5 | 1.7 | 2.2 | 2.5 | 2.8 | 3.2 |
| Children under 18 | .6 | .4 | .5 | .6 | .7 | .8 |
| Persons 65 and older | .4 | .4 | .5 | .4 | .3 | .2 |
| Earners | 1.3 | .5 | .8 | 1.3 | 1.7 | 2.1 |
| Vehicles | 1.9 | .9 | 1.4 | 1.9 | 2.3 | 2.8 |
| Percent distribution: | ||||||
| Gender of reference person: | ||||||
| Male | 48 | 39 | 43 | 48 | 52 | 55 |
| Female | 52 | 61 | 57 | 52 | 48 | 45 |
| Race of reference person: | ||||||
| Black or African-American | 13 | 21 | 15 | 12 | 9 | 7 |
| White, Asian, and all other races | 87 | 79 | 85 | 88 | 91 | 93 |
| Hispanic or Latino origin of reference person: | ||||||
| Hispanic or Latino | 13 | 13 | 16 | 15 | 12 | 7 |
| Not Hispanic or Latino | 87 | 87 | 84 | 85 | 88 | 93 |
| Education of reference person: | ||||||
| Elementary (1–8) | 3 | 6 | 4 | 3 | 2 | 1 |
| High school (9–12) | 33 | 44 | 44 | 37 | 27 | 15 |
| College | 63 | 50 | 51 | 60 | 71 | 84 |
| Never attended and other | (1) | 1 | (1) | (1) | (1) | (1) |
| Housing tenure: | ||||||
| Homeowner | 63 | 39 | 53 | 61 | 74 | 86 |
| With mortgage | 37 | 13 | 20 | 33 | 51 | 66 |
| Without mortgage | 26 | 26 | 33 | 28 | 23 | 21 |
| Renter | 37 | 61 | 47 | 39 | 26 | 14 |
| At least one vehicle owned or leased | 87 | 63 | 86 | 93 | 96 | 97 |
|
(1) Value is too small to display. Source: U.S. Bureau of Labor Statistics. |
||||||
Health insurance
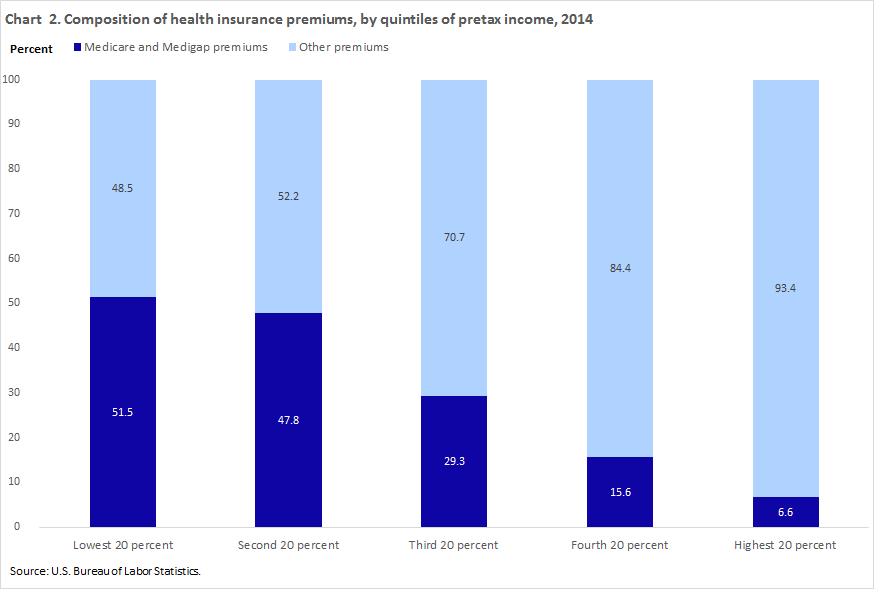
Health insurance premiums accounted for the greatest proportion of healthcare spending among households at all income levels. This category includes spending for private health insurance obtained individually or through a group plan and for amounts for Medicare Part B and Part D coverage. Spending on health insurance increased with income level from $1,192 for households in the lowest income quintile to $4,792 for households in the highest income quintile.The composition of premium dollars varied by income quintile. For example, premiums for Medicare Part B (Medical Insurance), Medicare Part D (Prescription Drug), and Medigap (commercial Medicare supplement) coverage accounted for 51.5 percent of premiums in the lowest income quintile and 47.8 percent in the second income quintile. The proportion declined to 29.3 percent in the middle-income quintile, to 15.6 percent in the fourth income quintile, and to 6.6 percent in the highest income quintile. (See chart 2.)
These findings suggest that households in the lowest two income quintiles had a greater share of retirees than those in the highest three income quintiles. In fact, households in the lowest two income quintiles were smaller (1.7 persons in the lowest income quintile and 2.2 persons in the second income quintile and had the highest average age of the reference person (51.1 years for the lowest income quintile and 53.6 for the second income quintile) compared with households in higher income quintiles. Household size ranged from 2.5 persons in the middle income quintile to 3.5 in the highest income quintile while the age of the reference person was 49.8 for the middle income quintile, 48.3 for the fourth income quintile, and 48.5 for the highest income quintile. (See table 1.) In addition, Social Security, and private and government retirement payments accounted for 45.6 percent of pretax income for the lowest income quintile and 36.6 percent in the second income quintile. In contrast, these payments ranged from 19 percent of pretax income in the middle income quintile to 3.9 percent in the highest income quintile.5
The proportion of household income from Public Assistance, SSI (Supplemental Security Income) and SNAP (Supplemental Nutrition Assistance Program) benefits was highest for the lowest income quintile (11.9 percent). These income sources went from 3 percent of pretax income in the second income quintile to less than 1 percent in each of the remaining income quintiles. These findings indicate that the pretax income of some the households in the lowest income quintile made them eligible for Medicaid assistance with premium payments and other healthcare expenses.6
Medical services
The medical services category comprises spending on hospital room and services; lab tests and x rays; medical care in a retirement community, convalescent, or nursing home; physicians' services; eye and dental care services; services by a professional other than a physician; and other medical care services.
The share of the healthcare budget accounted for by medical services ranged from 14.4 percent for the second income quintile to 20.4 percent for households in the highest income quintile.
Average spending on medical services increased from $700 for households in the third income quintile to $1,470 for households in the highest income quintile. These differences were statistically significant. The $324 spent by the lowest income quintile was not statistically different from the $470 spent by households in the second income quintile. Households in the lowest two income quintiles, however, spent significantly less on medical services than households in the three highest income quintiles. (See table 2.)
| Item | All | Lowest 20 percent | Second 20 percent | Third 20 percent | Fourth 20 percent | Highest 20 percent |
|---|---|---|---|---|---|---|
| Total annual expenditures | ||||||
|
Mean |
$53,495 | $23,713 | $33,546 | $45,395 | $60,417 | $104,363 |
|
Share |
100.0 | 100.0 | 100.0 | 100.0 | 100.0 | 100.0 |
| Healthcare | ||||||
|
Mean |
4,290 | 1,868 | 3,252 | 4,026 | 5,082 | 7,219 |
|
Share of annual expenditures |
8.0 | 7.9 | 9.7 | 8.9 | 8.4 | 6.9 |
| Health insurance | ||||||
|
Mean |
2,868 | 1,192 | 2,239 | 2,709 | 3,406 | 4,792 |
|
Share of healthcare expenditures |
66.9 | 63.8 | 68.8 | 67.3 | 67.0 | 66.4 |
| Medicare Part B premiums | ||||||
|
Mean |
431 | 402 | 674 | 516 | 349 | 212 |
|
Share of healthcare expenditures |
10.0 | 21.5 | 20.7 | 12.8 | 6.9 | 2.9 |
| Medicare Part D premiums | ||||||
|
Mean |
80 | 82 | 128 | 92 | 60 | 41 |
|
Share of healthcare expenditures |
1.9 | 4.4 | 3.9 | 2.3 | 1.2 | 0.6 |
| Commercial Medicare supplement premiums | ||||||
|
Mean |
154 | 130 | 270 | 186 | 121 | 64 |
|
Share of healthcare expenditures |
3.6 | 6.9 | 8.3 | 4.6 | 2.4 | 0.9 |
| Medical services | ||||||
|
Mean |
790 | 324 | 470 | 700 | 988 | 1470 |
|
Share of healthcare expenditures |
18.4 | 17.3 | 14.4 | 17.4 | 19.4 | 20.4 |
| Drugs | ||||||
|
Mean |
486 | 286 | 436 | 472 | 521 | 712 |
|
Share of healthcare expenditures |
11.3 | 15.3 | 13.4 | 11.7 | 10.3 | 9.9 |
| Prescription drugs | ||||||
|
Mean |
330 | 195 | 316 | 337 | 356 | 444 |
|
Share of healthcare expenditures |
7.7 | 10.4 | 9.7 | 8.4 | 7.0 | 6.2 |
| Nonprescription drugs and nonprescription vitamins | ||||||
|
Mean |
156 | 91 | 120 | 135 | 165 | 268 |
|
Share of healthcare expenditures |
3.6 | 4.9 | 3.7 | 3.3 | 3.3 | 3.7 |
| Medical supplies | ||||||
|
Mean |
146 | 66 | 108 | 145 | 167 | 245 |
|
Share of healthcare expenditures |
3.4 | 3.5 | 3.3 | 3.6 | 3.3 | 3.4 |
|
Source: U.S. Bureau of Labor Statistics. |
||||||
Drugs
In 2014, spending on drugs (prescription drugs, nonprescription drugs, and nonprescription vitamins) went from $286 for the lowest income quintile to $712 for the highest income quintile. While the amount spent by the lowest income quintile was statistically different from the amounts spent by the other income quintiles, the amounts spent by the second, third, and fourth income quintiles were not statistically different from each other. The amount spent by the highest income quintile was not statistically different from that spent by the fourth income quintile, but was statistically different from the amounts spent by first, second, and third income quintiles. The percentage of the healthcare budget represented by drug spending decreased with income quintile from 15.3 percent for the lowest income quintile to 9.9 percent for the highest income quintile. (See table 2.)
Medical supplies
This category includes spending on eyeglasses and contact lenses, hearing aids, topicals and dressings, adult diapers, purchase or rental of supportive or rehabilitative medical equipment, and purchase or rental of medical or surgical equipment for general use.
Medical supplies accounted for a negligible proportion of the healthcare budget, and narrowly ranged from 3.3 percent for the second and fourth income quintiles to 3.6 percent for the third income quintile. The $66 spent by the lowest income quintile was lower than the amounts spent by the remaining quintiles while the $245 spent by the highest income quintile was higher than the amounts spent by the other income quintiles. The amount spent by the third income quintile was not statistically different from the amounts spent by the second and fourth income quintiles, but the amount spent by the second income quintile was significantly less than that spent by the fourth income quintile. (See table 2.)
Age and healthcare spending in 2014
Using CE data, classified by age of the reference person, previous research shows that annual expenditures and pretax income are “hump” shaped over the lifecycle, lowest for the under-25-years age group, then increasing to their highest levels for the 45-to-54 age group and then declining for the remaining groups.7 While a similar pattern also exists in this research, spending on healthcare and its components does not conform to this lifecycle pattern. (See tables 3 and 4.)
| Item | All | Under 25 years | 25–34 years | 35–44 years | 45–54 years | 55–64 years | 65–74 years | 75 years and older |
|---|---|---|---|---|---|---|---|---|
| Number of consumer units (in thousands) | 127,006 | 8,405 | 20,594 | 21,778 | 23,556 | 23,466 | 16,648 | 12,559 |
| Percent of consumer units | 100.0 | 6.6 | 16.2 | 17.1 | 18.5 | 18.5 | 13.1 | 9.9 |
| Consumer unit characteristics: | ||||||||
|
Pretax income |
$66,877 | $30,081 | $61,042 | $84,094 | $87,859 | $75,241 | $52,366 | $35,467 |
|
Age of reference person |
50.3 | 21.6 | 29.7 | 39.6 | 49.8 | 59.3 | 68.8 | 81.6 |
| Average number in consumer unit: | ||||||||
| Persons | 2.5 | 2.1 | 2.8 | 3.3 | 2.8 | 2.2 | 1.9 | 1.6 |
| Children under 18 | .6 | .4 | 1.0 | 1.4 | .6 | .2 | .1 | a/ |
| Persons 65 and older | .4 | (1) | (1) | (1) | .1 | .1 | 1.4 | 1.4 |
| Earners | 1.3 | 1.3 | 1.5 | 1.6 | 1.7 | 1.3 | .7 | .3 |
| Vehicles | 1.9 | 1.1 | 1.6 | 1.9 | 2.2 | 2.1 | 1.9 | 1.4 |
| Percent distribution: | ||||||||
| Gender of reference person: | ||||||||
| Men | 48 | 47 | 49 | 47 | 49 | 48 | 50 | 40 |
| Women | 52 | 53 | 51 | 53 | 51 | 52 | 50 | 60 |
| Race of reference person: | ||||||||
| Black or African-American | 13 | 12 | 14 | 15 | 15 | 13 | 10 | 8 |
| White, Asian, and all other races | 87 | 88 | 86 | 85 | 85 | 87 | 90 | 92 |
| Hispanic or Latino origin of reference person: | ||||||||
| Hispanic or Latino | 13 | 18 | 17 | 20 | 13 | 8 | 7 | 6 |
| Not Hispanic or Latino | 87 | 82 | 83 | 80 | 87 | 92 | 93 | 94 |
| Education of reference person: | ||||||||
| Elementary (1-8) | 3 | 2 | 2 | 3 | 3 | 3 | 3 | 8 |
| High school (9-12) | 33 | 29 | 27 | 29 | 34 | 36 | 37 | 46 |
| College | 63 | 70 | 71 | 68 | 63 | 61 | 60 | 46 |
| Never attended and other | (1) | (2) | (1) | (1) | (1) | (1) | 1 | (1) |
| Housing tenure: | ||||||||
| Homeowner | 63 | 11 | 39 | 58 | 70 | 77 | 81 | 80 |
| With mortgage | 37 | 7 | 32 | 48 | 51 | 43 | 30 | 14 |
| Without mortgage | 26 | 4 | 7 | 10 | 19 | 34 | 50 | 66 |
| Renter | 37 | 89 | 61 | 42 | 30 | 23 | 19 | 20 |
| At least one vehicle owned or leased | 87 | 63 | 88 | 90 | 91 | 90 | 90 | 81 |
|
(1) Value is too small to display. (2) No data reported. Source: U.S. Bureau of Labor Statistics. |
||||||||
| Item | All | Under 25 years | 25–34 years | 35–44 years | 45–54 years | 55–64 years | 65–74 years | 75 years and older |
|---|---|---|---|---|---|---|---|---|
| Total annual expenditures | ||||||||
|
Mean |
$53,495 | $32,179 | $49,547 | $62,512 | $65,651 | $56,267 | $48,885 | $36,673 |
|
Share |
100.0 | 100.0 | 100.0 | 100.0 | 100.0 | 100.0 | 100.0 | 100.0 |
| Healthcare | ||||||||
|
Mean |
4,290 | 1,103 | 2,659 | 4,033 | 4,497 | 4,958 | 5,956 | 5,708 |
|
Share of healthcare expenditures |
8.0 | 3.4 | 5.4 | 6.5 | 6.8 | 8.8 | 12.2 | 15.6 |
| Health insurance | ||||||||
|
Mean |
2,868 | 766 | 1,910 | 2,683 | 2,936 | 3,218 | 3,985 | 3,906 |
|
Share of healthcare expenditures |
66.9 | 69.4 | 71.8 | 66.5 | 65.3 | 64.9 | 66.9 | 68.4 |
| Medicare Part B premiums | ||||||||
|
Mean |
431 | 39 | 46 | 76 | 108 | 262 | 1460 | 1493 |
|
Share |
10.0 | 3.5 | 1.7 | 1.9 | 2.4 | 5.3 | 24.5 | 26.2 |
| Medicare Part D premiums | ||||||||
|
Mean |
80 | 9 | 8 | 14 | 27 | 49 | 262 | 282 |
|
Share of healthcare expenditures |
1.9 | 0.8 | 0.3 | 0.3 | 0.6 | 1.0 | 4.4 | 4.9 |
| Commercial Medicare supplement premiums | ||||||||
|
Mean |
154 | 2 | 6 | 10 | 19 | 39 | 483 | 784 |
|
Share of healthcare expenditures |
3.6 | 0.2 | 0.2 | 0.2 | 0.4 | 0.8 | 8.1 | 13.7 |
| Medical services | ||||||||
|
Mean |
790 | 181 | 480 | 861 | 888 | 912 | 1,020 | 867 |
|
Share of healthcare expenditures |
18.4 | 16.4 | 18.1 | 21.3 | 19.7 | 18.4 | 17.1 | 15.2 |
| Drugs | ||||||||
|
Mean |
486 | 117 | 191 | 370 | 511 | 667 | 724 | 718 |
|
Share of healthcare expenditures |
11.3 | 10.6 | 7.2 | 9.2 | 11.4 | 13.5 | 12.2 | 12.6 |
| Prescription drugs | ||||||||
|
Mean |
330 | 60 | 104 | 220 | 346 | 456 | 519 | 553 |
|
Share of healthcare expenditures |
7.7 | 5.5 | 3.9 | 5.5 | 7.7 | 9.2 | 8.7 | 9.7 |
|
Nonprescription drugs and nonprescription vitamins |
||||||||
|
Mean |
156 | 56 | 87 | 150 | 166 | 212 | 205 | 165 |
|
Share of healthcare expenditures |
3.6 | 5.1 | 3.3 | 3.7 | 3.7 | 4.3 | 3.4 | 2.9 |
| Medical supplies | ||||||||
|
Mean |
146 | 39 | 77 | 119 | 162 | 161 | 227 | 218 |
|
Share of healthcare expenditures |
3.4 | 3.5 | 2.9 | 3.0 | 3.6 | 3.2 | 3.8 | 3.8 |
|
Source: U.S. Bureau of Labor Statistics. |
||||||||
Total out-of-pocket healthcare spending went from $1,103 for the under-25-years age group to $5,956 for the 65-to-74 age group. The $5,708 spent by the 75-years-and-older group was not statistically different from the amount spent by the 65-to-74 age group, but was greater than the amounts spent by all of the younger age groups. The amounts spent by the age groups 35–44, 45–54, and 55–64 were not statistically different, but were higher than those spent by the youngest two age groups and lower than those spent by the oldest two age groups. Healthcare’s share of the household budget increased with age from 3.4 percent for the under-25-years group to 15.6 percent for the 75-years-and-older group. (See table 4.)
Health insurance
Spending on health insurance premiums tended to increase with the age of the reference person. Although the $3,906 spent by the 75-years-and-older group was not statistically different from the $3,985 spent by the 65-to-74 age group, both groups spent more than each of the remaining groups. The amounts spent by the age groups, 35–44, 45–54, and 55–64 were not statistically different from each other, but each group spent significantly more than each of the youngest two age groups and significantly less than each of the oldest two groups.
Health insurance premiums accounted for the greatest share of healthcare expenditures for all groups and ranged from 64.9 percent for the 55-to-64-year old group to 71.8 percent for the 25-to-34 year old group. (See table 4.)
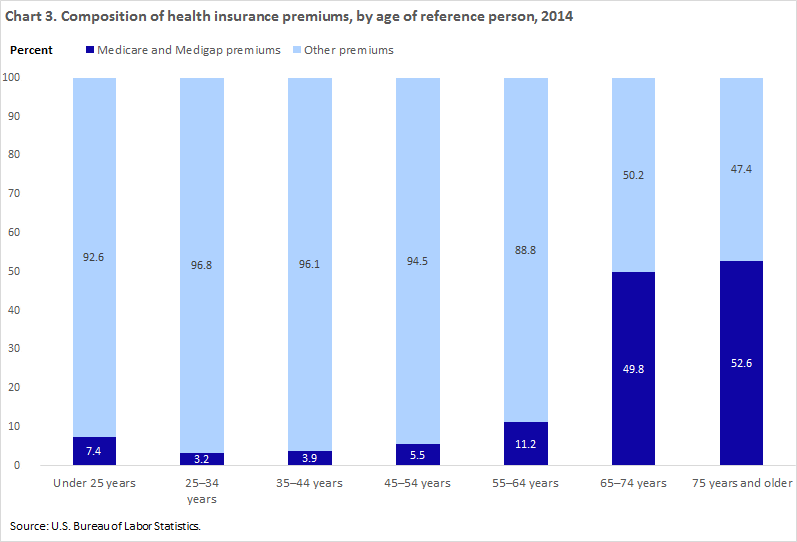
The composition of premium dollars varied by age. For example, premiums for Medicare Part B (Medical Insurance), Medicare Part D (Prescription Drug), and Medigap (commercial Medicare supplement) policies combined, accounted for 49.8 percent of premiums for the 65- to 74-year-olds and 52.6 percent for the 75-years-and-older group. For the remaining groups, this proportion ranged from 3.2 percent for the 25- to 34-year-olds to 11.2 percent for the 55- to 64-year-olds. (See chart 3.) Although most people are eligible for Medicare at age 65, they may not need to sign up for Part B coverage if they are still working and covered by their employer’s health plan. For these individuals, Part D coverage may not be needed if their employer’s plan has equivalent coverage. Because the 65- to 74- and the 75-years-and-older groups had the fewest earners (an average of .7 and .3 earners, respectively), they would be unlikely to have employer coverage that would allow them to postpone Medicare enrollment until after they were no longer employed.8
Medical services
Spending on medical services went from $181 for the under-25-years age group to $480 for the 25- to 34-year-olds. These two groups spent significantly less than each of remaining age groups. The amounts spent by the 35–44, 45–54, 55–64, and 65–74, and 75-years-and-older age groups were not statistically different from each other. Medical services followed no particular pattern and ranged from 15.2 percent for the 75-years-and-older group to 21.3 percent for the 35- to 44-year-olds. (See table 4.)
Drugs
Spending on drugs ranged from $117 for the under-25-years age group to $724 for the 65- to 74-year-olds. The amounts spent by the 55- to 64-, 65- to 74-, and 75-years-and-older groups were not statistically different from each other but were higher than those for the younger groups.
The share of the healthcare budget accounted for by drug expenditures followed no consistent pattern, ranging from 7.2 percent for the 25-to-34-age group to 13.5 percent for the 55-to-64 age group. (See table 4.)
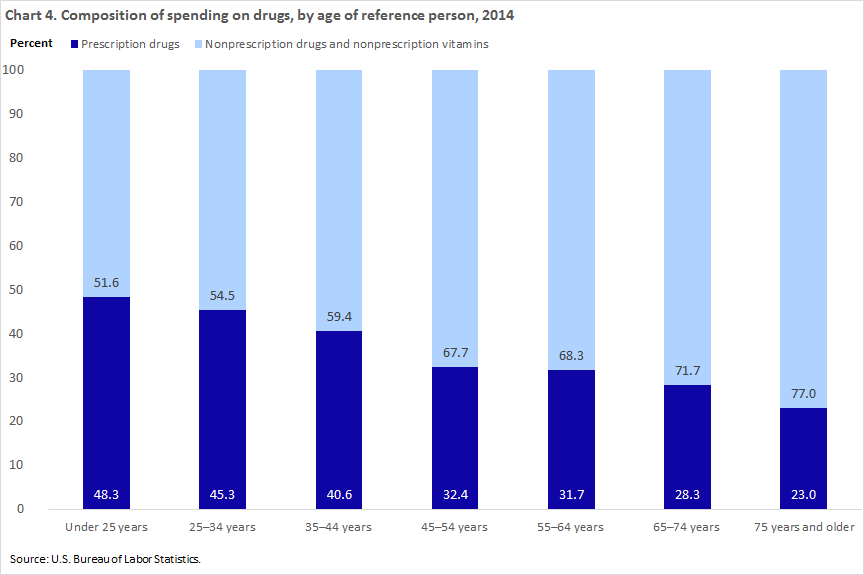
When breaking down the components of drug expenditures, however, a different pattern emerged. The share of drug spending accounted for by prescription drugs increased with age from 51.6 percent for the under-25-age group to 77 percent for the 75-years-and-older group. (See chart 4.)
Medical supplies
Spending on medical supplies was a negligible proportion of the healthcare budget and ranged from 2.9 percent for the 25-to-34 age group to 3.8 percent for the 65- to 74-year-old and the 75-years-and-older groups. The amount spent increased from $39 for the under-25-years age group to $119 for the 35-to-44-age group. All differences among the three youngest age groups were statistically significant. The age groups 45–54, 55–64, 65–74, and 75-years-and-older spent more than the younger groups, but the differences among the four oldest groups were not statistically significant. (See table 4.)
Income, age, health insurance: key factors
Pretax income and age are important factors in household healthcare spending. In 2014, healthcare expenditures increased with pretax income level, from $1,868 for the households in the lowest income quintile to $7,219 for households in the highest income quintile; all differences between income quintiles were statistically significant. Healthcare spending went from $1,103 for households in the under-25-years age group to $5,956 for the 65-to-74 age group and $5,708 for the 75-years-and-older group; not all of the spending differences between age groups were statistically significant. Spending on health insurance premiums accounted for the greatest proportion of healthcare spending among households at all income and age levels. The composition of premium dollars varied by income quintile and age level. Premiums for Medicare Part B (Medical Insurance), Medicare Part D (Prescription Drug), and Medigap (commercial Medicare supplements) coverage represented a greater proportion of premium spending among households in the lowest two income quintiles, compared with the highest three income quintiles. Premiums for Medicare and Medigap coverage represented a greater proportion of health insurance spending for households in the 65-to-74 age group and in the 75-years-and-older group than among households in the lower age groups. Households in the lowest two income quintiles spent significantly less on medical services than households in the highest three income quintiles. Households with a reference person under 25 years old or 25–34 years of age spent significantly less on medical services than older households. The dollar amount spent on drugs (prescription drugs, nonprescription drugs, and nonprescription vitamins) tended to increase with income level, but not all differences between income quintiles were statistically significant. Spending on drugs tended to increase with age, but not all differences between age groups were statistically significant. Spending on medical supplies was an extremely small proportion of the healthcare budget and accounted for less than 4 percent of such spending for households whether classified by income or by age.
This Beyond the Numbers article was prepared by Ann C. Foster, an economist in the Office of Prices and Living Conditions, Bureau of Labor Statistics. Email: foster.ann@bls.gov, telephone: (202) 691-5174.
Upon request, the information in this article will be made available to individuals who are sensory impaired. Voice phone: (202) 691-5200. Federal Relay Service: 1-800-877-8339. This article is in the public domain and may be reproduced without permission.
Ann C. Foster, “Household healthcare spending in 2014,” Beyond the Numbers: Prices & Spending, vol. 5, no. 13 (U.S. Bureau of Labor Statistics, August 2016), https://www.bls.gov/opub/btn/volume-5/household-healthcare-spending-in-2014.htm
1 The disproportionate jump in household healthcare expenditures and in the share of total expenditures accounted for by healthcare shown in chart 1 is because more households reported health insurance expenditures in 2014 than in 2013, resulting from an improvement in interview survey questions about spending on health insurance. For more information, see “Consumer Expenditures – 2014,” Note on health insurance, USDL-15-1696, Bureau of Labor Statistics, September 3, 2015, https://www.bls.gov/news.release/pdf/cesan.pdf.
2 Spending on healthcare and its components is net of any reimbursement.
3 In the Consumer Expenditure Survey (CE), the consumer unit is the entity on which expenditure reports are collected. Consumer units include families, single persons living alone or sharing a household with others but who are financially independent, or two or more persons living together who share expenses. While "consumer unit" is the proper technical term for the purposes of the CE, it is often used interchangeably with "household" or "family" for convenience. This article will use "household" instead of "consumer unit."
The reference person is the first household member mentioned by the CE respondent when asked to “Start with the name of the person, or one of the persons, who owns or rents the home.” It is with respect to this person that the relationship of the other consumer unit members is determined. For more information, see CE Glossary of Terms, Characteristics Section, https://www.bls.gov/cex/csxgloss.htm.
4 See table 1101, Quintiles of income before taxes: Annual expenditure means, shares, standard errors, and coefficient of variation, Consumer Expenditure Survey, 2014, https://www.bls.gov/cex/2014/combined/quintile.pdf
5 See table 1101, Quintiles of income before taxes: Annual expenditure means, shares, standard errors, and coefficient of variation, Consumer Expenditure Survey, 2014, https://www.bls.gov/cex/2014/combined/quintile.pdf
6 See table 1101, Quintiles of income before taxes: Annual expenditure means, shares, standard errors, and coefficient of variation, Consumer Expenditure Survey, 2014, https://www.bls.gov/cex/2014/combined/quintile.pdf.
7 For an analysis of age and spending on major consumption categories, see Ann C. Foster, “Consumer expenditures vary by age,” Beyond the Numbers: Prices and Spending, vol. 4, no. 14 (U.S. Bureau of Labor Statistics, December 2015), https://www.bls.gov/opub/btn/volume-4/consumer-expenditures-vary-by-age.htm.
8 For more information, see Medicare and You, 2016, U.S. Department of Health and Human Services, Centers for Medicare & Medicaid Services, September 2015, https://www.medicare.gov/pubs/pdf/10050.pdf.
Also, Social Security, and private and government retirement payments accounted for 46.1 percent of pretax income for the 65-to-74-age group and 70.5 percent for the 75-years-and-older group. In contrast, these payments ranged from .7 percent of income for the 25-to-34 age group to 10.3 percent for the 55-to-64 age group. See table 1300, Age of reference person: Annual expenditure means, shares, standard errors, and coefficient of variation, Consumer Expenditure Survey, 2014, https://www.bls.gov/cex/2014/combined/age.pdf.
Publish Date: Monday, August 29, 2016