An official website of the United States government
An official website of the United States government
The .gov means it's official.
Federal government websites often end in .gov or .mil. Before sharing sensitive information,
make sure you're on a federal government site.
The site is secure.
The
https:// ensures that you are connecting to the official website and that any
information you provide is encrypted and transmitted securely.

When most of the nation was recovering from the Great Recession, Rhode Island was on a different path. From June 2009 to June 2016, national employment increased by 10.1 percent while employment in Rhode Island increased by only 5.1 percent.1 To examine why Rhode Island lagged behind employment growth rates nationwide, this Beyond the Numbers article compares industry employment growth trends in Rhode Island with overall growth trends over the 2009–16 period for the United States, using data from the Bureau of Labor Statistics (BLS) Quarterly Census of Employment and Wages (QCEW) program. This 7-year period generally coincides with the national economic recovery, which officially began in June 2009.2
Using methodology that can be used for any state, this article isolates the impact of industry job growth on overall statewide job growth. The analysis suggests that had employment growth in the state’s largest supersector, education and health services, matched that of the national average, the gap between overall state employment growth and the national average would have closed by more than half. Specifically, job losses in the colleges and universities industry, within the educational services sector, and the hospital subsector, within the healthcare and social assistance sector, were responsible for depressed overall growth in this supersector and the state overall.
The QCEW program publishes a quarterly count of employment and wages reported by employers covering 98 percent of U.S. jobs, available at the county, metropolitan statistical area, state, and national levels, by industry.
In this study, QCEW data are used to present industry employment levels and changes. The most recent recession began in December 2007 and ended in June 2009 according to the National Bureau of Economic Research. The period of our analysis includes changes observed between the second quarter of 2009 (the end of the recession) and the second quarter of 2016. Supersector data are used for a general analysis, and three- and four-digit North American Industry Classification System (NAICS)-level industry data are used for more detailed analysis. Location quotient data, also available from the QCEW program, are used in the analysis as well. Location quotients allow us to compare industrial activity levels in Rhode Island with those of the national average, thus providing an approximate measure of the magnitude of a particular employment shift within a local sector’s area employment. A location quotient at 1 means that the industry activity level in Rhode Island matches the overall level of the United States. A level greater than 1 indicates that the industry activity level is more concentrated locally than the national average while a level less than 1 indicates less local concentration in this industry. Employment totals for areas and industries were added across four separate ownership categories (federal, state, and local government, and private industry). For select instances where a particular employment level for a particular ownership category was not published, the same industry employment level for the respective area and ownership category was removed for analysis in the compared period. This action maintains consistency with analysis of the over-the-period trends by industry and area using the available QCEW data. This analysis presents instances for which adjustments were made, but were minimal.
In both Rhode Island and the United States, over three-quarters of total employment is concentrated primarily in five supersectors: manufacturing; trade, transportation, and utilities; professional and business services; education and health services; and leisure and hospitality. As shown in table 1, the third and fourth largest employment supersectors, in Rhode Island and the United States in 2016 were professional and business services and leisure and hospitality. From the second quarter of 2009 to the second quarter of 2016, private sector employment in the professional and business services supersector grew 23.9 percent in Rhode Island and 21.6 percent nationally while the leisure and hospitality supersector grew 18.1 percent in the state and 19.1 percent in the nation over this period. Given the similar growth rates in these two supersectors, we can dismiss them as the cause of the divergent overall growth rates seen in Rhode Island (5.1 percent) and the United States (10.1 percent). As such, we focus our analysis on the remaining three supersectors.
| Industry | Rhode Island | United States | ||||||
|---|---|---|---|---|---|---|---|---|
| Employment | Percent change | Net change | Employment | Percent change | Net change | |||
| 2009 | 2016 | 2009 | 2016 | |||||
| Total, all ownerships | 459,429 | 482,709 | 5.1 | 23,280 | 129,648,129 | 142,780,371 | 10.1 | 13,132,242 |
|
Private industry |
397,273 | 423,054 | 6.5 | 25,781 | 107,808,161 | 121,322,193 | 12.5 | 13,514,032 |
|
Natural resources and mining |
1,095 | 1,140 | 4.1 | 45 | 1,912,366 | 1,981,506 | 3.6 | 69,140 |
|
Construction |
17,987 | 18,904 | 5.1 | 917 | 6,114,688 | 6,834,544 | 11.8 | 719,856 |
|
Manufacturing |
41,778 | 40,779 | -2.4 | -999 | 11,731,582 | 12,354,952 | 5.3 | 623,370 |
|
Trade, transportation, and utilities |
74,776 | 76,357 | 2.1 | 1,581 | 24,663,271 | 26,945,734 | 9.3 | 2,282,463 |
|
Information |
10,370 | 8,210 | -20.8 | -2,160 | 2,827,186 | 2,811,822 | -0.5 | -15,364 |
|
Financial activities |
29,890 | 30,867 | 3.3 | 977 | 7,636,914 | 7,980,005 | 4.5 | 343,091 |
|
Professional and business services |
53,629 | 66,450 | 23.9 | 12,821 | 16,477,207 | 20,043,708 | 21.6 | 3,566,501 |
|
Education and health services |
96,076 | 98,243 | 2.3 | 2,167 | 18,271,869 | 21,509,023 | 17.7 | 3,237,154 |
|
Leisure and hospitality |
53,615 | 63,337 | 18.1 | 9,722 | 13,550,371 | 16,138,176 | 19.1 | 2,587,805 |
|
Other services |
18,056 | 18,670 | 3.4 | 614 | 4,436,115 | 4,446,008 | 0.2 | 9,893 |
| Government | 62,156 | 59,655 | -4.0 | -2,501 | 21,839,968 | 21,458,178 | -1.7 | -381,790 |
|
Education and health services |
31,192 | 28,795 | -7.7 | -2,397 | 11,593,519 | 11,489,806 | -0.9 | -103,713 |
| Education and health services, all ownerships | 127,268 | 127,038 | -0.2 | -230 | 29,865,388 | 32,998,829 | 10.5 | 3,133,441 |
| Source: U.S. Bureau of Labor Statistics. | ||||||||
The largest supersector in both Rhode Island and the United states was education and health services. As public sector employment is uniquely prominent in this supersector, both government employment and total employment across all ownerships are shown for education and health services in table 1. This supersector accounted for 26 percent of statewide employment and 23 percent of national employment in 2016. While the supersector grew at a rate of 10.5 percent from 2009 to 2016 in the nation, adding over 3 million jobs, Rhode Island experienced job losses (-0.2 percent). Modest gains in private sector education and health services employment were offset by job losses in the public sector leaving the state with a net loss of 230 jobs in this supersector over the same 7-year period.
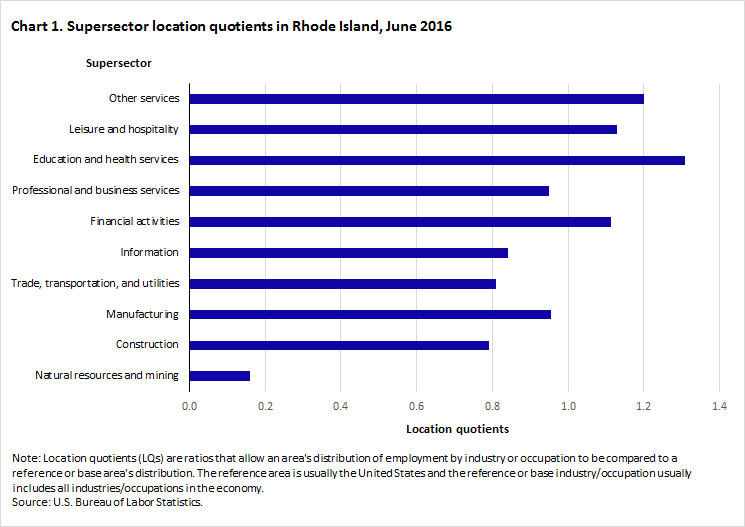
As shown in chart 1, education and health services had the highest location quotient among all supersectors in Rhode Island (1.31) indicating an above average concentration of employment in the state, compared with the national average. Given the large size, significantly differing growth rates, and high employment concentration, of the education and health services supersector, its employment trends will be the focus of further analysis later in this article.
Trade, transportation, and utilities was the second largest supersector in both areas, with 18 percent of private sector jobs in Rhode Island and 22 percent of private sector jobs nationwide. Employment in trade, transportation, and utilities grew 2.1 percent in Rhode Island over the analysis period while growing at a rate of 9.3 percent and adding over 2 million jobs nationally. Although it is the second largest supersector in the state; trade, transportation, and utilities was less concentrated locally than the national average, with a location quotient of 0.81.
The remaining supersector among the top five largest supersectors, both locally and nationally, is manufacturing. In the 7-year postrecessionary period, the manufacturing supersector experienced a loss of jobs in Rhode Island, with employment down 2.4 percent over the period. Conversely, this sector grew at a rate of 5.3 percent in the nation, adding over half a million jobs. As seen in chart 1, the manufacturing supersector had a location quotient of 0.95, indicating that local and national employment shares in this industry were similar. One of the reasons behind Rhode Island’s steeper-than-average employment decline during the Great Recession, is the large job losses in the state’s manufacturing supersector.3
As previously discussed, employment growth rates in three of the five largest supersectors in Rhode Island (education and health services; trade, transportation, and utilities; and manufacturing) differed significantly from national averages. The largest supersector, education and health services gained over 3 million jobs nationwide across the public and private sectors and was responsible for 23.9 percent of jobs added to the national economy during the 7-year analysis period. (See table 2.) In contrast, this supersector lost employment across the public and private sectors in Rhode Island over the same period.
Trade, transportation, and utilities, the next largest supersector in both areas, accounted for 17.4 percent of the nearly 13.1 million jobs added nationally during the period covered. In Rhode Island, however, this supersector accounted for 6.8 percent of the state’s overall job growth.
The manufacturing supersector was hit particularly hard during the most recent recession, losing over 2 million jobs nationwide from December 2007 to June 2009. However, in the 7-year postrecessionary period, this supersector recovered over one quarter of those jobs and that growth accounted for 4.7 percent of total job gains nationwide. In contrast, manufacturing was one of three supersectors in Rhode Island that lost jobs (and was responsible for a -4.3-percent share of overall change) during the 7-year period since the end of the recession, negating growth seen in other supersectors.
| Industry | Rhode Island | United States | ||||
|---|---|---|---|---|---|---|
| Employment | Share of change | Employment | Share of change | |||
| 2009 | 2016 | 2009 | 2016 | |||
| Total, all ownerships | 459,429 | 482,709 | 100.0 | 129,648,129 | 142,780,371 | 100.0 |
|
Private industry |
397,273 | 423,054 | 110.7 | 107,808,161 | 121,322,193 | 102.9 |
|
Natural resources and mining |
1,095 | 1,140 | 0.2 | 1,912,366 | 1,981,506 | 0.5 |
|
Construction |
17,987 | 18,904 | 3.6 | 6,114,688 | 6,834,544 | 5.3 |
|
Manufacturing |
41,778 | 40,779 | -4.3 | 11,731,582 | 12,354,952 | 4.7 |
|
Trade, transportation, and utilities |
74,776 | 76,357 | 6.8 | 24,663,271 | 26,945,734 | 17.4 |
|
Information |
10,370 | 8,210 | -9.3 | 2,827,186 | 2,811,822 | -0.1 |
|
Financial activities |
29,890 | 30,867 | 4.2 | 7,636,914 | 7,980,005 | 2.6 |
|
Professional and business services |
53,629 | 66,450 | 55.1 | 16,477,207 | 20,043,708 | 27.2 |
|
Education and health services |
96,076 | 98,243 | 9.3 | 18,271,869 | 21,509,023 | 24.7 |
|
Leisure and hospitality |
53,615 | 63,337 | 41.8 | 13,550,371 | 16,138,176 | 19.7 |
|
Other services |
18,056 | 18,670 | 2.6 | 4,436,115 | 4,446,008 | 0.1 |
| Government | 62,156 | 59,655 | -10.7 | 21,839,968 | 21,458,178 | -2.9 |
|
Education and health services |
31,192 | 28,795 | -10.3 | 11,593,519 | 11,489,806 | -0.8 |
| Education and health services, all ownerships | 127,268 | 127,038 | -1.0 | 29,865,388 | 32,998,829 | 23.9 |
| Source: U.S. Bureau of Labor Statistics. | ||||||
By applying the national rates of job growth to the three supersectors: education and health services; trade, transportation, and utilities; and manufacturing, we can assess the impact that sluggish or negative growth in each had on total employment in Rhode Island. From 2009 to 2016, the overall rate of employment growth was 5.1 percent in the state, roughly half of the national rate of 10.1 percent. (See table 3.) The growth rates in private sector employment in Rhode Island and the nation differed by 7.2 percentage points within trade, transportation, and utilities and by 7.7 percentage points in manufacturing. With both public and private employment combined, the nation outpaced Rhode Island’s job growth in the education and health services supersector by 10.7 percentage points.
If we replace Rhode Island’s 2.1-percent job growth in trade, transportation, and utilities with the national rate of 9.3 percent, the state would have added nearly 7,000 jobs as opposed to the 1,581 private sector jobs that were created in this supersector from 2009 to 2016. Adding the revised total for this supersector to the statewide employment level would have resulted in a job growth rate of 6.2 percent statewide over the period (table 3). Similarly, if we substitute the national rate of growth in the manufacturing supersector (5.3 percent) for the 2.4-percent rate of job loss in the state over the analysis period, Rhode Island would have added 2,214 jobs in this supersector as opposed to the loss of 999 jobs that was actually seen. However, given the manufacturing supersector’s relatively small size, the increase in manufacturing employment would have only raised the state’s total employment growth rate by 0.7 percentage point.
In comparison, if we apply the national 10.5-percent rate of growth in education and health services to Rhode Island’s 2009 employment level, the state would have added over 13,000 jobs in this supersector as opposed to the 230 jobs that were lost over the 7-year period. Adding these jobs to the state’s 2016 employment total would have resulted in a statewide job growth rate of 8.0 percent, closing the gap between the state and national growth rates by more than half (table 3). We can see that the lack of job growth in the largest supersector, education and health services, an area of significant growth nationwide, depressed the state’s overall job growth over the analysis period.
| Industry | Rhode Island | National growth Rate | 2016 Rhode Island employment at national growth rate | ||
|---|---|---|---|---|---|
| 2009 Employment | 2016 Employment | Growth rate | |||
|
Total, all industries |
459,429 | 482,709 | 5.1% | 10.1% | … |
|
Private industry |
397,273 | 423,054 | 6.5 | 12.5 | … |
|
Education and health services |
96,076 | 98,243 | 2.3 | 17.7 | 113,081 |
|
Trade, transportation, and utilities |
74,776 | 76,357 | 2.1 | 9.3 | 81,730 |
|
Manufacturing |
41,778 | 40,779 | -2.4 | 5.3 | 43,992 |
|
Government |
62,156 | 59,655 | -4.0 | -1.7 | 61,099 |
|
Education and health services |
31,192 | 28,795 | -7.7 | -0.9 | 30,911 |
|
Education and health services, all ownerships |
127,268 | 127,038 | -0.2 | 10.5 | 140,631 |
| Source: U.S. Bureau of Labor Statistics. | |||||
By studying the component sectors of the education and health services supersector and the subsector industries within, we observe where job growth patterns differed between the state and the nation. The education and health services supersector is comprised of the educational services and health care and social assistance sectors. One observation is that nationally public sector losses in the educational services sector were offset by private sector gains, leaving a net job gain across all ownerships of 1.0 percent. In contrast, Rhode Island lost both private and public educational services jobs from 2009 to 2016, with a net rate of job loss in the state of 7.4 percent. Within educational services, the colleges and universities industry had the highest rate of private sector job loss, down 14.4 percent, losing 1,698 private sector jobs and an additional 13 public sector jobs. (See table 4.) This job loss, combined with those of other services accounted for about half of the job loss in the sector. Nationally, colleges and universities experienced a combined employment growth rate of 5.9 percent, adding over 150,000 jobs across all ownerships. (See table 5.) Colleges and universities is the second largest industry within this sector in both Rhode Island and the United States, trailing only elementary and secondary schools, which experienced job losses locally and nationally and would therefore be less of a contributing factor to the gap in overall growth rates.
The prominent role that colleges and universities played in depressing overall employment growth in the educational services sector was mirrored by the role hospitals played within the healthcare and social assistance sector. While the healthcare and social assistance sector demonstrated job growth locally, the increase was far below the national growth rate. In Rhode Island, public sector employment grew by 7.0 percent in healthcare and social assistance, however, given the relatively low public employment levels in this sector that meant relatively few jobs added in the state. The much larger component of employment in healthcare and social assistance, private sector employment, grew at a rate of 3.9 percent in Rhode Island, compared with the 18.3 percent rate of growth seen nationally. In the United States, with the exception of public sector employment in nursing and residential care facilities, each of the subsectors of the healthcare and social assistance sector experienced increases in employment from 2009. However, in Rhode Island, hospitals, the largest subsector based on 2009 employment levels, actually experienced a loss of 1,191 private sector jobs, which more than outweighed the modest gain of 336 public sector jobs in this subsector. The job loss in this subsector depressed employment growth in the healthcare and social assistance sector by more than 25 percent.
| Industry | Rhode Island | |||
|---|---|---|---|---|
| Employment | Percent change | Net change | ||
| 2009 | 2016 | |||
|
Total, all ownerships |
459,429 | 482,709 | 5.1 | 23,280 |
|
Private industry |
397,273 | 423,054 | 6.5 | 25,781 |
|
Education and health services |
96,076 | 98,243 | 2.3 | 2,167 |
|
Educational services (NAICS 61) |
18,899 | 18,057 | -4.5 | -842 |
|
Educational services (NAICS 611) |
18,899 | 18,057 | -4.5 | -842 |
|
Elementary and secondary schools (NAICS 6111) |
4,462 | 5,234 | 17.3 | 772 |
|
Colleges and universities (NAICS 6113) |
11,752 | 10,054 | -14.4 | -1,698 |
|
Health care and social assistance (NAICS 62) |
77,177 | 80,186 | 3.9 | 3,009 |
|
Ambulatory health care services (NAICS 621) |
23,356 | 25,860 | 10.7 | 2,504 |
|
Hospitals (NAICS 622) |
24,493 | 23,302 | -4.9 | -1,191 |
|
Nursing and residential care facilities (NAICS 623) |
18,293 | 18,412 | 0.7 | 119 |
|
Social assistance (NAICS 624) |
11,035 | 12,612 | 14.3 | 1,577 |
|
Government |
62,156 | 59,655 | -4.0 | -2,501 |
|
Education and health services |
31,192 | 28,795 | -7.7 | -2,397 |
|
Educational services (NAICS 61) |
27,947 | 25,324 | -9.4 | -2,623 |
|
Educational services (NAICS 611) |
27,947 | 25,324 | -9.4 | -2,623 |
|
Elementary and secondary schools (NAICS 6111) |
23,673 | 21,051 | -11.1 | -2,622 |
|
Colleges and universities (NAICS 6113) |
3,526 | 3,513 | -0.4 | -13 |
|
Health care and social assistance (NAICS 62) |
3,245 | 3,471 | 7.0 | 226 |
|
Ambulatory health care services (NAICS 621) |
171 | 127 | -25.7 | -44 |
|
Hospitals (NAICS 622) |
1,185 | 1,521 | 28.4 | 336 |
|
Nursing and residential care facilities (NAICS 623) |
(1) | (1) | (1) | (1) |
|
Social assistance (NAICS 624) |
163 | 174 | 6.7 | 11 |
|
(1) Data not available. Source: U.S. Bureau of Labor Statistics. |
||||
| Industry | United States | |||
|---|---|---|---|---|
| Employment | Percent change | Net change | ||
| 2009 | 2016 | |||
|
Total, all ownerships |
129,648,129 | 142,780,371 | 10.1 | 13,132,242 |
|
Private industry |
107,808,161 | 121,322,193 | 12.5 | 13,514,032 |
|
Education and health services |
18,271,869 | 21,509,023 | 17.7 | 3,237,154 |
|
Educational services (NAICS 61) |
2,349,862 | 2,666,575 | 13.5 | 316,713 |
|
Educational services (NAICS 611) |
2,349,862 | 2,666,575 | 13.5 | 316,713 |
|
Elementary and secondary schools (NAICS 6111) |
655,180 | 760,547 | 16.1 | 105,367 |
|
Colleges and universities (NAICS 6113) |
1,052,554 | 1,146,776 | 9.0 | 94,222 |
|
Health care and social assistance (NAICS 62) |
15,922,007 | 18,842,448 | 18.3 | 2,920,441 |
|
Ambulatory health care services (NAICS 621) |
5,785,964 | 7,033,115 | 21.6 | 1,247,151 |
|
Hospitals (NAICS 622) |
4,634,712 | 4,928,372 | 6.3 | 293,660 |
|
Nursing and residential care facilities (NAICS 623) |
3,088,283 | 3,307,875 | 7.1 | 219,592 |
|
Social assistance (NAICS 624) |
2,413,048 | 3,573,086 | 48.1 | 1,160,038 |
|
Government |
21,839,968 | 21,458,178 | -1.7 | -381,790 |
|
Education and health services |
11,593,519 | 11,489,806 | -0.9 | -103,713 |
|
Educational services (NAICS 61) |
9,727,411 | 9,537,345 | -2.0 | -190,066 |
|
Educational services (NAICS 611) |
9,727,411 | 9,537,345 | -2.0 | -190,066 |
|
Elementary and secondary schools (NAICS 6111) |
7,454,891 | 7,202,780 | -3.4 | -252,111 |
|
Colleges and universities (NAICS 6113) |
1,599,461 | 1,662,068 | 3.9 | 62,607 |
|
Health care and social assistance (NAICS 62) |
1,866,108 | 1,952,461 | 4.6 | 86,353 |
|
Ambulatory health care services (NAICS 621) |
103,951 | 143,286 | 37.8 | 39,335 |
|
Hospitals (NAICS 622) |
1,296,459 | 1,357,679 | 4.7 | 61,220 |
|
Nursing and residential care facilities (NAICS 623) |
220,510 | 194,026 | -12.0 | -26,484 |
|
Social assistance (NAICS 624) |
245,188 | 257,470 | 5.0 | 12,282 |
| Source: U.S. Bureau of Labor Statistics. | ||||
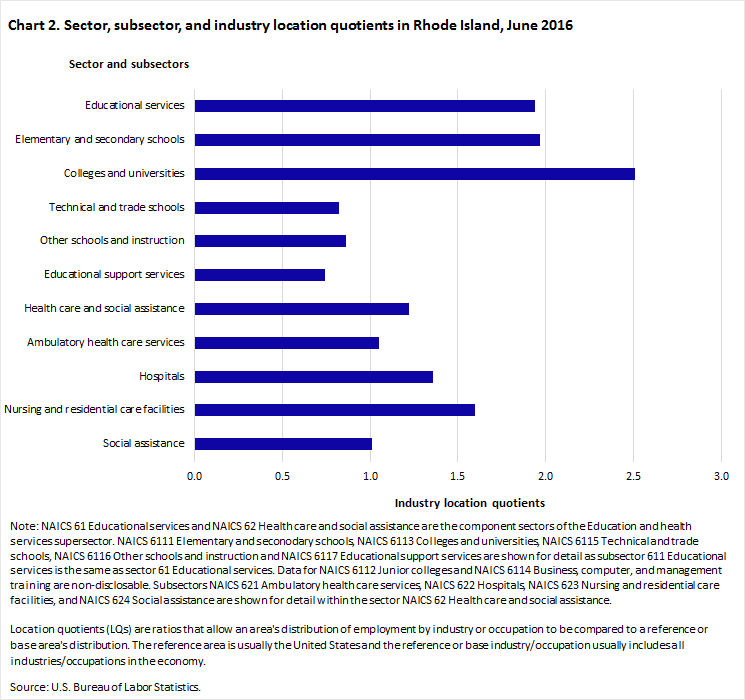
Similar to our use of location quotients for the supersectors in Rhode Island to highlight the prominence of the education and health services supersector, we can do the same for the sectors and subsectors. Both the educational services and health care and social assistance sectors had higher-than-average employment concentrations in the state with location quotients of 1.94 and 1.22, respectively. (See chart 2.) Colleges and universities, the industry with the largest job losses locally was also the most highly concentrated industry within the educational services sector in the state. In fact, employment in this industry was 2.51 times more concentrated locally than it was nationally. As a result, employment movements within this subsector had a higher impact on the area’s total employment, relative to national averages.
Within the healthcare and social assistance sector, all four subsectors had greater-than-average concentrations of employment within the state. Nursing and residential care, which demonstrated virtually no local job gains, compared with the 5.8 percent national average, had a location quotient of 1.60. Similar to colleges and universities, hospitals, had an above average employment concentration (1.36). This made up a significant amount of the employment within its larger sector, and it accounted for job losses over the 7-year period. Our analysis suggests that these three subsectors (colleges and universities, nursing and residential care, and Hospitals) combined to be significant drivers behind why the education and health services supersector hampered overall statewide job growth in the post-recessionary period.
Similar to the employment share analysis done previously when we applied the national rate of growth to various supersectors in Rhode Island to see what impact their slow, or negative, growth had on overall employment in the state, we can do the same for the two sectors of the education and health services supersector. Over 90 percent of employment within the educational services sector came from two subsectors; elementary and secondary schools and colleges and universities. Although elementary and secondary schools experienced net job losses across the public and private sectors both locally and nationally, the rate of job loss was higher in Rhode Island. As seen in table 6, the local rate of private sector job growth (17.3 percent) was close to the national rate (16.1 percent). However, the 11.1-percent rate of public sector job loss seen for Rhode Island was well above the–national 3.4-percent rate of job loss. If we replace Rhode Island’s rate of job loss with the national rate, the state would have lost approximately 1,800 fewer jobs. The more noteworthy changes are seen within colleges and universities: particularly in the private sector. Replacing the 0.4- percent rate of public sector job losses in colleges and universities with the 3.9-percent rate of job gain seen nationally would result in a net change of 151 jobs. However, substituting the 14.4- percent local rate of job loss seen in the private sector with the 9.0-percent rate of growth seen nationally would have resulted in a net change of over 2,700 jobs. The combined effect of these changes would have resulted in a 2.6 percent rate of job growth as opposed to the 7.4-percent rate of job loss that was seen. Specifically, the revised job growth within colleges and universities would have had the largest impact.
| Industry | Rhode Island | National growth rate | 2016 Rhode Island employment at national growth rate | ||
|---|---|---|---|---|---|
| 2009 Employment | 2016 Employment | Growth rate | |||
|
Private |
|||||
|
Educational services (NAICS 611) |
18,899 | 18,057 | -4.5 | 13.5 | … |
|
Elementary and secondary schools |
4,462 | 5,234 | 17.3 | 16.1 | 5,180 |
|
Colleges and universities |
11,752 | 10,054 | -14.4 | 9.0 | 12,810 |
|
Public |
|||||
|
Educational services (NAICS 611) |
27,947 | 25,324 | -9.4 | -2.0 | … |
|
Elementary and secondary schools |
23,673 | 21,051 | -11.1 | -3.4 | 22,868 |
|
Colleges and universities |
3,526 | 3,513 | -0.4 | 3.9 | 3,664 |
| Source: U.S. Bureau of Labor Statistics. | |||||
To analyze the impact of slow or negative growth on overall employment change for the healthcare and social assistance sector in Rhode Island, we replace local growth rates for the subsectors with those of the nation. Although employment in the ambulatory health care services; nursing and residential care facilities; and social assistance subsectors had net jobs gains across the public and private sectors in Rhode Island from 2009 to 2016 (10.5, 0.7, and 14.2 percent, respectively), these growth rates were below the national averages. As seen in table 7, the most significant divergence between local and national patterns was in private sector hospital employment. Rhode Island’s 4.9-percent rate of job loss during the analysis period results in an employment drop of nearly 1,200 jobs. However, if we apply the national rate of job growth (6.3 percent) to the state’s baseline 2009 employment level in this subsector, the state would have gained over 1,500 jobs. Although local public sector job growth was stronger than it was nationally, the comparatively smaller employment levels make the impacts less pronounced. The net impact of replacing local hospital employment levels changes across both the private and public sectors, with the rates seen nationally would be an increase in the sector’s employment growth rate by more than 3 percentage points.
| Industry | Rhode Island | National growth rate | 2016 Rhode Island employment at national growth rate | ||
|---|---|---|---|---|---|
| 2009 Employment | 2016 Employment | Growth rate | |||
|
Private |
|||||
|
Health care and social assistance (NAICS 62) |
77,177 | 80,186 | 3.9 | 18.3 | … |
|
Ambulatory health care services |
23,356 | 25,860 | 10.7 | 21.6 | 28,401 |
|
Hospitals |
24,493 | 23,302 | -4.9 | 6.3 | 26,036 |
|
Nursing and residential care facilities |
18,293 | 18,412 | 0.7 | 7.1 | 19,592 |
|
Social assistance (1) |
11,035 | 12,612 | 14.3 | 48.1 | 16,343 |
|
Public |
|||||
|
Health care and social assistance (NAICS 62) |
3,245 | 3,471 | 7.0 | 4.6 | … |
|
Ambulatory health care services |
171 | 127 | -25.7 | 37.8 | 236 |
|
Hospitals |
1,185 | 1,521 | 28.4 | 4.7 | 1,241 |
|
Nursing and residential care facilities |
(2) | (2) | (2) | (2) | (2) |
|
Social assistance (1) |
163 | 174 | 6.7 | 5.0 | 171 |
|
(1) Changes reflected in employment within this industry should be interpreted with caution due to non economic coding classification changes which had an impact on published employment figures over the period. (2) Data not available. Source: U.S. Bureau of Labor Statistics. |
|||||
The main takeaway from our analysis of Rhode Island’s industry employment data for 2009 and 2016 is the disparity between the growth rates in the education and health services supersector in the United States and Rhode Island. This particular supersector was a significant generator of job growth in the nation in the most recent period of economic recovery. Over the 7-year period beginning with the end of the Great Recession (June 2009–June 2016), the education and health services supersector added over 3 million jobs nationwide, growing at a rate of 10.5 percent. As the largest supersector based on employment, education and health services accounted for nearly 24 percent of job growth nationwide during this period. Comparatively, although education and health services is also the largest supersector in Rhode Island, it exhibited net job losses across the public and private sectors during this same period.
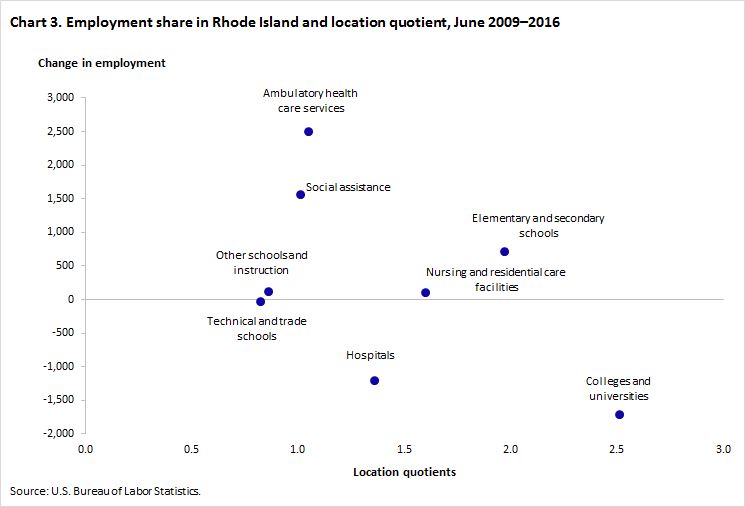
More specifically, local declines in employment at hospitals as well as colleges and universities are where we observed the largest divergence from national patterns. These were the largest and second-largest industries within their respective sectors locally based on 2009 employment levels. Both also had above average employment concentrations in Rhode Island. Highly concentrated industries which made up a large portion of their sector’s employment and which had job losses over the analysis period (See chart 3.) combined are the reasons that the education and health services supersector hampered overall statewide job growth in the postrecessionary period. These job losses contributed significantly to the below-average growth in this supersector, which in turn had a prominent role in Rhode Island’s weak top-side employment growth; 5.1 percent over the 7-year analysis period, compared with the 10.1-percent national average.
This Beyond the Numbers article was prepared by Mark Maggi, Supervisory Economist in the Boston Regional Office for Occupational Safety and Health Statistics, Email: Maggi.Mark@bls.gov, Telephone: (617) 565-9162.
Upon request, the information in this article will be made available to individuals who are sensory impaired. Voice phone: (202) 691-5200. Federal Relay Service: 1-800-877-8339. This article is in the public domain and may be reproduced without permission.
Mark Maggi, “Why did Rhode Island have slower employment growth than the nation during the recovery period, 2009–16?” Beyond the Numbers: Regional Economies, vol. 6, no. 11 (U.S. Bureau of Labor Statistics, September 2017), https://www.bls.gov/opub/btn/volume-6/why-did-rhode-island-have-slower-employment-growth-than-the-nation-during-the-recovery-period-2009-16.htm
1 Rhode Island’s slow rate of job growth during the recovery was also analyzed in “Rhode Island in the Great Recession: Factors Contributing to its Sharp Downturn and Slow Recovery,” No. 14-9, Current Policy Perspectives, https://www.bostonfed.org/publications/current-policy-perspectives/2014/rhode-island-in-the-great-recession-factors-contributing-to-its-sharp-downturn-and-slow-recovery.aspx.
2 The National Bureau of Economic Research (NBER) is generally recognized as the official arbiter of recessions in the United States. The NBER has determined June 2009 as the trough of the recession that began in December 2007—the business cycle peak. For additional information on NBER business cycles, see http://www.nber.org/cycles/cyclesmain.html.
3 See “Rhode Island in the Great Recession: Factors Contributing to its Sharp Downturn and Slow Recovery,” No. 14-9, Current Policy Perspectives, https://www.bostonfed.org/publications/current-policy-perspectives/2014/rhode-island-in-the-great-recession-factors-contributing-to-its-sharp-downturn-and-slow-recovery.aspx.
Publish Date: Thursday, September 21, 2017