An official website of the United States government
An official website of the United States government
The .gov means it's official.
Federal government websites often end in .gov or .mil. Before sharing sensitive information,
make sure you're on a federal government site.
The site is secure.
The
https:// ensures that you are connecting to the official website and that any
information you provide is encrypted and transmitted securely.
Technological change has always attracted attention because of its potential effects on employment. Recent advances in robotics and artificial intelligence (AI) have attracted even more interest than usual, and the breadth and speed of these advances have raised the possibility of widespread job displacement in the near future. Many observers consider these new technologies fundamentally different from previous waves of computing technology. New computing capacities—in areas such as image recognition, robotic manipulation, text processing, natural-language processing, and pattern recognition, and, more generally, the ability to learn and improve rapidly in relatively autonomous ways—represent a break from the hand-coded, rules-based programs of the past. In this view, newer robots and AI represent a clear departure from previous waves of computing, one that accelerates the pace of technological change and job displacement.
Recent writings on automation and employment often refer to certain occupations in passing as examples of jobs that are currently affected by advanced robots and AI or are likely to be affected in the near future. These occupations may be intended as representative examples of general processes or the leading edge of trends that will eventually affect other occupations. Because the occupations are not examined in depth, a natural question is whether the expectations expressed in the automation literature are consistent with U.S. Bureau of Labor Statistics (BLS) projections and recent employment trends for these occupations. There are also potential problems with representativeness in using individual occupations as exemplars. Because part of the workforce is being used as a stand-in for the whole, it is natural to ask whether these particular occupations are actually shrinking rapidly, as well as whether the general practice of citing individual examples has some inherent limitations that are worth bearing in mind.
This article assembles the individual occupations that widely cited recent works on automation consider highly vulnerable to substitution by robots and AI and examines their projected growth from 2019 to 2029. For context, the growth of these occupations over 2008–18 is compared with both the 2019–29 projections and the 2008–18 projections published a decade earlier. Finally, actual and projected growth in these occupations is compared with their growth over 1999–2009. In addition to providing trend data for the past 20 years and projections for the following 10 years, these data permit some consideration of the accuracy of the 2029 projections against the performance of the 2008–18 projections. This article does not examine overall trends by major occupational group, which is covered in a companion paper.1 Rather, it examines how well recent discussions of automation describe developments in the specific occupations that have been selected to illustrate general trends. The article also examines limitations surrounding any use of occupational examples to understand general employment trends.
Since the emergence of information and communications technology (ICT) in the late 1940s, the development of this technology has been uniquely dynamic. Both the power and breadth of applications of ICTs have grown rapidly. Milestones include mainframe computing, early manufacturing automation, minicomputers, microcomputers, the internet, and mobile computing, among others. From their inception, ICTs were understood as a watershed in the development of technology, with great potential for both abundance and displacement. Repeating periodic concerns raised earlier regarding mechanical technology, some observers in the 1950s and 1960s argued computers and industrial automation could lead to massive job losses.2 Responding to these concerns, congressional hearings, a series of studies by the U.S. Bureau of Labor Statistics, and a multivolume report by a special presidential commission investigated the employment implications of computers and automation.3 However, when economic growth picked up in the late 1960s and unemployment fell to 3.5 percent, the issue faded into the background.
Concern regarding the impact of computers on jobs reemerged in the late 1980s. Economists became aware of a trend toward greater earnings inequality, which included increasing wage differentials between education groups. The dominant explanation was that new technology increasingly favored more educated workers. This concept of skill-biased technological change (SBTC) pointed to the spread of microcomputers as reducing the demand for less-skilled workers.4 When wage gaps between the middle and lower percentiles of the wage distribution stopped widening in the late 1990s, attention turned toward the possibility that declining labor demand affected middle-skilled jobs more than low-skilled jobs because their tasks were more codifiable and programmable. It was argued this made middle-skilled jobs more susceptible to automation than low-skill service jobs because service jobs require sensory perception, common sense, and other tacit skills that are difficult to replicate with algorithmic, if–then programming logic.5
A new wave of computing has led to further revision regarding the effects of automation. Beginning in 2005 with the successful demonstration of self-driving vehicles, views of the capabilities of ICTs have expanded. A series of often unexpected and dramatic breakthroughs in AI and robotics have expanded the kinds of tasks that information technology can perform. Now robots clean floors, deliver packages, perform warehouse work, check inventory on supermarket shelves, patrol malls, and assist surgery. Other robots lay bricks and sew garments. After 2010, corporate research and development on self-driving vehicles and other AI rose significantly. Breakthroughs in complex game-playing raised the possibility of more general automated intelligence that might replace numerous cognitively complex jobs.6 By 2015, image recognition, speech recognition, natural-language processing and speech synthesis, machine translation, automated captioning and subtitling, automated text generation, and business analytics made remarkable advances powered by improved hardware, big data, and advances in neural networks and other machine learning techniques. Even experts in the field of AI were often surprised by the rapid rate of improvement and the milestones reached in such a compressed timeframe.7
This sudden burst of progress led some researchers and commentators to change their views regarding the kinds of jobs that might be subject to widespread automation in the near future. Complex perceptual and cognitive tasks, like driving vehicles, composing news articles, extracting information from legal documents, and reading radiological images, as well as all kinds of manual and service tasks previously performed by humans, came to be seen as vulnerable to large-scale substitution by machines. Widely cited writings on automation have argued strongly that the new wave of computing technology is fundamentally different from previous waves in terms of its capabilities and speed, and that it may produce massive job displacement in the near future.8 One widely cited and emulated study claimed 47 percent of U.S. jobs were at risk of automation between 2010 and 2030.9 This and similar highly publicized claims generated their own congressional hearings and government reports.10
One common feature of recent writing on automation is the use of particular occupations as illustrations of the rapid encroachment of robots and AI on jobs previously restricted to human workers. BLS projects 10-year occupational employment trends on a regular basis, so it is natural to ask whether the BLS projections also consider these particular occupations highly vulnerable to automation and whether recent employment trends also suggest reasons for concern. Given the overall size of the U.S. workforce, there are also questions regarding the total number of jobs that are in these potentially vulnerable occupations. If the projections and recent trends suggest these occupations are vulnerable and the occupations are large, either individually or collectively, then recent automation concerns receive support. By contrast, if their growth follows relatively consistent or moderate trends over time or the number of jobs involved is not outsized relative to the overall labor force, then the experience of these occupations would not support current levels of concern regarding automation.
Several considerations are worth noting in investigating this question because they potentially qualify the view that AI and robots will have outsize employment impacts, some of which apply to technological change more generally.
The current literature on automation considers recent robots and AI much more powerful and consequential for employment than previous ICTs, representing a break with previous computing technology. Therefore, the employment effects of the current wave of computing should be distinguished from the effects of previous waves of computing, such as older automation technologies, conventional office software, the internet, and mobile technology. It is the new functions of leading technologies, their wider applicability, and faster development that has generated especial concern for the future of work. If the new technology simply represents a “handoff” of productivity leadership from maturing ICTs to a new generation of ICTs, without a break or discontinuity in employment trends, then one would not expect to see the current, heightened levels of concern. Therefore, the specific employment effects of newer robots and AI need to be distinguished from the effects of well-established computing technologies, such as digitization, ICT-enabled self-service, ICT-enabled offshoring, e-commerce, and office automation, whose employment effects began earlier and have not necessarily been exhausted. None of these older technologies uses or is dependent on machine learning or advanced robotics. This article focuses on the potential effects of robotics and AI, which have generated the greatest attention and concern recently, but, as will be seen, it is not always easy to maintain the distinction between newer and older computing technologies in practice when examining occupational growth trends.
In addition, the automation literature tends to focus on job destruction due to technological substitution without much consideration of the possibility that innovations could increase demand for a good or service and thus require more workers to meet that demand (a scale effect). The most common scale effect mentioned in discussions of automation generally refers to firm or industry growth resulting from automation-related price decreases and accompanying growth in product demand. It is possible, for example, that partial automation of warehouses may lower retail prices and expand the use of e-commerce so that the total number of warehouse workers might grow even as staffing patterns within each warehouse become leaner. However, if e-commerce demand eventually stops growing and automation continues to progress, employment levels will no longer be buoyed by growth in the size of the product market.
Perhaps more importantly, embedded in the BLS projection models is the understanding that a growing population generally increases total demand for goods and services, which usually increases the total demand for labor, even when productivity is rising.11 Likewise, a growing labor force provides the means for satisfying growing demand for final goods and services and is typically associated with job growth. The automation literature tends to focus on the jobs that technology eliminates or may eliminate, usually omitting effects of population growth and growth in the total size of the economy, which are reflected in both employment growth and BLS projections.
Firms have often responded to the introduction of new labor-saving technology by redefining the tasks involved in existing jobs. Economists often point to the “lump of labor” fallacy in discussing previous waves of technological innovation.12 According to this view, there is no fixed amount of work to be done in an economy, as an economy not only grows over time but becomes more diversified. Even though machines may reduce the number of jobs in some occupations, historically the workforce has shifted to other, often new occupations. This principle can be extended to the tasks within occupations, as well. Automation of some tasks, such as document review within legal occupations, may result in more time spent on other, perhaps new, tasks without necessarily a reduction in the number of jobs. Although this is certainly not inevitable, observers need to be aware that there is a potential lump of labor fallacy within occupations that may inhibit occupational decline, as well as the more familiar application of the concept across occupations. When technology substitutes for some tasks within an occupation, it is possible that workers will be shifted to other, sometimes new, tasks, rather than simply losing their jobs. The extent to which technology augments organizational capacities rather than simply saving labor is an empirical question that tends to be overlooked in discussions of automation, perhaps because it represents continuity rather than a break with existing practices. To the extent jobs are lost, firms may rely on attrition rather than layoffs, which will moderate the pace of occupational decline.
Another issue is that occupational titles in the Standard Occupational Classification (SOC) system may cover a wider range of jobs than may be immediately apparent, and not all of these jobs may be equally susceptible to automation. For example, some estimates of jobs at risk from automation mention the three million jobs in the broad occupation driver/sales workers and truck drivers (SOC 53-3030) as vulnerable to displacement by self-driving trucks, rather than the 1.7 million jobs in the detailed occupation heavy and tractor-trailer truck drivers (SOC 53-3032), some of which, like cement truck drivers, also do not drive long-haul highway routes considered most suitable for autonomous vehicles.13 Likewise, software may replace accountants who mainly prepare tax filings, but accounting jobs are varied, and those focused on other tasks may remain completely unaffected. Even when jobs within an occupation correspond more closely to assumptions, those jobs may contain more tasks that are difficult to automate than is commonly recognized, which may slow the replacement of human workers by machines.14 Underestimating the variety of jobs covered by an occupational title and their varying susceptibility to automation is distinct from situations in which the task content of jobs changes in response to the introduction of technology. However, in both cases there is a risk of overestimating the importance of a particular technology for a given occupation because of underestimating the variety of their task content, either in the cross-section or over time.
Omitting considerations like scale effects, job redefinition, and job variety, or mentioning them only in passing, assumes by default that the effects of technological substitution are stronger than the effects of economic growth and other offsetting variables that operate to maintain or increase jobs in affected occupations.15 As will be seen, this is not necessarily a safe assumption. Nevertheless, it should be noted that nothing in this article should be interpreted as minimizing the number of jobs lost, the hardships experienced by workers affected by job loss, or the implications of the changing occupational composition for inequality and economic opportunity more generally.
This article uses data from two BLS sources. Projections data are from the Employment Projections program and historical employment data are from the Occupational Employment and Wage Statistics (OEWS) program.
BLS conducts research on job trends on an ongoing basis as part of its Employment Projections program. This research is used to make 10-year projections of occupational growth to help members of the public, such as jobseekers, counselors, and education planners, understand labor market trends. As part of the projections process, staff economists conduct detailed research on recent and emerging technologies used in the workplace, as well as prior trends in employment by occupation. This article uses projections files for 2008–18 and 2019–29. These projections cover a 20-year period frequently used as a projection interval in the recent automation literature.16 The 2019–29 projections permit direct comparison between BLS research and recent work on automation, while avoiding distortions that would arise in the 2020–30 projections because of the effect of the coronavirus disease 2019 (COVID-19) pandemic on employment in 2020.17 The 2019–29 projections file also includes brief explanations of the technological and other drivers of occupational trends that emerged from BLS research, which are cited at points below.18
The 2008–18 projections file contains actual occupational employment for 2008 and both projected and actual occupational employment for 2018. These data provide employment trends for the first decade of the current wave of ICTs and a benchmark for evaluating how well the projections methodology anticipated trends in occupational employment. Although there is no way to evaluate the projections for 2029, the performance of the 2008–18 projections provide a useful point of comparison when considering the likely performance of the 2019–29 projections.
Using the performance of the 2008–18 projections to provide perspective on the likely performance of the projections to 2029 is complicated by several factors. Projections aim to provide a general guide to the course of future occupational employment but recognize there will likely be some divergence between projected and actual figures in the target year, given previous experience and the intrinsic uncertainties involved. Therefore, modest differences between projected and actual values for 2018 should not be given great weight. However, the implications of any large divergences for projections to 2029 may be ambiguous because the later projection may take the earlier discrepancies into account and try to address the problems that caused them. Nevertheless, Carl Benedikt Frey and Michael Osborne argue the BLS projections lag technological developments, so it is important to note cases in which the projections underestimated change during the first decade of the AI era and continue to project gradual change in the next decade.19
Because some occupations identified as vulnerable to substitution by robotics and AI may have been affected by previous waves of computing technology, and may continue to experience these effects, this article also examines growth trends for the 1999–2009 period by using the Occupational Employment and Wage Statistics (OEWS) database. The OEWS database covers a somewhat narrower range of industries than the projections data. This difference will produce some discrepancies in the absolute levels of employment between the OEWS and projections files. However, the growth rates for 1999 to 2009 should be a useful benchmark for judging whether subsequent changes in occupational employment represent a qualitative break with prior rates of change, as suggested by recent work on automation. A discussion of occupational growth rates (in the next section) also uses the OEWS database for 1999 to 2018 to show typical rates of occupational growth and decline to provide context. Readers should bear in mind that two different data series, Employment Projections and OEWS database, are used to derive the main results for occupations considered highly susceptible to automation because the data series cover different years, which produces some noncomparabilities noted below.20
Both the projections and the OEWS database use the Standard Occupational Classification (SOC) system, which is a hierarchical system for coding occupations. For example, the 2000 SOC has 821 detailed occupations, which are nested within approximately 450 broad occupations, 96 minor occupation groups, and 23 major occupation groups. The writings consulted for this article generally use the equivalent of detailed occupations when discussing jobs at risk of automation, but those writings sometimes use the equivalent of broad or even minor occupations, which is reflected in the tables that follow. The relationship between automation and major occupation groups is covered in a companion paper.21 The SOC system was revised significantly beginning in 2010 and, again, beginning with data collected in 2019, which can introduce some comparability issues across periods.
Because discussion of automation often uses particular occupations to illustrate general employment trends, it is useful to have some perspective on the varying sizes of occupations. BLS projections data report 163 million jobs in the United States in 2019, which are classified into 790 detailed occupations. Therefore, the average occupation had 206,072 jobs and accounted for about one-tenth of 1 percent (0.13 percent) of all jobs. However, the highly skewed nature of the distribution means that the share of the largest occupation accounted for more than 20 times the average (2.7 percent). Occupational size declines fairly rapidly thereafter, such that the share of the smallest occupation in the top decile of the occupational employment distribution accounted for about twice the average (0.29 percent). The median occupation had only about 54,000 jobs, accounting for just 0.03 percent of all jobs, and the nearly 400 occupations below the median each accounted for 0.01 percent of all jobs on average. Clearly, occupational size is an important consideration when focusing on particular cases given that most occupations are small in absolute terms and even large occupations account for relatively small shares of all jobs. (For further information on the occupational size distribution, see the appendix). Even very large percent declines imply limited overall job losses in the case of most occupations, and very large percent declines in occupational employment are themselves not very common.
Between 1999 and 2018, the total number of jobs grew 17 percent for the 669 occupations in the OEWS database that can be followed consistently. This represents average 10-year and 20-year growth rates of 8.6 percent and 18.0 percent, respectively. Given the general increase in jobs, which partly reflects growth in the population and labor force, one would expect most occupation-specific growth rates to be positive. However, while many occupations experienced below-average growth, others experienced absolute declines. An occupation must decline by 25 percent per decade to shrink by 44 percent over two decades, equivalent to 0.56 of its base-year level. This is comparable to the rate of change implied by Frey and Osborne’s widely cited forecast of a 47-percent decline in the total number of jobs over 20 years.22
Such steep declines are unusual. Table 1 shows the actual distribution of growth rates in the OEWS database for 1999–2018. The top data row shows that only about 15 percent of occupations (column 1), accounting for 9 percent of jobs in 1999 (column 2), declined by 25 percent or more per decade over the full period. Clearly, current views of automation imply a sharp break with the recent past in terms of the scale of occupational employment decline. Table 1 also shows that about half of all jobs in 1999 were in occupations that grew or shrank by up to 10 percent per decade over the next 19 years (row 2), two-thirds were in occupations that changed within 20 percent per decade (row 3), and 83 percent of jobs were in occupations that changed within 30 percent per decade (row 4).
A more detailed breakdown in panel B of table 1 shows that, as one moves away from the central, slowest growth category (0- to 10-percent growth) and toward categories representing larger shifts, the shares of occupations and jobs involved grow smaller. This is especially the case for declining occupations. Only 21 occupations, representing 1 percent of jobs in 1999, declined by 50 percent or more per decade from 1999 to 2018. By contrast, 55 occupations, representing 2.7 percent of jobs in 1999, grew by 50 percent or more per decade over the same period.
| 10-year growth | Percent of all occupations | Percent of all jobs | Number of occupations | Percent of jobs, small occupations (N = 338) | Percent of jobs, large occupations (N = 104) |
|---|---|---|---|---|---|
A. Select growth rates | |||||
Declined by 25 percent or more | 15.1 | 9.0 | 101 | 13.1 | 4.9 |
Changed ± 10 percent | 30.9 | 51.2 | 207 | 23.8 | 59.9 |
Changed ± 20 percent | 51.7 | 67.8 | 345 | 44.7 | 74.5 |
Changed ± 30 percent | 69.3 | 83.0 | 463 | 64.8 | 87.5 |
B. All growth rates | |||||
G ≤ 0.5 | 3.1 | 1.0 | 21 | 4.00 | 0.3 |
0.5 < G ≤ 0.7 | 8.7 | 6.3 | 58 | 11.30 | 5.5 |
0.7 < G ≤ 0.8 | 7.3 | 4.7 | 49 | 9.70 | 3.3 |
0.8 < G ≤ 0.9 | 9.3 | 5.3 | 62 | 9.80 | 2.7 |
0.9 < G < 1.0 | 13.8 | 16.0 | 92 | 11.60 | 16.9 |
1.0 ≤ G ≤ 1.1 | 17.2 | 35.2 | 115 | 12.20 | 43 |
1.1 < G ≤ 1.2 | 11.4 | 11.3 | 76 | 11.10 | 11.9 |
1.2 < G ≤ 1.3 | 10.3 | 10.5 | 69 | 10.40 | 9.7 |
1.3 < G < 1.5 | 10.8 | 7.1 | 72 | 11.30 | 5.2 |
1.5 ≤ G | 8.2 | 2.7 | 55 | 8.70 | 1.4 |
Total[1] | 100.1 | 100.1 | 669 | 100.1 | 99.9 |
Note: [1] Totals do not sum to 100 because of rounding. G = growth rate, and N = number of observations. Small occupations are defined as those with fewer than 50,000 jobs, and large occupations are defined as those with greater than 250,000 jobs. Source: U.S. Bureau of Labor Statistics, Occupational Employment Statistics 1999–2018. | |||||
It would not be surprising to find that rates of change were larger for smaller occupations, because absolute changes imply larger percent changes. This is confirmed by comparing the employment-weighted distribution of occupational growth rates for occupations with less than 50,000 jobs in 1999 (see table 1, column 4) with the distribution for occupations with more than 250,000 jobs in 1999 (column 5), which together account for two-thirds of all occupations included in the table (442 of 669). The differences are even more apparent when the two distributions are compared graphically (see chart 1). In sum, very large declines in occupational employment were relatively uncommon between 1999 and 2018, and they tended to be concentrated among smaller occupations, limiting their effect on overall employment. The pattern of occupational decline implied by automation futurists would represent a dramatic departure from recent trends.
Tables 2 and 3 show recent and projected trends for 27 occupations that have been used as illustrations in widely cited works on the effects of robotics and AI on employment.23 Most of the discussion will focus on the percent growth figures in the percent change columns of table 3, but the absolute number of jobs in table 2 and the changes in absolute levels in the absolute change columns of table 3 are relevant to the question of magnitudes and provided for reference. In both tables, occupations in the top panel are closer to “pure” cases in which technological drivers of employment are more likely to be exclusively robotics and AI. Occupations cited in the automation literature that appear in the bottom panel are more mixed and are likely to have been affected significantly by previous waves of computing technologies, in addition to any effects of more advanced information and communications technologies (ICTs). Nevertheless, the distinction is not clear, if only because the magnitudes of the various technological effects on different occupations are not well understood. All figures for 1999 to 2009 are derived from the OEWS database, while figures for 2008 to 2018 and 2019 to 2029 are derived from the Employment Projections database, which adds the self-employed and certain other groups to the OEWS totals.
| SOC code | Title | OEWS | BLS projections database | |||||
|---|---|---|---|---|---|---|---|---|
| 1999 | 2009 | 2008 | 2018p | 2018 | 2019 | 2029p | ||
00-0000 | All occupations | 118,201 | 130,580 | 150,930 | 166,204 | 160,959 | 162,797 | 168,835 |
A. Potential AI-affected occupations | ||||||||
13-2052 | Personal financial advisors | 80.0 | 149.5 | 208.4 | 271.2 | 271.7 | 263.0 | 274.6 |
27-3091 | Interpreters and translators | 13.6 | 40.0 | 50.9 | 62.2 | 76.1 | 77.4 | 92.9 |
29-1067 | Surgeons, except ophthalmologists | 48.5 | 44.6 | 54.5 | 63.8 | 38.2 | 39.6 | 38.8 |
35-3021 | Fast food and counter workers | 2,358.9 | 3,186.7 | 3,227.1 | 3,670.4 | 4,184.4 | 4,047.7 | 4,508.6 |
37-2011 | Janitors and cleaners | 2,090.6 | 2,090.4 | 2,375.3 | 2,479.4 | 2,404.4 | 2,374.2 | 2,479.8 |
37-2012 | Maids and housekeeping cleaners | 913.5 | 887.9 | 1,498.2 | 1,583.7 | 1,494.4 | 1,474.9 | 1,470.7 |
37-3011 | Landscaping and groundskeeping workers | 739.5 | 860.0 | 1,205.8 | 1,422.9 | 1,205.2 | 1,188.0 | 1,307.9 |
53-3032 | Heavy and tractor-trailer truck drivers | 1,558.4 | 1,550.9 | 1,798.4 | 2,031.3 | 1,958.8 | 2,029.9 | 2,060.5 |
53-7051 | Industrial truck and tractor operators | 590.7 | 568.3 | 610.3 | 627.0 | 615.0 | 634.7 | 652.3 |
53-7062 | Laborers and freight, stock, material moving | 2,035.6 | 2,135.8 | 2,317.3 | 2,298.6 | 2,953.8 | 2,986.0 | 3,111.7 |
| Subtotal | 10,429.3 | 11,514.1 | 13,346.2 | 14,510.5 | 15,202.0 | 15,115.4 | 15,997.8 | |
| Percent of all jobs | 8.8 | 8.8 | 8.8 | 8.7 | 9.4 | 9.3 | 9.5 | |
B. Occupations with pre-AI potential effects | ||||||||
13-2072 | Loan officers | 200.2 | 298.2 | 327.8 | 360.9 | 316.2 | 316.9 | 327.0 |
13-2082 | Tax preparers | 58.1 | 61.1 | 95.8 | 98.6 | 86.6 | 88.4 | 87.9 |
15-1131 | Computer programmers | 528.6 | 367.9 | 426.7 | 414.4 | 250.3 | 213.9 | 193.8 |
23-1011 | Lawyers | 464.3 | 556.8 | 759.2 | 857.7 | 823.9 | 813.9 | 846.3 |
23-2011 | Paralegals and legal assistants | 175.9 | 246.8 | 301.5 | 380.8 | 342.9 | 337.8 | 373.1 |
27-3022 | News analysts, reporters, journalists | 64.6 | 52.0 | 69.3 | 64.9 | 49.7 | 52.0 | 46.2 |
27-3031 | Public relations specialists | 118.3 | 242.7 | [1] | [1] | [1] | 274.6 | 294.3 |
41-1011 | First-line supervisors of retail sales workers | 1,237.1 | 1,163.0 | 1,685.5 | 1,773.9 | 1,548.3 | 1,476.4 | 1,395.3 |
41-2011 | Cashiers | 3,162.1 | 3,439.4 | 3,550.0 | 3,675.5 | 3,648.5 | 3,600.9 | 3,335.5 |
41-2021 | Counter and rental clerks | 392.6 | 417.0 | 448.2 | 461.9 | 436.1 | 420.4 | 424.9 |
41-2031 | Retail salespersons | 3,729.0 | 4,209.5 | 4,489.2 | 4,863.9 | 4,510.9 | 4,371.4 | 4,346.3 |
43-4051 | Customer service representatives | 1,789.6 | 2,195.9 | 2,252.4 | 2,651.9 | 2,972.6 | 3,018.8 | 2,959.8 |
41-9041 | Telemarketers | 485.7 | 307.7 | 341.6 | 303.8 | 167.7 | 136.9 | 117.5 |
43-5081 | Stockers and order fillers | 1,800.8 | 1,864.4 | 1,858.8 | 1,993.3 | 2,056.6 | 2,135.8 | 2,151.3 |
43-4181 | Reservation/transportation ticket agents | 222.3 | 142.5 | 168.3 | 181.9 | 133.7 | 126.3 | 122.7 |
45-2091, 45-2092, 45-2093 | Farmworkers and agricultural equipment operators | 267.2 | 291.1 | 782.6 | 763.9 | 855.0 | 882.2 | 891.3 |
51-4120[2] | Welders | 478.7 | 399.3 | 466.4 | 455.9 | 462.4 | 476.1 | 487.2 |
| Subtotal | 15,123.0 | 16,197.9 | 17,852.1 | 19,128.5 | 18,338.7 | 18,427.0 | 18,097.0 | |
| Percent of all jobs | 12.8 | 12.4 | 11.8 | 11.5 | 11.4 | 11.3 | 10.7 | |
C. All potentially affected occupations | ||||||||
| Total, all specific occupations | 25,552.3 | 27,712.0 | 31,198.3 | 33,639.0 | 33,540.7 | 33,542.4 | 34,094.8 | |
| Percent of all jobs | 21.6 | 21.2 | 20.7 | 20.2 | 20.8 | 20.6 | 20.2 | |
Note: [1] Not applicable. [2] Broad occupation. SOC = Standard Occupational Classification system, OEWS = Occupational Employment and Wage Statistics, BLS = Bureau of Labor Statistics, and p = projected value. All occupation codes are from SOC 2010, but the SOC 2000 codes used for the 1999–2009 OEWS and the 2008–18 BLS projections and the SOC 2018 codes used for 2019–29 may differ. Public relations specialists (SOC 27-3031) cannot be identified uniquely in the projections database prior to 2019. Source: U.S. Bureau of Labor Statistics, OEWS database 1999–2009 and BLS occupational projections files for 2008–18 and 2019–29. | ||||||||
| SOC code | Title | Absolute change (in thousands) | Percent change | ||||||
|---|---|---|---|---|---|---|---|---|---|
| 1999–2009 | 2008–18p | 2008–18 | 2019–29p | 1999–2009 | 2008–18p | 2008–18 | 2019–29p | ||
00-0000 | All occupations | 12,378 | 15,274 | 10,028 | 6,038 | 10.5 | 10.1 | 6.6 | 3.7 |
A. Potential AI-affected occupations | |||||||||
13-2052 | Personal financial advisors | 69.5 | 62.8 | 63.3 | 11.6 | 86.9 | 30.1 | 30.4 | 4.4 |
27-3091 | Interpreters and translators | 26.4 | 11.3 | 25.2 | 15.5 | 193.3 | 22.2 | 49.4 | 20.0 |
29-1067 | Surgeons, except ophthalmologists | -3.9 | 9.3 | -16.3 | -0.8 | -8.0 | 17.0 | -30.0 | -2.0 |
35-3021 | Fast food and counter workers | 827.8 | 443.3 | 957.3 | 460.9 | 35.1 | 13.7 | 29.7 | 11.4 |
37-2011 | Janitors and cleaners | -0.2 | 104.1 | 29.1 | 105.6 | 0.0 | 4.4 | 1.2 | 4.4 |
37-2012 | Maids and housekeeping cleaners | -25.6 | 85.5 | -3.8 | -4.2 | -2.8 | 5.7 | -0.3 | -0.3 |
37-3011 | Landscaping and groundskeeping workers | 120.5 | 217.1 | -0.6 | 119.9 | 16.3 | 18.0 | 0.0 | 10.1 |
53-3032 | Heavy and tractor-trailer truck drivers | -7.5 | 232.9 | 160.4 | 30.6 | -0.5 | 12.9 | 8.9 | 1.5 |
53-7051 | Industrial truck and tractor operators | -22.4 | 16.7 | 4.6 | 17.6 | -3.8 | 2.7 | 0.8 | 2.8 |
53-7062 | Laborers and freight/stock/material moving | 100.2 | -18.7 | 636.5 | 125.7 | 4.9 | -0.8 | 27.5 | 4.2 |
| Subtotal or percent change | 1,084.8 | 1,164.3 | 1,855.7 | 882.4 | 10.4 | 8.7 | 13.9 | 5.8 | |
B. Occupations with pre-AI potential effects | |||||||||
13-2072 | Loan officers | 98.0 | 33.0 | -11.6 | 10.1 | 49.0 | 10.1 | -3.5 | 3.2 |
13-2082 | Tax preparers | 3.0 | 2.8 | -9.3 | -0.5 | 5.2 | 2.9 | -9.7 | -0.6 |
15-1131 | Computer programmers | -160.7 | -12.3 | -176.4 | -20.1 | -30.4 | -2.9 | -41.3 | -9.4 |
23-1011 | Lawyers | 92.5 | 98.5 | 64.7 | 32.4 | 19.9 | 13.0 | 8.5 | 4.0 |
23-2011 | Paralegals and legal assistants | 70.9 | 79.3 | 41.4 | 35.3 | 40.3 | 26.3 | 13.7 | 10.4 |
27-3022 | News analysts, reporters, journalists | -12.6 | -4.4 | -19.6 | -5.8 | -19.6 | -6.3 | -28.3 | -11.2 |
27-3031 | Public relations specialists | 124.4 | [1] | [1] | 19.7 | 105.2 | [1] | [1] | 7.2 |
41-1011 | First-line supervisors, retail sales | -74.0 | 88.4 | -137.2 | -81.1 | -6.0 | 5.2 | -8.1 | -5.5 |
41-2011 | Cashiers | 277.3 | 125.5 | 98.5 | -265.4 | 8.8 | 3.5 | 2.8 | -7.4 |
41-2021 | Counter and rental clerks | 24.4 | 13.7 | -12.1 | 4.5 | 6.2 | 3.1 | -2.7 | 1.1 |
41-2031 | Retail salespersons | 480.5 | 374.7 | 21.7 | -25.1 | 12.9 | 8.3 | 0.5 | -0.6 |
43-4051 | Customer service representatives | 406.2 | 399.5 | 720.2 | -59.0 | 22.7 | 17.7 | 32.0 | -2.0 |
41-9041 | Telemarketers | -177.9 | -37.8 | -174.0 | -19.4 | -36.6 | -11.1 | -50.9 | -14.2 |
43-5081 | Stockers and order fillers | 63.6 | 134.4 | 197.8 | 15.5 | 3.5 | 7.2 | 10.6 | 0.7 |
43-4181 | Reservation/transportation ticket agents | -79.8 | 13.6 | -34.5 | -3.6 | -35.9 | 8.1 | -20.5 | -2.9 |
45-2091, 45-2092, 45-2093 | Farmworkers and agricultural equipment operators | 23.9 | -18.7 | 72.4 | 9.1 | 8.9 | -2.4 | 9.3 | 1.0 |
51-4120[2] | Welders | -79.4 | -10.5 | -4.1 | 11.1 | -16.6 | -2.3 | -0.9 | 2.3 |
| Subtotal or percent change | 1,075.0 | 1,276.2 | 486.4 | -330.0 | 7.1 | 7.1 | 2.7 | -1.8 | |
| All specific occupations | 2,159.8 | 2,440.5 | 2,342.1 | 552.4 | 8.5 | 7.8 | 7.5 | 1.6 | |
Note: [1] Not applicable. [2] Broad occupation. SOC = Standard Occupational Classification system, OEWS = Occupational Employment and Wage Statistics, BLS = Bureau of Labor Statistics, and p = projected value. All occupation codes are from SOC 2010, but the SOC 2000 codes used for the 1999–2009 OEWS and the 2008–18 BLS projections and the SOC 2018 codes used for 2019–29 may differ. Public relations specialists (SOC 27-3031) cannot be identified uniquely in the projections database prior to 2019. Source: U.S. Bureau of Labor Statistics, OEWS database 1999–2009 and BLS occupational projections files for 2008–18 and 2019–29. | |||||||||
At the most basic level, concerns regarding automation are supported if occupations in panel A of table 3 are projected to decline sharply in the 2019–29 period and, secondarily, if they also shrank in the 2008–18 period with the birth of the modern AI industry. Nevertheless, with continued population and labor force growth, one might also focus on occupations whose growth was far below average for a given period.
The AI literatures leads one to expect faster rates of employment decline for the 2019–29 period compared with previous periods. In table2, one would also expect rates of decline in panel A to be faster after 2008 than rates of decline for occupations in panel B for 1999 to 2009, when those occupations were affected only by prior waves of computing technology. Finally, if occupations in panel B are affected by both prior and new waves of computing technology after 2008, their rates of decline would be expected to be the most rapid of any group or period in table 3. Unfortunately, these kinds of comparisons across panels are complicated by the fact that job growth has been decelerating because of the decline in the growth of the working-age population over time, which exerts an independent drag on the growth of jobs overall.24 For example, the total number of jobs grew 10.5 percent from 1999 to 2009 and then slowed to 6.5 percent from 2008 to 2018 according to the OEWS database, while the projections anticipate further deceleration to 3.7-percent growth from 2019 to 2029. Under these circumstances, one would expect slower job creation in more recent years regardless of technological advances.
Panel A of table 2 shows occupations used in the literature as examples of occupations susceptible to job loss from AI and robots and classified here as unaffected by earlier ICTs. The number of jobs in this group rose from 13.3 million (2008) to 15.1 million (2019) and is projected to grow further, to nearly 16.0 million (2029). This group’s share of all jobs rose from 8.8 to 9.3 percent (2008–19) and is projected to rise more slowly to 9.5 percent by 2029. In other words, these occupations grew in both absolute and relative terms since 2008 and are expected to continue to do so. According to the OEWS database, these occupations also grew in absolute size from 1999 to 2009, but their relative share remained flat at 8.8 percent of jobs during this period. Table 3 shows this group grew somewhat faster than projected from 2008 to 2018 (13.9 percent real growth versus 8.7 percent expected growth) and is projected to continue to grow faster than average for 2019 to 2029. Therefore, neither recent data nor BLS projections suggest automation is a serious issue for this group overall, though individual occupations may face greater risks.
Occupations in panel B of table 2, potentially affected by both current and previous waves of computing, account for somewhat more jobs. Jobs in this group grew from 17.9 million (2008) to 18.4 million (2019) but are projected to fall to 18.1 million by 2029. This group’s share of all jobs fell from 11.8 percent (2008) to 11.3 percent (2019) and is projected to fall by a similar amount to 10.7 percent by 2029. It is worth noting that the 2008–18 projections anticipated these occupations would account for 11.5 percent of jobs in 2018, and their actual share was very close, 11.4 percent in 2018. These occupations grew more slowly than average over both the 1999–2009 and 2008–18 periods. (See table 3.) The projections anticipate their growth will turn negative for 2019 to 2029, declining by 1.8 percent. For this group, negative forces are expected to dominate offsetting forces like general growth in the population, labor force, and economy. However, the magnitude of the decline is expected to be much less than anticipated in the automation literature, even though growth in these occupations may be affected by both preexisting and newer varieties of computing technologies.
Panel C of table 2 shows jobs in the two groups of occupations, taken together, grew from 31.2 million (2008) to 33.5 million (2019) and are projected to grow to 34.1 million (2029). Their share of all jobs remained essentially flat at 20.7 percent for 2008 and 2019, and the share is projected to decline by 0.4 percentage points by 2029. The similarity between their projected and actual share of jobs in 2018 (20.2 percent versus 20.8 percent) increases one’s confidence in the general magnitudes of the projections for 2029 at the aggregate level. The bottom row of table 3 shows the combined group grew 7.5 percent over 2008–18, nearly identical to the projected rate (7.8 percent). This rate is comparable to the 8.5 percent recorded in the OEWS database for the 1999–2009 period and more rapid than the 1.6 percent projected for 2029, which would be somewhat below average relative to projected job growth overall. The next two sections discuss the 27 occupations in these two groups in more detail.
Reading four key works on automation, one finds 11 occupations used as illustrations whose employment levels were likely to be relatively unaffected by previous waves of computing.25 Therefore, one can have somewhat greater confidence that recent or projected employment declines for these occupations reflect newer technology, like robotics and AI, exclusively. In contrast to these “pure cases,” the next section (“Occupations also affected by previous waves of computing technology”) discusses occupations cited by the recent automation literature whose employment levels have likely been affected by prior waves of computing, as well as any effects of robots and AI. For none of the occupations in this section do the employment projections to 2029 or observed changes for the 2008–18 period fit the pattern of large-scale job loss suggested by the automation literature. The only occupation with actual or projected employment declines after 2008 is surgeons. The trend for this occupation–and for others growing at a below-average rate since 2008–is evident in the 1999–2009 period, as well, predating the AI breakthroughs of the early 2010s and therefore likely reflecting other forces (see table 3).
Recent works on automation note that algorithms can provide personalized financial advice.26 Indeed, BLS projections for 2029 anticipate greater use of “robo-advisors,” which have existed since the early 2000s.27 However, the projections anticipate that the demand for personal financial advisors will continue to increase, more than offsetting the anticipated labor-saving effects of AI-driven advising systems. Indeed, AI may be widening the market by reducing cost of personal financial advice for people who may have been unable to afford human advisors. In this case, AI will augment rather than replace labor, as human workers would not have been hired to serve these clients in the absence of AI.28 The projected 10-year growth will remain slightly above average (4.4 percent) but will not be close to the rapid 30-percent growth in both projections and reality for the 2008–18 period and the 87-percent growth recorded in the OEWS database for 1999 to 2009. Part of the growth in prior years reflected increases in the population engaging in retirement planning. Further research would be required to understand whether robo-advisors and other information technology account for a significant portion of the slowdown in growth since 2009.29
The development of machine translation is one of the most remarkable achievements of AI in the past 20 years. Combined with speech recognition and speech generation capabilities, translation software may substitute for human translators of both written text and real-time conversations and presentations.30 Nevertheless, projections to 2029 anticipate a 20-percent increase in jobs within this occupation as many businesses increasingly need translation services because of globalization. This would still represent deceleration compared with the 49.4-percent growth from 2008 to 2018, which itself was underestimated in the projections (22.2 percent), and the tripling recorded by the OEWS database in this small occupation from 1999 to 2009.
Surgical robots have received significant attention.31 Although some discuss them in the same context as industrial robots, suggesting they will substitute for nonroutine manual tasks performed by humans, others concede they are more likely to augment rather than replace human surgeons.32 A recent systematic review did not find clear advantages of robotic over conventional surgery despite greater cost and length of operations, though the technology may improve in the future.33 BLS projects the number of surgeon jobs will decline by 2 percent between 2019 and 2029, a significant moderation compared with the 30-percent decline from 2008 to 2018, which was probably not due to robot adoption, and a marked departure from the 17-percent increase that had been projected for the 2008–18 period. The OEWS also recorded a decline from 1999 to 2009 (−8.0 percent) despite the robust increase in jobs overall during this period.
Many consider radiology to be a clear case of a highly skilled white-collar occupation facing serious competition from deep-learning-based AI because of breakthroughs in image recognition after 2010.34 Numerous research papers show AI performance in automated image interpretation meets or exceeds those of radiologists and other medical professionals, generating considerable anxiety within these specialties.35 Some believe automated medical image reading will change the task content of radiology jobs but not greatly reduce employment.36 However, in 2016, Geoffrey Hinton, considered the father of deep learning and modern AI, said he thought the outlook for radiology jobs in the next 5 to 10 years was quite negative.37 Likewise, a paper in a leading radiology publication agreed that “machine learning will become a powerful force in radiology in the next 5 to 10 years [2021–26], not in multiple decades…. Indeed, in a few years there may be no specialty called radiology.”38
BLS does not track the number of radiology jobs specifically, but the American Medical Association has tracked employment and major professional activity for all physicians and numerous medical specialties over time. According to these data, the total number of physicians whose main activity was patient care increased from 647,430 in 2000 to 870,264 in 2019, nearly 16.8-percent growth per decade. The number of radiologists whose main activity was patient care increased from 28,444 in 2000 to 37,068 in 2019, or by 15.0 percent per decade, as shown in chart 2. This makes radiologists a small occupation by the standards of the previous section. Radiologists as a share of all physicians fluctuated between 4.40 and 4.50 percent for almost all years between 2000 and 2014, then decreased to 4.26 percent by 2019, shown in chart 3. Understanding the reasons for the relative decline would require further study, but it is both rather gradual and offset by the overall expansion in healthcare such that the absolute number of radiologists has not declined appreciably.39 Clearly, predictions of rapid labor substitution by AI are unlikely to be realized. Nevertheless, projections prepared for the Association of American Medical Colleges make passing reference to model predictions of a declining demand for radiologists between 2019 and 2034, without mentioning any estimated magnitude.40 Those projections are based on demographic changes and current treatment rates by group and do not take technological change into account.
It is important to recognize that trends in demand for radiologists are strongly affected by imaging reimbursement policies, population aging, and radiologists’ retirement rates.41 In addition, the practice of radiology involves a wide variety of complex diagnostic and related tasks. How rapidly AI can scale to substitute for an appreciable number of those myriad tasks and any new ones that result from medical progress is an empirical question, but the process is likely to be gradual and far from realized by 2026.42
In 2012, a San Francisco startup demonstrated a fully automatic machine for making hamburgers that purportedly produced 350 complete burgers per hour and would pay for itself in under 1 year of operation. These and similar robotic food preparation machines prompted some to consider that fast food employment could be cut by 25–50 percent by 2030, or some similar date.43 However, BLS projections to 2029 foresee 11.4-percent growth in this occupation, following nearly 30-percent increase for the 2008–18 period and 35-percent growth for the 1999–2009 period. The projections for the 2008–18 period (13.7 percent) underestimated actual growth considerably, so it will be interesting to see whether this occupation also grows faster than projected for the 2019–29 period.
The first robot vacuum cleaners were introduced in 2002, and their mapping and navigation software has grown much more sophisticated over time. Their early introduction provides a long timeframe to test the idea that even automation substituting for only some of an occupation’s component tasks will reduce the size of the occupation proportionately. More recently, robotic commercial floor cleaners have appeared, and such cleaning tasks are considered ripe for further substitution by robots.44 Both janitors and maids and housekeepers are quite large occupations. (See table 2 and chart A-1 in the appendix.) However, janitor jobs are projected to increase by 4.4 percent from 2019 to 2029, roughly in line with their modest growth rates since 1999. The number of maids and housekeepers have contracted modestly over time. The OEWS series used for the 1999–2009 period includes only wage and salary workers, while projections and observed data for the 2008–18 period and the 2019–29 period also include the self-employed, which increases the number of maids and housekeepers by more than two-thirds when comparing figures for 2008 and 2009. As such, comparisons across data series should not be made for this occupation. However, the projections show the total number of maids and housekeepers declined by less than 0.3 percent between 2008 and 2018, despite 16 years of robot vacuum sales, and a similar decline is projected for the 2019–29 period. Although private households have long sought relief from the task of vacuuming, which accounts for a meaningful share of work time for maids and housekeepers, the availability of robot vacuums does not seem to have made large inroads into the number of jobs in this occupation and is not expected to do so by 2029.
Robot lawn mowers that work without a human operator have attracted attention for years and have been cited as putting jobs at risk.45 However, one leading roboticist, the cocreator of the robotic vacuum cleaner, is skeptical that they can be easily adapted for work on commercial properties.46 BLS projects that jobs in this occupation will increase 10 percent from 2019 to 2029, though employment was flat from 2008 to 2018, when projections anticipated 18-percent growth, in contrast to the 16.3-percent growth recorded in the OEWS database for 1999 to 2009.
Driverless trucks have often been seen as the most likely near-term application of self-driving vehicles, though other writers on automation are more cautious about the ability of the technology to dispense with drivers entirely.47 Jobs in this occupation are projected to increase 1.5 percent between 2019 and 2029, which, while representing a slowdown from 2008 to 2018 (8.9 percent), is more rapid than the 0.5 percent decrease recorded in the OEWS database for 1999 to 2009.
Forklifts and other material-moving vehicles and carts represent another application of mobile robotic technology.48 However, industrial truck and tractor operators jobs are projected to remain stable between 2019 and 2029, continuing a pattern observed at least as far back as 1999, perhaps partly reflecting the growth in e-commerce.
Increased use of robots in warehouse operations might be expected to reduce the number of stock-handling jobs.49 However, projections anticipate the occupation will grow 4.2 percent between 2019 and 2029, a slowdown from the remarkable 27.5-percent growth over the 2008–18 period that may have reflected the growth of e-commerce. However, the projections for the 2008–18 period proved much too pessimistic (−0.8 percent), so more robust growth than projected for the 2019–29 period is possible. In any case, the projected growth for 2029 is comparable to the growth recorded in the OEWS database for the 1999–2009 period (4.9 percent).
Seventeen occupations used as examples in the recent automation literature have been affected by prior waves of computing technology, in addition to any effects from innovative robots and AI (see table 3, bottom panel). Therefore, recent and projected trends in employment in these occupations may reflect the continuing effects of previous waves of computing whose ultimate impact is not yet fully realized. Fourteen of these occupations are projected to decline or grow by at least half a percentage point below average from 2019 to 2029. Eleven of these 17 occupations declined between 2008 and 2018, and 7 also declined between 1999 and 2009. Clearly, the occupations exposed to prior waves of computing have more consistently negative employment trends and projected trends than the occupations more plausibly affected only by recent advances in AI and robotics.
Recent research on automation notes that traditional algorithms threaten to automate the mortgage origination tasks of loan officers.50 Projections anticipate modest growth (3.2 percent) to 2029, though the slight decline during the 2008–18 period (−3.2 percent) was not anticipated by the projections (10.1 percent), so it would not be surprising if future growth were modestly negative, as well. By contrast, the OEWS database registered robust growth (49.0 percent) from 1999 to 2009.
Recent writing cites tax preparers as affected negatively by the ready availability of tax preparation software packages, as well as offshoring.51 These software packages may use an earlier, rule-based form of AI called expert systems. The BLS projections anticipate this occupation will decline by 0.6 percent by 2029, though the decline for the 2008–18 period (−9.7 percent) was not anticipated by the projections for that period (2.9 percent). Nevertheless, this occupation grew 5.2 percent from 1999 to 2009, despite the general availability of tax software during that period.
One source credits the leading tax program with putting many jobs at risk by “allowing a machine to do the jobs of hundreds of thousands of human tax preparers.”52 However, the total number of dedicated tax preparer jobs never reached 100,000 according to available occupation statistics. The occupation grew from 69,000 in 2000 to 96,000 in 2008, then declined by 9,300 jobs to 87,000 jobs in 2018.53 (See tables 2 and 3.)
In fact, high rates of part-year and part-time work make determining the exact number of tax preparers rather complicated. Every year, jobs in the tax preparation services industry peak in February and decline 70–80 percent by July or August.54 The OEWS data will miss the peak because the program gathers data in May and November. The Quarterly Census of Employment and Wages, which is the source of the figures just cited, collects data each month, but only captures jobs by industry, not by occupation. However, if the core occupation were at risk from expert systems software, it may be reasonable to consider much of the rest of the industry vulnerable as well. Chart 4 shows trends in the tax preparation industry’s employment for 2001 to 2019 using both February and annual average figures.55 Both series show jobs growing from 2001 to 2009 before falling back to levels similar to those in 2001 by 2019, though the downward trend is much more modest for the annual average. Whether this decrease is merely a return to prior levels or the first stage of a long-run decline remains to be seen. Some fraction of accountants also engages in tax preparation, but job and task variety within that occupation would be expected to buffer the employment effects of tax software within the occupation.
There have been previous efforts to automate aspects of software production, such as the development of computer-aided software engineering tools. Although some current writing on automation believes algorithms are likely to replace human programmers, others consider this to be a more distant prospect or even less likely.56 Artificial intelligence has been used to create programs that can automatically write computer code in response to plain-language requests, but the code often fails or requires modifications by humans, limiting potential use.57 Information technology occupations have tended to grow strongly despite the growth of automation and software tools, and current projections anticipate they will continue to do so. One exception is the computer programmer occupation, which is projected to decline by 9.4 percent from 2019 to 2029. However, BLS projections research attributes this mostly to offshoring. The projected magnitude may be an underestimate given the actual decline for the 2008–18 period (−41.3 percent) was far greater than projected (−3 percent), despite a similar decline registered in the OEWS database from 1999 to 2009 (−30.4 percent). Nevertheless, the importance of offshoring complicates any effort to attribute the declining number of jobs in this occupation to automation or AI.
Lawyers and paralegals have been affected by a form of offshoring known as legal process outsourcing, as well as by cost-cutting pressures during and after the financial crisis of 2007–08.58 However, the increased ability of AI software to process troves of electronic documents has led to suggestions that tasks performed by lawyers, paralegals, and related occupations may be under much greater threat from future automation.59 By contrast, Professors Dana Remus and Frank Levy find lawyers’ tasks are much more diverse than recognized in these writings, and only about 4 percent of billed hours are spent on document review, which is the only task strongly susceptible to automation.60 Consistent with this view of modest task substitution, BLS projects jobs will increase 4.0 percent for lawyers and 10.4 percent for paralegals between 2019 and 2029, though, again, this represents a slowdown for both groups relative to the 2008–18 period (8.5 percent and 13.7 percent) and even more so compared with rates recorded in the OEWS database for the 1999–2009 period (13.0 percent and 26.3 percent). Although the projections anticipate paralegals will take on more of the tasks previously assigned to legal secretaries and entry-level attorneys, BLS research economists do not consider technology to be a major driver of employment growth for these occupations.
Even more than legal occupations, journalist jobs have been changed by prior technology, most notably the internet and social media, which have led to declining readership and lower advertising revenue for many long-established news outlets. However, AI is now being used to compose simple news stories, corporate earnings reports, and similar reading matter, potentially reducing the need for journalists and public relations personnel.61 The projections anticipate news-related jobs will decline by 11.2 percent between 2019 and 2029, although this decline would be more moderate than the declines for the 2008–18 period (−28.3 percent) and recorded in the OEWS database for the 1999–2009 period (−19.6 percent). However, the decline for 2008–18 was much greater than projected (−6.3 percent), so it is possible that the projected decline for 2029 is also an underestimate.
By contrast, the number of public relations specialists is projected to grow more than 7 percent between 2019 and 2029. Comparable figures are not available for 2008 to 2018, but the occupation grew much faster from 1999 to 2009, more than doubling according to the OEWS database. Nevertheless, this occupation is likely an example in which AI may automate certain tasks, like composing certain kinds of press releases, without substituting for enough tasks within the occupation to meaningfully decrease employment.
Occupations in retail have been cited as vulnerable in recent work on automation.62 The projections for 2019–29 agree that retail jobs are likely to decline. However, prior technologies, such as e-commerce and mobile apps, are likely to be more important than AI and robotics.63 Projections research finds cashiers are also likely to decline because of greater use of self-checkout, mobile payments, and the bundling of checkout tasks into retail salespersons’ jobs, none of which rely heavily on AI. Cashiers are projected to decline by 7.4 percent between 2019 and 2029 after growing by 2.8 percent (2008–18) and 8.8 percent (1999–2009). Jobs for retail salespersons and counter and rental clerks are projected to be flat, continuing the trend from 2008–18, while the number of first-line retail supervisors is expected to decline modestly (−5.5 percent), continuing a trend visible since 1999.
Telemarketers and customer service representatives (CSR) have been replaced or supplemented with interactive voice response systems that can present callers or listeners with a preprogrammed set of options and, in some cases, interpret human speech and respond flexibly to queries in a limited fashion. Some see these jobs as vulnerable to replacement as artificial intelligence improves while others view customer service jobs as less amenable to automation because customer queries make tasks unpredictable.64 In fact, CSR jobs are projected to remain stable, after growing by 32 percent (2008–18) and 23 percent (1999–2009), despite marked increases in the offshoring of CSR jobs over time. Projections research finds telemarketing jobs are more threatened by increased use of digital marketing than AI. Telemarketing jobs are anticipated to fall 14.2 percent over 2019–29, which may be optimistic given previous declines of 51 percent (2008–18) and 37 percent (1999–2009), which projections research attributed mostly to the increased use of “do not call” registries and caller ID functions on telephones, rather than automation.
As e-commerce has increased the need for efficient warehouses, efforts to automate warehouse operations have grown. Advances in warehouse robotics have received particular attention, but the focus on technological substitution usually does not account for the scale effects of e-commerce expansion.65 In addition, only about 20 percent of stockers and order fillers are employed in the warehouse and storage industry, in which the introduction of robots is furthest along. As such, this may be another example in which job diversity within an occupation limits the potential for technological substitution.66 BLS projects this occupation will grow 0.7 percent between 2019 and 2029, much less than the 10.6-percent growth between 2008 and 2018 (which was close to the projected value of 7.2 percent), and also less than the more modest 3.5-percent growth in the OEWS between 1999 and 2009. The projection of stable employment to 2029 reflects the combined effects of labor substitution due to various technologies (automated order-taking systems and automated storage and retrieval equipment based on sensors, bar codes, and radio frequency identification) and the growth of labor demand for tasks that technology cannot replace, a scale effect. Many of the computing technologies, as well as e-commerce itself, predate the recent wave of mobile robotics and machine learning, so there is some element of technological continuity in this case. Given the continued expansion of e-commerce, occupational employment trends in this sector may be a race between increasing technological capabilities and increasing demand for the industry’s output.
Many of the functions of this occupation have been replaced by websites.67 The projections anticipate ticket agent jobs will drop nearly 3 percent from 2019 to 2029, which would represent significant moderation of the 20.5-percent decline from 2008 to 2018. However, the projections for 2008–18 anticipated job growth (8.1 percent), so there may be similar issues with the projections to 2029. Nevertheless, the decline from 2008 to 2018 was more moderate than the decline from 1999 to 2009 (−35.9 percent), so there is no evidence of accelerated job loss either.
A number of agricultural robots are dexterous enough to milk cows, apply fertilizers and pesticides, prune grape vines, and harvest oranges, strawberries, and almonds.68 However, farm jobs have been declining for many decades, so the extension of machines to fine motor tasks such as picking fruits and vegetables would represent a kind of handoff between older and newer technologies, rather than an entirely new area in which technology substitutes for labor. Nevertheless, this group of occupations is projected to grow by 1.0 percent between 2019 and 2029, after having grown more than 9.0 percent from 2008 to 2018, despite projections of 2.4-percent decline. According to the BLS projections research, this is because the effect of further mechanization, which reduces labor demand, is expected to be more than offset by increases in production, a scale effect. For table 2 and table 3, this group also includes agricultural equipment operators, who are projected to grow, in order to capture slightly offsetting job growth due to increased technology use in these work settings. The OEWS database recorded 8.9-percent growth for this occupation from 1999 to 2009, but the OEWS database excludes most agriculture-related industries so comparisons between the two series are inappropriate for this sector.
Welding was one of the earliest applications of industrial robotics and remains one of the most common uses of commercial robots.69 However, after declining nearly 17 percent between 1999 and 2009, the number of welders remained relatively flat over 2008–18, consistent with projections. The projections for 2019–29 also anticipate little change.
The previous sections examined employment trends in occupations selected because of their presumed vulnerability to new automation technologies. By contrast, this section begins with the occupations that have experienced the largest job losses and discusses the technologies that may be responsible for their decline.
Table 4 is based on the same 669 occupations in the OEWS database as table 1. The top row shows that employment in these occupations increased 17 percent over the 19-year period, 1999 to 2018. Among 238 occupations that experienced large losses (greater than 5 percent) between 1999 and 2018, the total number of jobs declined by 8.5 million, or 31 percent, over 19 years (row 2). Relative to all jobs in 1999, this represents a loss of 7.4 percent. Because the number of jobs increased overall, retaining the jobs that were lost would have increased the total in 2018 by somewhat less (6.4 percent). Both figures are many times smaller than the widely cited 47-percent job loss envisioned for the 2010–30 period, despite reflecting other forces, such as trade and offshoring, in addition to technological change. In addition, the losses were more than offset by job gains elsewhere, as the total number of jobs increased by more than 19 million between 1999 and 2018, implying the other occupations gained more than 28 million jobs.
| SOC code | Title | 1999 | 2018 | Change | Percent change |
|---|---|---|---|---|---|
| All occupations | 114,728,000 | 134,219,408 | 19,491,408 | 17.0 | |
| Occupations losing more than 5 percent of jobs | 27,403,670 | 18,856,440 | -8,547,230 | -31.2 | |
| Occupations losing more than 45 percent of jobs | 7,032,300 | 2,651,060 | -4,381,240 | -62.3 | |
43-9021 | Data entry keyers | 520,220 | 174,930 | -345,290 | -66.4 |
41-9041 | Telemarketers | 485,650 | 164,160 | -321,490 | -66.2 |
15-1021 | Computer programmers | 528,600 | 230,470 | -298,130 | -56.4 |
51-6031 | Sewing machine operators | 403,770 | 136,450 | -267,320 | -66.2 |
43-9022 | Word processors and typists | 271,310 | 53,130 | -218,180 | -80.4 |
43-4151 | Order clerks | 376,430 | 159,210 | -217,220 | -57.7 |
43-2011 | Switchboard operators | 248,570 | 71,600 | -176,970 | -71.2 |
51-4031 | Cutting, punching, press machine setters/operators | 353,300 | 186,640 | -166,660 | -47.2 |
43-9011 | Computer operators | 198,500 | 34,700 | -163,800 | -82.5 |
43-4071 | File clerks | 266,890 | 110,020 | -156,870 | -58.8 |
43-5053 | Postal service mail sorters, processors, operators | 234,820 | 103,830 | -130,990 | -55.8 |
17-3023 | Electrical and electronic engineering technicians | 242,160 | 126,950 | -115,210 | -47.6 |
43-9051 | Mail clerks and mail machine operators, except postal | 198,440 | 86,150 | -112,290 | -56.6 |
53-7063 | Machine feeders and offbearers | 176,400 | 66,380 | -110,020 | -62.4 |
47-2211 | Sheet metal workers | 231,690 | 131,570 | -100,120 | -43.2 |
51-5022 | Prepress technicians and workers | 109,350 | 29,990 | -79,360 | -72.6 |
51-4032 | Drilling and boring machine tool setters/operators | 75,140 | 11,400 | -63,740 | -84.8 |
51-9151 | Photographic process workers/machine operators | 76,440 | 16,680 | -59,760 | -78.2 |
51-4111 | Tool and die makers | 132,350 | 72,700 | -59,650 | -45.1 |
43-5021 | Couriers and messengers | 134,370 | 75,720 | -58,650 | -43.6 |
51-6063 | Textile knitting/weaving machine setters/operators/tenders | 79,440 | 21,190 | -58,250 | -73.3 |
51-4033 | Grinding/lapping/polishing/buffing machine tool setters/operators/tenders | 127,920 | 71,870 | -56,050 | -43.8 |
51-6021 | Pressers, textile, garment, and related materials | 93,320 | 38,320 | -55,000 | -58.9 |
51-4034 | Lathe and turning machine tool setters/operators/tenders | 83,940 | 29,510 | -54,430 | -64.8 |
43-4041 | Credit authorizers, checkers, and clerks | 82,900 | 29,980 | -52,920 | -63.8 |
43-9071 | Office machine operators, except computer | 101,490 | 48,580 | -52,910 | -52.1 |
51-6064 | Textile winding, twisting, and drawing out machine setters/operators/tenders | 83,360 | 31,650 | -51,710 | -62.0 |
43-2021 | Telephone operators | 50,820 | 5,160 | -45,660 | -89.8 |
51-2021 | Coil winders, tapers, and finishers | 56,350 | 12,190 | -44,160 | -78.4 |
31-9094 | Medical transcriptionists | 97,260 | 53,730 | -43,530 | -44.8 |
Total | [1] | 6,121,200 | 2,384,860 | -3,736,340 | [1] |
Note: [1] Not applicable. SOC = Standard Occupational Classification system. There are 669 occupations that could be tracked consistently over 1999–2018. There were 248 occupations that lost more than 5 percent of jobs and 84 occupations that lost more than 45 percent of jobs. Occupations known or believed to have declined because of changes in coding practices are excluded from the table. The final column is percent change for 1999–2018. All occupation codes are from SOC 2000, except SOC 51-9151 (photographic process workers), which harmonizes occupational categories across classification systems to the SOC 2010 value. Values in the bottom row are column totals. Between 1999 and 2018, the total number of jobs in these 30 occupations declined by 61.0 percent. Source: U.S. Bureau of Labor Statistics, Occupational Employment Statistics 1999–2018. | |||||
There is a much smaller group of 81 occupations whose employment declined by more than 45 percent between 1999 and 2018, equivalent to a 47-percent drop over two decades. The total number of jobs in this group decreased by more than 62 percent (table 4, row 3). However, the 4.4 million jobs lost represent only 3.8 percent of all jobs in 1999 and would have added only 3.3 percent to the total in 2018 had they not been lost. Even though the percent losses within these occupations were similar to those foreseen in the recent automation literature, they were quite atypical, so their effect on overall employment was much smaller than the magnitude of their decline might suggest. This is not intended to minimize the number of jobs lost, the hardships experienced by workers affected by them, or the implications of the changing occupational composition for inequality and economic opportunity more generally. However, the incidence of these dramatic declines is more than an order of magnitude smaller than the 47-percent potential job losses commonly cited in the automation literature. One can find particular occupations that experienced dramatic job losses, but they do not generalize to the broader workforce, even during the first decade of the new wave of robotics and AI. The future would have to diverge dramatically from past patterns for job losses overall to reach 47 percent over 20 years.
Table 4 shows the 30 detailed occupations that lost the largest absolute number of jobs between 1999 and 2018, in descending order.70 Except for four occupations that each declined nearly 45 percent, this group is a subset of the 81 occupations discussed above. This group accounts for 81 percent of jobs in occupations experiencing large percent drops. The total number of jobs in this group decreased 61 percent over 20 years. These occupations are notable for the apparent influence of previous waves of computing technologies (for example, those used for data entry keyers, word processors, file clerks, switchboard operators) and previous waves of mechanical technologies (for example, those used by sewing machine operators, mail sorters), as well as possible effects of trade and offshoring. The large decline in sewing machine operators reflects the continuation of a decades-long trend, while the large decline in word processors and data entry keyers reflects the ongoing effects of the microcomputer revolution beginning in the early 1980s and subsequent growth of digital data capture. Although the newest technologies attract the greatest attention, most of the major contractions appear to reflect long-run implications of more established technologies, whose full effects unfold over many decades. In terms of overall magnitude, even these reductions represent a 20-year loss of only about 2.5 percent of jobs, whether calculated with 1999 or 2018 totals as the base value.
Finally, consideration of the new technology raises the question of the jobs they create, as well as replace. Tables 5 and 6 show trends in science, technology, engineering, and mathematics-related (STEM) jobs. The projections anticipate that computer-related jobs will increase 11.5 percent between 2019 and 2029. However, this may be an underestimate, given growth rates around 30 percent between 1999 and 2018, which were somewhat underprojected for the 2008–18 period. Math-related occupations have grown even faster and are projected to continue to do so for the 2019–29 period, but this group is only about one-twentieth the size of the ICT occupational group. The most notable developments include the near doubling of statistician jobs from 2008 to 2018 and the emergence of data scientist as a recognized occupation. It seems likely that these trends reflect the increasing need for workers in fields like machine learning and data analytics. Some of these jobs produce the software whose potential to replace other kinds of labor have prompted recent concerns. Nevertheless, these two occupations together accounted for only 76,000 jobs in 2019 and were projected to grow to 101,000 jobs by 2029. Other STEM occupations experienced even weaker performance, lagging overall job growth between 2008 and 2018 and projected to continue to do so between 2019 and 2029.
| SOC code | Title | OEWS | Projections database | |||||
|---|---|---|---|---|---|---|---|---|
| 1999 | 2009 | 2008 | 2018p | 2018 | 2019 | 2029p | ||
ICT occupations | ||||||||
15-1251 | Computer programmers | 528.6 | 367.9 | 426.7 | 414.4 | 250.3 | 213.9 | 193.8 |
15-1232 | Computer user support specialists | 462.8 | 540.6 | 565.7 | 643.7 | 671.8 | 687.2 | 741.9 |
15-1221 | Computer and information research scientists | 26.3 | 26.1 | 28.9 | 35.9 | 31.7 | 32.7 | 37.7 |
15-1245 | Database administrators and architects | 101.5 | 108.1 | 120.4 | 144.7 | 116.9 | 132.5 | 145.3 |
15-1098[2] | Combination (15-1051, 15-1071, 15-1081) | 731.2 | 1,077.7 | 1,163.7 | 1,506.5 | 1,641.2 | [1] | [1] |
15-1211 | Computer systems analysts | [1] | [1] | [1] | [1] | [1] | 632.4 | 679.0 |
15-1212 | Information security analysts | [1] | [1] | [1] | [1] | [1] | 131.0 | 171.9 |
15-1231 | Computer network support specialists | [1] | [1] | [1] | [1] | [1] | 195.1 | 207.7 |
15-1241 | Computer network architects | [1] | [1] | [1] | [1] | [1] | 160.1 | 168.1 |
15-1244 | Network and computer systems administrators | [1] | [1] | [1] | [1] | [1] | 373.9 | 389.9 |
15-1031[2] | Software engineers, applications | 287.6 | 495.5 | 514.8 | 689.9 | 944.2 | [1] | [1] |
15-1032[2] | Software engineers, systems software | 209.0 | 385.2 | 394.8 | 515.0 | 421.3 | [1] | [1] |
15-1256 | Software developers and quality assurance | [1] | [1] | [1] | [1] | [1] | 1,469.2 | 1,785.2 |
15-1257 | Web developers and digital interface designers | [1] | [1] | [1] | [1] | [1] | 174.3 | 188.3 |
15-1299 | Computer occupations, all other | [1] | [1] | 209.3 | 236.8 | 412.8 | 431.1 | 455.8 |
| Subtotal | 2,347.0 | 3,001.0 | 3,424.3 | 4,187.0 | 4,490.2 | 4,633.4 | 5,164.6 | |
Mathematics and statistical occupations | ||||||||
15-2011 | Actuaries | 12.6 | 17.9 | 19.7 | 23.9 | 25.0 | 27.7 | 32.6 |
15-2021 | Mathematicians | 3.5 | 2.8 | 2.9 | 3.6 | 2.9 | 2.9 | 3.0 |
15-2031 | Operations research analysts | 43.8 | 61.0 | 63.0 | 76.9 | 109.7 | 105.1 | 131.3 |
15-2041 | Statisticians | 14.6 | 21.4 | 22.6 | 25.5 | 44.4 | 42.7 | 57.5 |
15-2098 | Data scientists and math occupations, all other | [1] | [1] | [1] | [1] | [1] | 33.2 | 43.4 |
15-2090 | Miscellaneous mathematical occupations | [1] | [1] | 7.8 | 9.1 | 2.3 | [1] | [1] |
| Subtotal | 74.4 | 103.0 | 116.1 | 139.1 | 184.3 | 211.6 | 267.8 | |
All other STEM (excluding social scientists, 19-3000) | ||||||||
17, 19 | Architecture, engineering, life, physical sciences | 2,515.1 | 2,868.4 | 3,526.5 | 3,953.8 | 3,667.9 | 3,822.5 | 3,949.1 |
| Total | 4,936.5 | 5,972.5 | 7,066.9 | 8,279.9 | 8,342.4 | 8,667.5 | 9,381.5 | |
Note: [1] Not applicable. [2] This occupation code is specific to a particular period. SOC = Standard Occupational Classification system; OEWS = Occupational Employment and Wage Statistics; STEM = science, technology, engineering, and mathematics; ICT = information and communications technology; and p = projected value. All occupation codes are from SOC 2010, except those indicated by note 2. In some cases, identical titles may refer to different occupational definitions across periods (one example is: computer occupations, all other). Source: U.S. Bureau of Labor Statistics, Occupational Employment Statistics 1999-2009 and occupational projections files for 2008-18 and 2019-29. | ||||||||
| SOC code | Title | Absolute change (in thousands) | Percent change | ||||||
|---|---|---|---|---|---|---|---|---|---|
| 1999–2009 | 2008–18p | 2008–18 | 2019–29p | 1999–2009 | 2008–18p | 2008–18 | 2019–29p | ||
ICT occupations | |||||||||
15-1251 | Computer programmers | -160.7 | -12.3 | -176.4 | -20.1 | -30.4 | -2.9 | -41.3 | -9.4 |
15-1232 | Computer user support specialists | 77.7 | 78.0 | 106.1 | 54.7 | 16.8 | 13.8 | 18.8 | 8.0 |
15-1221 | Computer and information research scientists | -0.2 | 7.0 | 2.8 | 5.0 | -0.6 | 24.2 | 9.7 | 15.3 |
15-1245 | Database administrators and architects | 6.6 | 24.4 | -3.5 | 12.8 | 6.5 | 20.3 | -2.9 | 9.7 |
15-1098[2] | Combination (15-1051, 15-1071, 15-1081) | 346.5 | 342.8 | 477.5 | [1] | 47.4 | 29.5 | 41.0 | [1] |
15-1211 | Computer systems analysts | [1] | [1] | [1] | 46.6 | [1] | [1] | [1] | 7.4 |
15-1212 | Information security analysts | [1] | [1] | [1] | 40.9 | [1] | [1] | [1] | 31.2 |
15-1231 | Computer network support specialists | [1] | [1] | [1] | 12.6 | [1] | [1] | [1] | 6.5 |
15-1241 | Computer network architects | [1] | [1] | [1] | 8.0 | [1] | [1] | [1] | 5.0 |
15-1244 | Network and computer systems administrators | [1] | [1] | [1] | 16.0 | [1] | [1] | [1] | 4.3 |
15-1031[2] | Software engineers, applications | 207.9 | 175.1 | 429.4 | [1] | 72.3 | 34.0 | 83.4 | [1] |
15-1032[2] | Software engineers, systems software | 176.2 | 120.2 | 26.5 | [1] | 84.3 | 30.4 | 6.7 | [1] |
15-1256 | Software developers and quality assurance | [1] | [1] | [1] | 316.0 | [1] | [1] | [1] | 21.5 |
15-1257 | Web developers and digital interface designers | [1] | [1] | [1] | 14.0 | [1] | [1] | [1] | 8.0 |
15-1299 | Computer occupations, all other | [1] | 27.5 | 203.4 | 24.7 | [1] | 13.1 | 97.2 | 5.7 |
| Subtotal | 654.0 | 762.7 | 1,065.9 | 531.2 | 27.9 | 22.3 | 31.1 | 11.5 | |
Mathematics and statistical occupations | |||||||||
15-2011 | Actuaries | 5.4 | 4.2 | 5.3 | 4.9 | 42.8 | 21.4 | 26.8 | 17.7 |
15-2021 | Mathematicians | -0.7 | 0.7 | -0.1 | 0.1 | -19.7 | 22.5 | -1.9 | 3.4 |
15-2031 | Operations research analysts | 17.2 | 13.9 | 46.7 | 26.2 | 39.3 | 22.0 | 74.1 | 24.9 |
15-2041 | Statisticians | 6.8 | 2.9 | 21.8 | 14.8 | 46.2 | 13.1 | 96.7 | 34.7 |
15-2098 | Data scientists, math occupations, all other | [1] | [1] | [1] | 10.2 | [1] | [1] | [1] | 30.7 |
15-2090 | Miscellaneous mathematical occupations | [1] | 1.3 | -5.5 | [1] | [1] | 16.2 | -70.7 | [1] |
| Subtotal | 28.7 | 23.0 | 68.2 | 56.2 | 38.5 | 19.8 | 58.7 | 26.6 | |
All other STEM (excluding social scientists, 19-3000) | |||||||||
17, 19 | Architecture, engineer, life, physical sciences | 353.4 | 427.3 | 141.4 | 126.6 | 14.0 | 12.1 | 4.0 | 3.3 |
| Total | 1,036.0 | 1,213.0 | 1,275.5 | 714.0 | 21.0 | 17.2 | 18.0 | 8.2 | |
Note: [1] Not applicable. [2] This occupation code is specific to a particular period. SOC = Standard Occupational Classification system; STEM = science, technology, engineering, and math; ICT = information and communications technology; and p = projected value. All occupation codes are from SOC 2010, except those indicated by note 2. In some cases, identical titles may refer to different occupational definitions across periods (one example is: computer occupations, all other). Source: U.S. Bureau of Labor Statistics, Occupational Employment Statistics 1999-2009 and occupational projections files for 2008-18 and 2019-29. | |||||||||
Numerous observers believe recent developments in robotics and AI may cause an unprecedented wave of automation-related job losses. In this view, the new technology is fundamentally different from earlier waves of computing technology because it improves at an accelerating rate and substitutes for a much wider range of job tasks. A widely cited scenario estimates that 47 percent of jobs are susceptible to automation between 2010 and 2030, implying a decisive break with previous rates of occupational growth and decline. As part of this argument, proponents have cited 28 detailed occupations as notably susceptible to job loss due to new technology. However, these occupations did not exhibit any general tendency toward notably rapid job loss in the first half of this period (2008–18) and are not projected to experience such losses in the second half (2019–29). Occupations that did decline were mostly those that were vulnerable to previous waves of computing technology and other trends, such as offshoring, rather than occupations newly susceptible to automation due to AI and advanced robotics. Actual job losses within these occupations for 2008–18 and the losses projected for 2019–29 often exhibit continuity with previous trends dating to 1999–2009 and are generally within the range of typical growth rates observed for all occupations for 1999–2018. This points to the importance of carefully distinguishing the effects of different generations of computing technology in any discussion of individual cases and overall trends. In general, most occupations are small, few decline by 30 percent or more over 10 years, and those that do so account for a small share of the total number of jobs. Although the performance of the 2008–18 projections with respect to these occupations taken individually was varied, the projections’ performance was strong for the group overall. The performance of the 2008–18 projections provides no reason to suppose that the projections to 2029, which also foresee gradual changes rather than a break with previous trends, systematically underestimate future job losses.
Even among the occupations cited in the automation literature, rates of actual and projected job loss rarely reached levels that the automation literature suggests are becoming common or soon will be. Although there are large occupations that experienced large percent declines over two decades, those occupations account for much less than 47 percent of jobs, and their losses are more than offset by growth in other occupations, which is to say those jobs are not representative of a broader trend.
Part of the reason new technology does not produce sharper changes in employment is the diversity of jobs within occupations and the diversity of tasks within jobs, not all of which are equally susceptible to technological substitution. Automation of some tasks may also alter the task composition of jobs, rather than simply reducing the number of jobs. The growth of product demand within industries implementing new technology can buffer the employment effects of technological change. On a broader scale, population growth and economic growth are associated with expanding employment. It is also possible that adoption rates for new production technology are more gradual than commonly assumed. The automation literature implicitly claims that technological substitution will be so great as to dominate any offsetting forces, producing unusually large job losses. However, the total number of jobs grew after the AI breakthroughs of the early 2010s, and BLS projects it will continue to do so, as will most of the specific occupations the automation literature considers to be on the leading edge of this wave of technological displacement.
Fears that automation will cause widespread job losses have been raised repeatedly in the past, which, in retrospect, usually greatly overestimated the scale of actual displacement. Recent experience and projections suggest a similar pattern may be occurring with recent developments in AI and robotics. For various reasons, technological change seems to be generally more gradual than commonly recognized. Prior waves of computing may be too familiar to receive much attention from observers of emerging trends, but their immediate effects are probably smaller than anticipated and their full impact unfolds gradually over a longer timeframe than recognized. None of this is to minimize the hardships experienced by displaced workers. However, rapid leaps in technology in the early 2010s prompted many to envision a future scenario of massive disruption. This article has examined specific occupations that are most favorable to the automation thesis and found little support for this view. It is entirely possible that robotics and AI are simply another in a long line of waves of innovation whose effects on employment will unfold at rates comparable to those in the past.
ACKNOWLEDGEMENT: I would like to thank Elizabeth Cross, Richard Freeman, Maury Gittleman, Lindsey Ice, Emily Krutsch, and Emily Rolen for very helpful comments on previous versions of this paper. I would like to thank Michael Wolf for very helpful comments, wide-ranging discussions, and assistance with the data used in this paper. I thank Stephen Pegula for providing data on radiology employment.
The automation literature and discussions of changes in the nature of work more generally often use specific occupations as illustrations of what are believed to be general trends. It is useful to have a better understanding of the range of occupational sizes in both absolute and relative terms to have some yardstick for judging whether any given occupation of interest is large or small. The mean occupation, which has approximately 200,000 jobs, could serve as a dividing line between large and small occupations, while the median, which is much smaller (approximately 54,000 jobs), is probably much too small to serve as a useful benchmark, though it does indicate the highly skewed nature of the distribution. In fact, a closer examination shows that there are relatively few occupations that can be considered large by most reasonable standards and many occupations that are small.
Table A-1 shows the distribution of occupations by size decile, with each decile containing about 79 occupations. The largest occupation accounted for 2.7 percent of jobs in 2019 (column 4), but the smallest occupation in the top decile had less than 0.3 percent of all jobs (column 3). The average occupation in the top decile had nearly 1.3 million jobs (column 1) and accounted for about 0.8 percent of all jobs (column 2). By contrast, the average occupation in the median (fifth) decile had only 67,000 jobs and accounted for 0.04 percent of all jobs. The number of jobs per occupation and their percent shares decline further from there. Collectively, the top two deciles, 158 occupations out of 790 total, accounted for over 78.1 percent of all jobs (column 6), while the remaining 632 occupations accounted for the remaining 21.9 percent of jobs. The bottom half of the distribution (395 occupations) accounted for only about 5.3 percent of all jobs. Clearly, any reference to a particular occupation as susceptible to automation will have very different implications depending on whether it is among the few large ones or the many small ones. If the latter, then the portrait of automation’s impact can easily be unrepresentative. Even among the largest occupations, there are many that account for only 0.15 percent to 0.30 percent of all jobs.
| Decile | Mean jobs per occupation (thousands) | Percent of all jobs in decile's mean occupation | Percent of jobs in decile's smallest occupation | Percent of jobs in decile's largest occupation | Total jobs in decile | Decile's percent share of all jobs |
|---|---|---|---|---|---|---|
1 | 1,267.9 | 0.78 | 0.29 | 2.69 | 100,167.3 | 61.53 |
2 | 341.7 | 0.21 | 0.14 | 0.28 | 26,996.7 | 16.58 |
3 | 168.1 | 0.10 | 0.08 | 0.14 | 13,283.4 | 8.16 |
4 | 106.9 | 0.07 | 0.05 | 0.08 | 8,445.6 | 5.19 |
5 | 67.3 | 0.04 | 0.03 | 0.05 | 5,316.5 | 3.27 |
6 | 44.0 | 0.03 | 0.02 | 0.03 | 3,432.8 | 2.11 |
7 | 29.8 | 0.02 | 0.02 | 0.02 | 2,382.5 | 1.46 |
8 | 19.0 | 0.01 | 0.01 | 0.01 | 1,497.2 | 0.92 |
9 | 11.6 | 0.01 | 0.01 | 0.01 | 894.9 | 0.55 |
10 | 4.7 | 0.00 | <0.001 | 0.01 | 379.7 | 0.23 |
All deciles | 206.1 | 0.13 | 0.00 | 2.69 | 162,796.6 | 100.00 |
Note: Assignment to occupational deciles is based on the number of jobs in an occupation. Deciles are shown from largest to smallest. Each decile contains 79 occupations, aside from ties. Figures in columns refer to (1) average number of jobs per occupation (in thousands), (2) average percent share of jobs per occupation, (3) minimum and (4) maximum percent shares of occupations in decile, (5) total number of jobs in decile (in thousands), and (6) the decile’s percent share of all jobs. Figures in the bottom row for all cases are means (columns 1 and 2), minimum and maximum values (columns 3 and 4), and sums (columns 5 and 6). Source: U.S. Bureau of Labor Statistics, occupational projections file for 2019–29. | ||||||
As an aside, because the largest approximately 20 percent of occupations account for nearly 80 percent of all jobs, it is natural to ask whether occupational size follows a power law. According to this mathematical model, the natural log of an occupation’s size is related linearly to the natural log of its rank, sorted from largest to smallest.71 Chart A-1 plots log occupation size against log occupation rank. The relationship is far from linear, and even a quadratic function (see chart A-2) shows significantly poor fit at either end, where actual occupational employment is much lower than predicted. Occupational size does not follow a power law. In fact, the distribution of occupational employment is strikingly close to a lognormal distribution (see chart A-3), which is also consistent with a highly skewed size distribution containing a large mass of relatively small occupations and a long tail containing a small number of large occupations.72
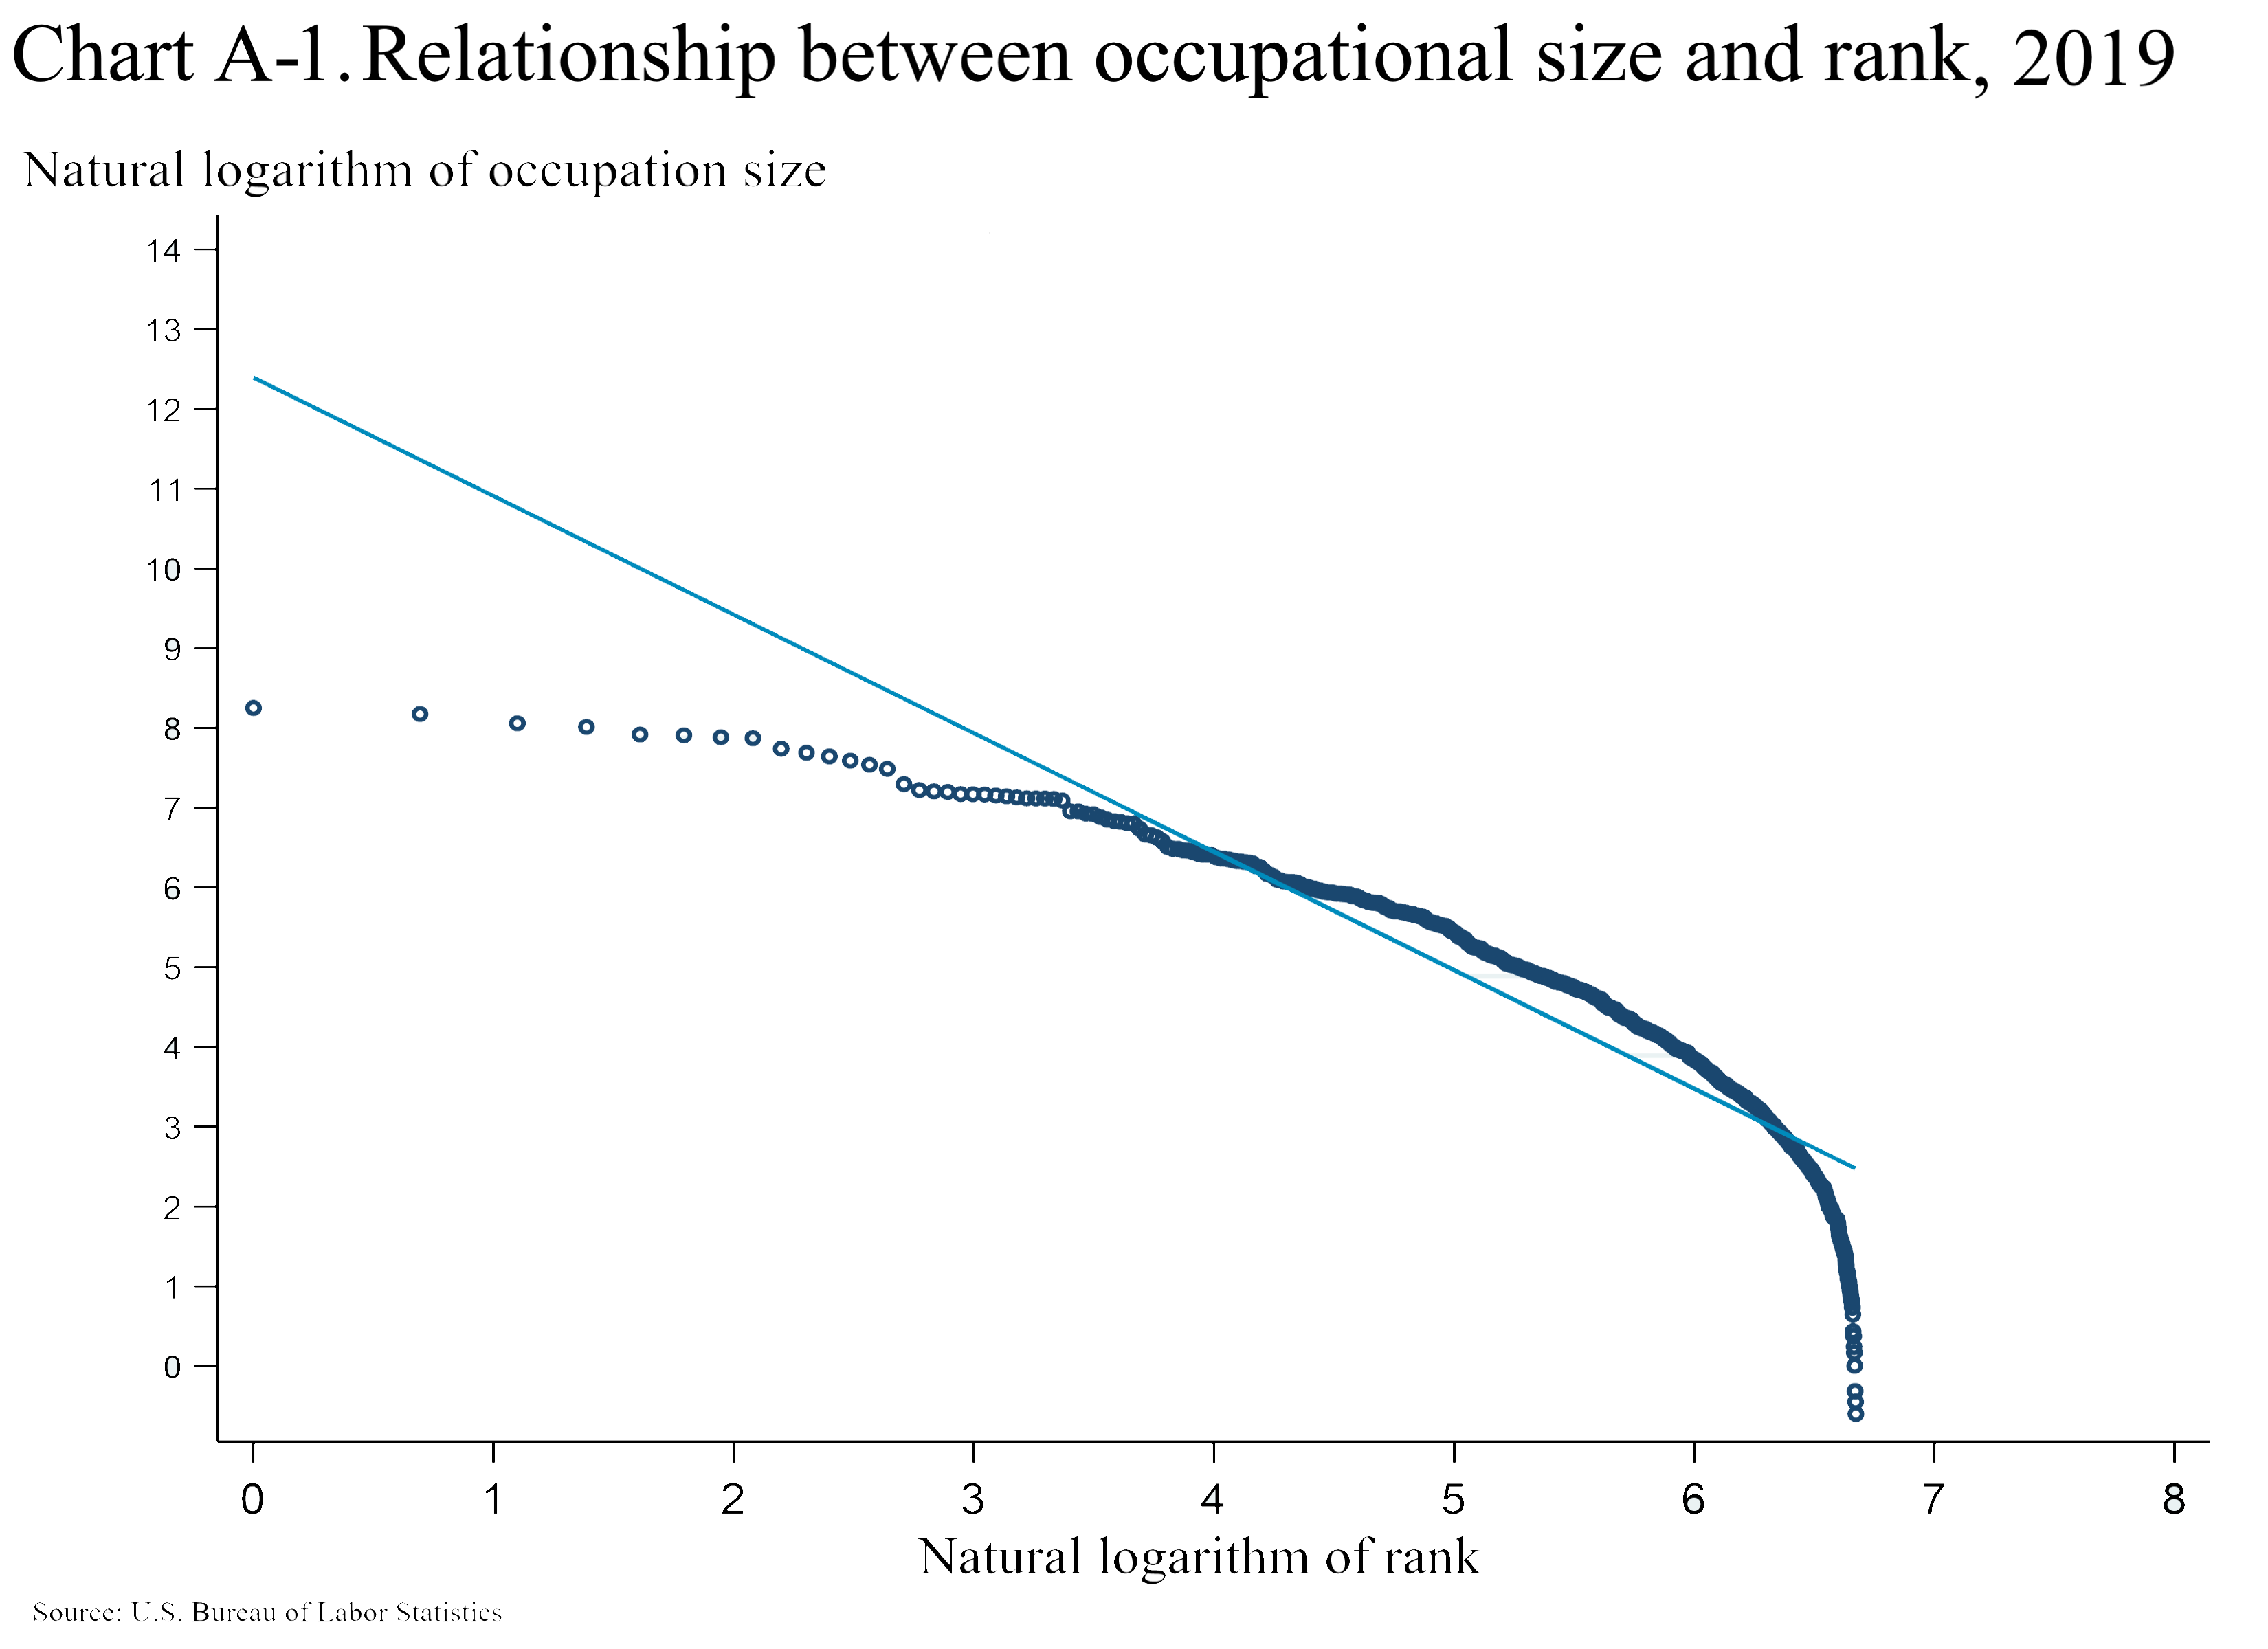
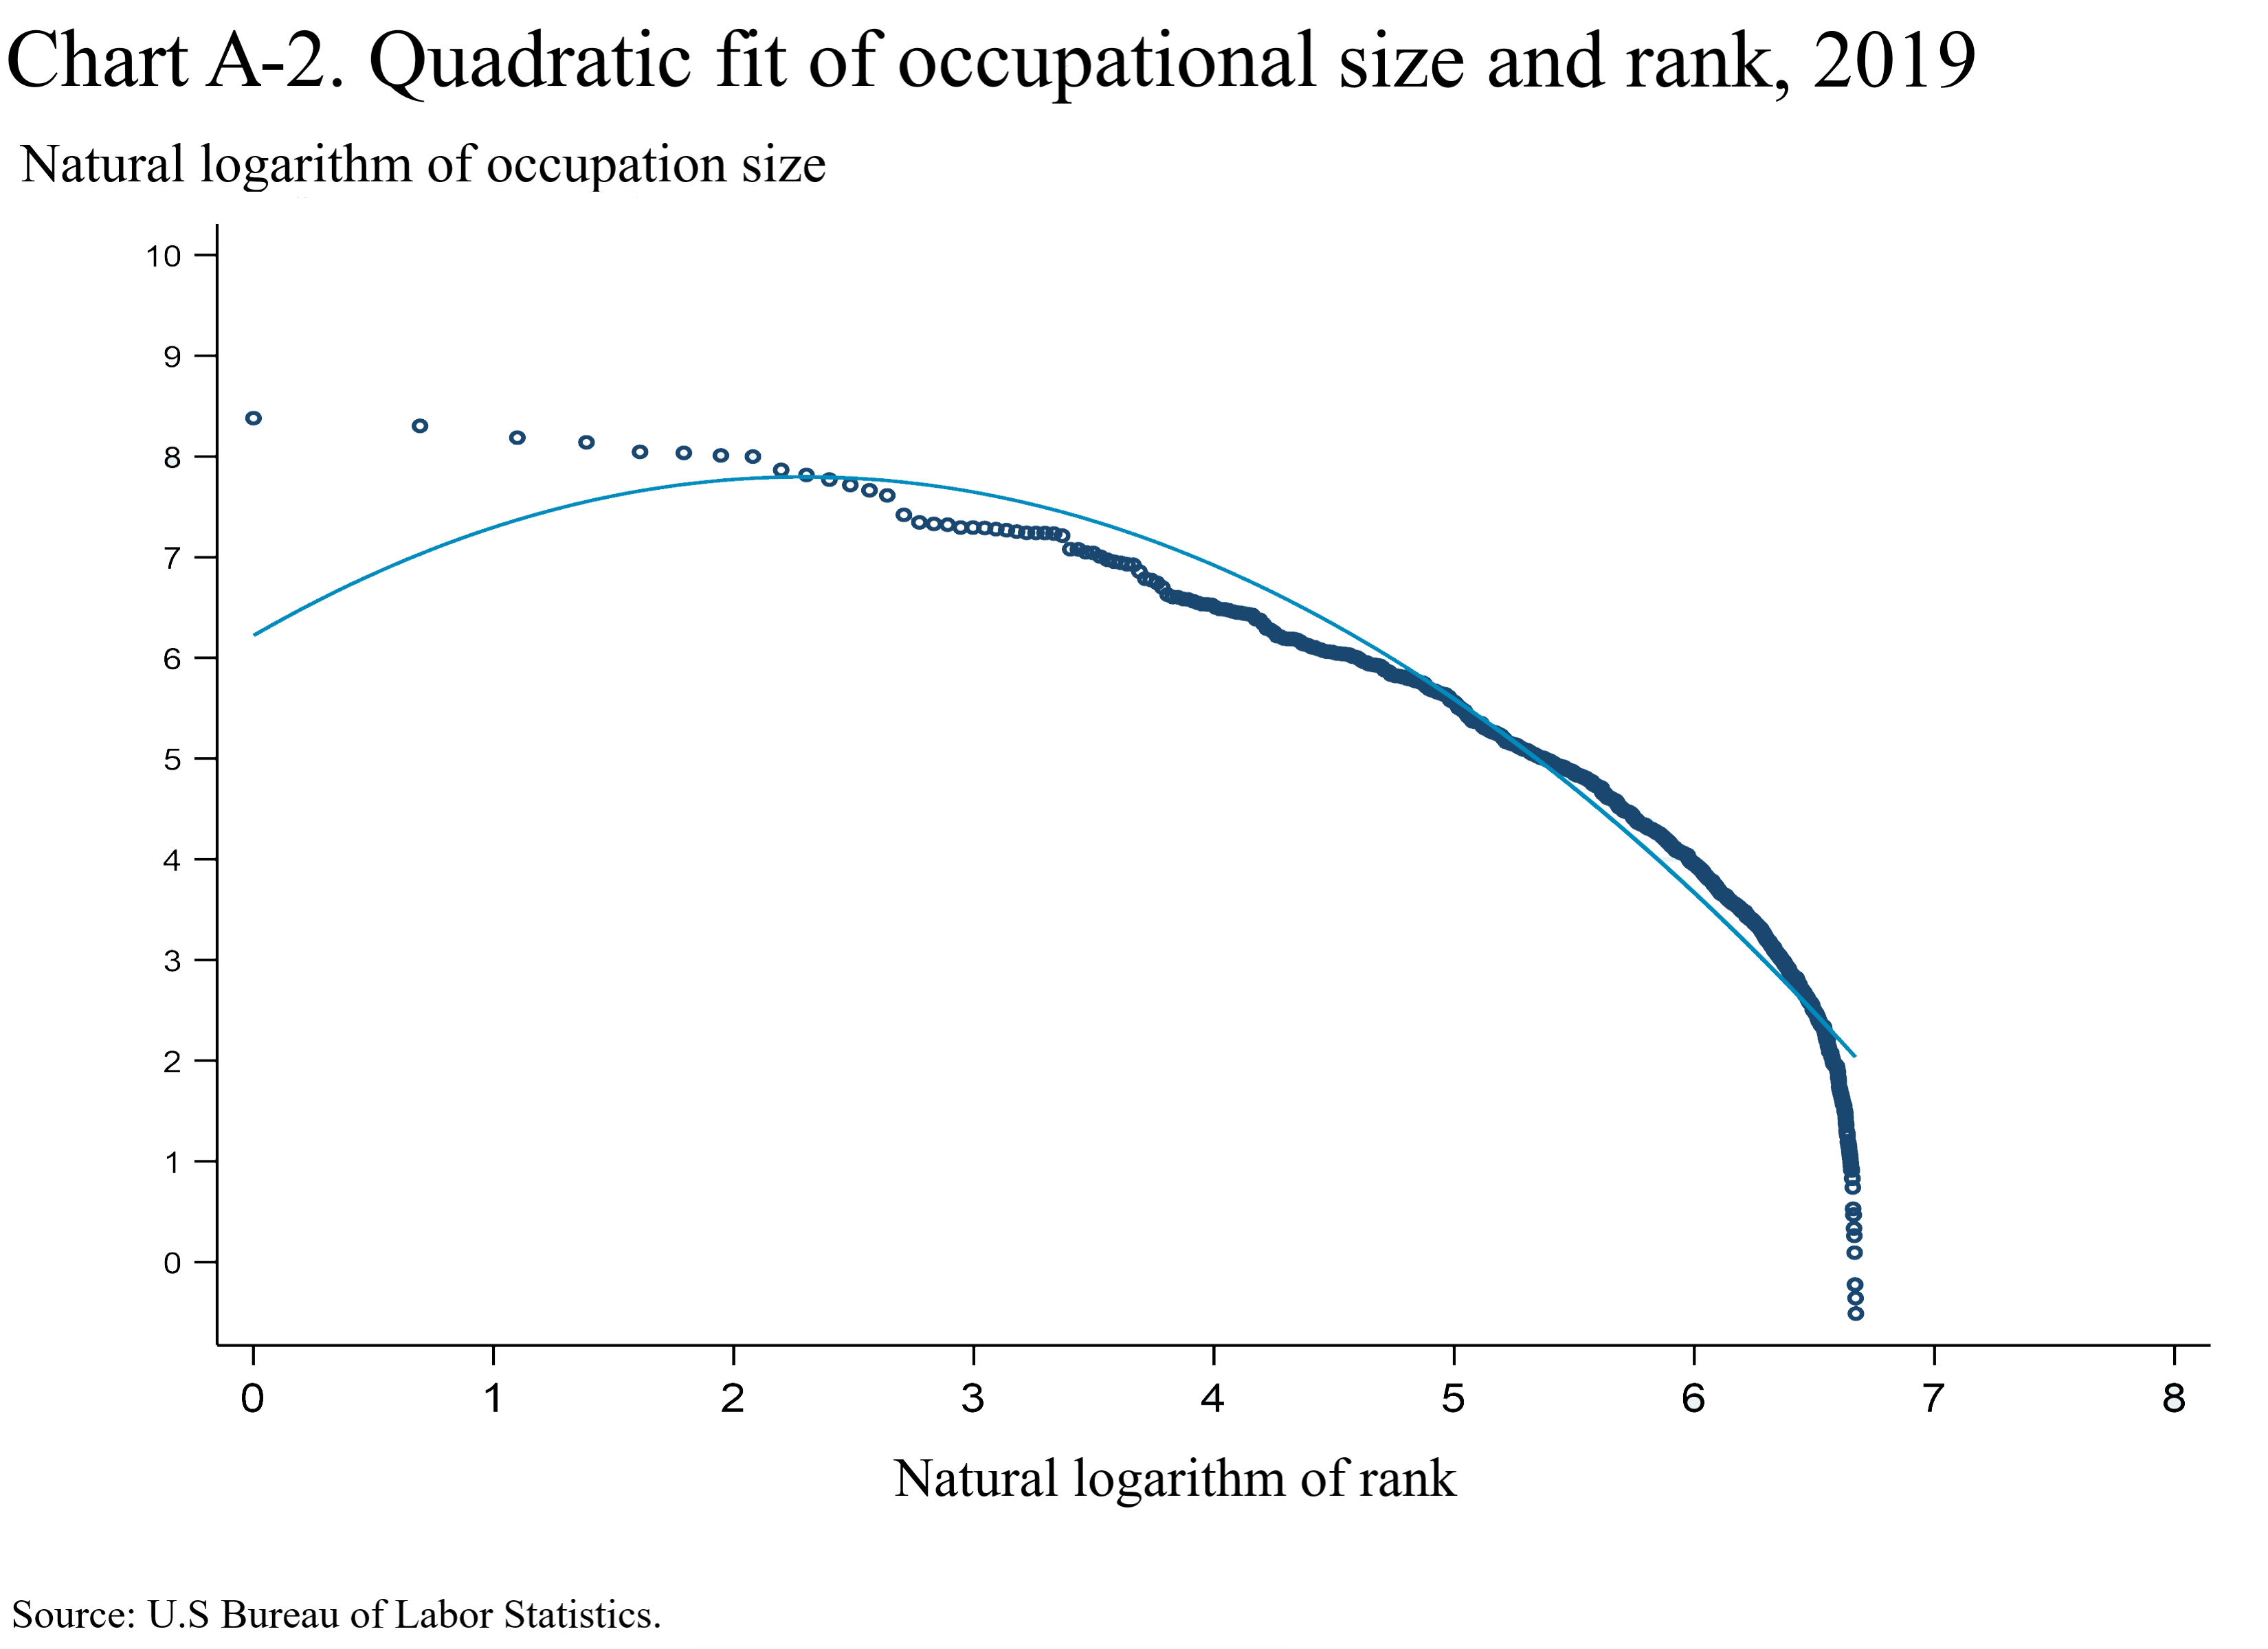
Table A-2 shows occupations at different points of the size distribution and the number of jobs and share of all jobs they represent. In addition to the 20 smallest and 20 largest occupations, the table includes twenty occupations increasing in size from the median. These figures provide another perspective on how rapidly the size of occupations drops and can serve as reference points for the discussion of automation’s possible impacts. Some of the large occupations, such as material movers, heavy truck drivers, and household and commercial cleaners, figure prominently in discussions of the increasing power of robots and AI, but others, like those related to nursing and personal care aides, do not. Occupations like retail salespersons, cashiers, and bookkeeping, accounting, and auditing clerks are somewhat more ambiguous, because they have been affected by prior waves of computing technologies, such as microcomputers, e-commerce, and self-checkout, in addition to any effects of newer technology like robots and AI.
| SOC code | Occupational title | Jobs (thousands) | Percent |
|---|---|---|---|
Twenty largest occupations | |||
41-2031 | Retail salespersons | 4,371.4 | 2.685 |
35-3023 | Fast food and counter workers | 4,047.7 | 2.486 |
41-2011 | Cashiers | 3,600.9 | 2.212 |
31-1120 | Home health and personal care aides | 3,439.7 | 2.113 |
43-9061 | Office clerks, general | 3,126.3 | 1.920 |
29-1141 | Registered nurses | 3,096.7 | 1.902 |
43-4051 | Customer service representatives | 3,018.8 | 1.854 |
53-7062 | Laborers and freight, stock, and material movers | 2,986.0 | 1.834 |
35-3031 | Waiters and waitresses | 2,613.8 | 1.606 |
11-1021 | General and operations managers | 2,486.4 | 1.527 |
37-2011 | Janitors and cleaners, except maids and housekeepers | 2,374.2 | 1.458 |
43-6014 | Secretaries and administrative assistants | 2,250.2 | 1.382 |
53-7065 | Stockers and order fillers | 2,135.8 | 1.312 |
53-3032 | Heavy and tractor-trailer truck drivers | 2,029.9 | 1.247 |
43-3031 | Bookkeeping, accounting, and auditing clerks | 1,673.6 | 1.028 |
43-1011 | First-line supervisors of office and administrative support | 1,552.4 | 0.954 |
31-1131 | Nursing assistants | 1,528.5 | 0.939 |
49-9071 | Maintenance and repair workers, general | 1,516.4 | 0.931 |
41-1011 | First-line supervisors of retail sales workers | 1,476.4 | 0.907 |
37-2012 | Maids and housekeeping cleaners | 1,474.9 | 0.906 |
| Total | 50,800 | 31.203 | |
Twenty middle-sized occupations | |||
51-7041 | Sawing machine setters, operators, and tender | 54.5 | 0.033 |
49-9062 | Medical equipment repairers | 53.9 | 0.033 |
11-1031 | Legislators | 53.7 | 0.033 |
45-1011 | First-line supervisors of farming, fishing, | 53.2 | 0.033 |
49-9012 | Control and valve installers and repairers, | 53.1 | 0.033 |
51-9012 | Separating, filtering, clarifying machine setters, operators | 53.1 | 0.033 |
47-2121 | Glaziers | 52.8 | 0.032 |
43-9022 | Word processors and typists | 52.7 | 0.032 |
11-9039 | Education administrators, all other | 52.1 | 0.032 |
27-3023 | News analysts, reporters, and journalists | 52.0 | 0.032 |
27-1023 | Floral designers | 51.8 | 0.032 |
47-5013 | Service unit operators, oil and gas | 51.7 | 0.032 |
33-9093 | Transportation security screeners | 51.4 | 0.032 |
29-1011 | Chiropractors | 51.1 | 0.031 |
31-2022 | Physical therapist aides | 50.6 | 0.031 |
31-1132 | Orderlies | 50.6 | 0.031 |
23-2099 | Legal support workers, all other | 50.4 | 0.031 |
39-2011 | Animal trainers | 50.2 | 0.031 |
29-1298 | Acupuncturists, healthcare diagnosing/treating, all other | 49.6 | 0.030 |
29-1216 | General internal medicine physicians | 49.5 | 0.030 |
| Total | 1,038.0 | 0.637 | |
Twenty smallest occupations | |||
15-2021 | Mathematicians | 2.9 | 0.00178 |
19-1011 | Animal scientists | 2.8 | 0.00172 |
41-9012 | Models | 2.7 | 0.00166 |
29-9092 | Genetic counselors | 2.6 | 0.00160 |
53-4099 | Rail transportation workers, all other | 2.5 | 0.00154 |
25-1192 | Family and consumer sciences teachers, postsecondary | 2.5 | 0.00154 |
53-5022 | Motorboat operators | 2.5 | 0.00154 |
19-2011 | Astronomers | 2.3 | 0.00141 |
33-2022 | Forest fire inspectors and prevention specialists | 2.3 | 0.00141 |
25-1043 | Forestry and conservation science teachers, postsecondary | 2.1 | 0.00129 |
17-2021 | Agricultural engineers | 1.7 | 0.00104 |
19-3092 | Geographers | 1.6 | 0.00098 |
53-7031 | Dredge operators | 1.6 | 0.00098 |
51-7031 | Model makers, wood | 1.4 | 0.00086 |
51-2061 | Timing device assemblers and adjusters | 1.3 | 0.00080 |
19-3032 | Industrial-organizational psychologists | 1.1 | 0.00068 |
13-1074 | Farm labor contractors | 0.8 | 0.00049 |
49-9045 | Refractory materials repairers, except brickmasons | 0.8 | 0.00049 |
51-7032 | Patternmakers, wood | 0.7 | 0.00043 |
29-1024 | Prosthodontists | 0.6 | 0.00037 |
| Total | 36.8 | 0.02261 | |
Note: [1] Not applicable. SOC = Standard Occupational Classification system. Number of jobs is in thousands. This table omits some occupations with larger declines over the period because of known changes in coding practices designed to address title inflation in some occupations (SOC 11-1011, chief executives and other managerial occupations; SOC 43-6011, executive secretaries/administrative assistants). Others are omitted because of presumed changes in coding practices (SOC 47-3012, helpers–carpenters; SOC 49-9098, helpers–installation, maintenance, and repair). Declines in the sizes of these occupations are not believed to reflect actual changes in the economy for the most part. Source: Source: U.S. Bureau of Labor Statistics, occupational projections file for 2019-29. | |||
Michael J. Handel, "Growth trends for selected occupations considered at risk from automation," Monthly Labor Review, U.S. Bureau of Labor Statistics, July 2022, https://doi.org/10.21916/mlr.2022.21
1 See plenary keynote presentation to the Technequality Conference (https://technequality-project.eu/files/michaelhandelprojectionspresentationbrusselsseminarpdf). For full program, see https://technequality-project.eu/files/scientificconferencetechnequality-finalprogrammlpdf and https://technequality-project.eu/news/technequality-virtual-scientific-conference-25-and-26-november-looking-back-successful-event.
2 Norbert Wiener wrote, “It is perfectly obvious that [“automatic machines”] will produce an unemployment situation, in comparison with which the present recession and even the depression of the thirties will seem a pleasant joke.” See Wiener, The human use of human beings: cybernetics and society (Boston: Houghton Mifflin, 1950), p.189. See also Gregory R. Woirol, The technological unemployment and structural unemployment debates (Westport, CT: Greenwood Press, 1996); Amy Sue Bix, Inventing ourselves out of jobs? America’s debate over technological unemployment, 1929–1981 (Baltimore: Johns Hopkins University Press, 2000); and Maxine Berg, The machinery question and the making of political economy, 1815–1848 (Cambridge University Press, 1980).
3 See Automation and technological change: hearings before the Subcommittee on Economic Stabilization of the Joint Committee on the Economic Report, Congress of the United States, 84th Congress (U.S. Government Printing Office, 1955), https://www.jec.senate.gov/public/index.cfm/1956/12/report-970887a6-35a4-47e3-9bb0-c3cdf82ec429; New views on automation: paper submitted to the Subcommittee on Automation and Energy Resources of the Joint Economic Committee, Congress of the United States, 86th Congress (U.S. Government Printing Office, 1960), https://www.jec.senate.gov/public/index.cfm/1960/12/report-8e951d10-edf7-4102-8360-b95cd4fd0c92; 20 articles on automation and employment appearing in the Monthly Labor Review between 1955 and 1960 are collected in Impact of Automation, Bulletin 1287 (U.S. Bureau of Labor Statistics, 1960); see also Report of The National Commission on Technology, Automation, and Economic Progress (U.S. Department of Health, Education, and Welfare, 1966).
4 For reviews, see Michael J. Handel, “Implications of information technology for employment, skills, and wages: a review of recent research” (Arlington, VA: SRI, 2003) and Michael J. Handel, “Implications of information technology for employment, skills, and wages: findings from sectoral and case study research” (Arlington, VA: SRI, 2004), both available at https://ideas.repec.org/f/pha1174.html.
5 David H. Autor, Frank Levy, and Richard J. Murnane, “The skill content of recent technological change: an empirical exploration,” Quarterly Journal of Economics vol. 118, issue 4, November 2003, pp. 1279–1333, https://doi.org/10.1162/003355303322552801; and Maarten Goos and Alan Manning, “Lousy and lovely jobs: the rising polarization of work in Britain,” Review of Economics and Statistics vol. 89, no. 1, February 2007, pp.118–133, https://www.jstor.org/stable/40043079.
6 During this time, artificial intelligence (AI) took widely publicized strides. AI-powered software beat the best human players of the game show Jeopardy!, demonstrating a remarkable ability to access human knowledge bases in response to natural-language queries. Another AI program beat the best human player of the dauntingly complex board game Go, a breakthrough that astonished even most experts in the AI field.
7 Sean Gerrish, How smart machines think (Cambridge, MA: MIT Press, 2018).
8 Key works on automation used in this paper include Erik Brynjolfsson and Andrew McAfee, The second machine age: work, progress, and prosperity in a time of brilliant technologies (New York: W.W. Norton & Company, 2014); Carl Benedikt Frey and Michael A. Osborne, “The future of employment: how susceptible are jobs to computerization?” Technological Forecasting and Social Change vol. 114, issue C, 2017, pp. 254–280; Martin Ford, Rise of the robots: technology and the threat of a jobless future (New York: Basic Books, 2015); and Jobs lost, jobs gained: workforce transitions in a time of automation (San Francisco, CA: McKinsey Global Institute, December 2017), https://www.mckinsey.com/~/media/mckinsey/featured%20insights/future%20of%20organizations/what%20the%20future%20of%20work%20will%20mean%20for%20jobs%20skills%20and%20wages/mgi%20jobs%20lost-jobs%20gained_report_december%202017.pdf.
9 Frey and Osborne, “The future of employment.”
10 The transformative impact of robots and automation: hearing before the Joint Economic Committee, Congress of the United States, 114th Congress (U.S. Government Printing Office, 2016), https://www.jec.senate.gov/public/index.cfm/2016/5/the-transformative-impact-of-robots-and-automation; and Workforce automation: better data needed to assess and plan for effects of advanced technologies on jobs, Report GAO-19-257 (Government Accountability Office, 2019).
11 Kevin S. Dubina, Teresa L. Morisi, Michael Rieley, and Andrea B. Wagoner, “Projections overview and highlights, 2019–29,” Monthly Labor Review, September 2020, https://www.bls.gov/opub/mlr/2020/article/projections-overview-and-highlights-2019-29.htm.
12 Scott A. Wolla “Examining the ‘lump of labor’ fallacy using a simple economic model," Page One Economics (Federal Reserve Bank of St. Louis, November 2020), https://research.stlouisfed.org/publications/page1-econ/2020/11/02/examining-the-lump-of-labor-fallacy-using-a-simple-economic-model.
13 For an example of this misunderstanding, see Olivia Solon “Self-driving trucks: what's the future for America's 3.5 million truckers?” The Guardian, June 17, 2016, https://www.theguardian.com/technology/2016/jun/17/self-driving-trucks-impact-on-drivers-jobs-us. For clarification on the diversity of jobs within this broad occupation, see Maury Gittleman and Kristen Monaco, “Truck-driving jobs: are they headed for rapid elimination?” Industrial and Labor Relations Review vol. 73, issue 1, January 2020, pp. 3–24, https://doi.org/10.1177%2F0019793919858079.
14 Gittleman and Monaco, “Truck-driving jobs: are they headed for rapid elimination?”
15 For an example, see Jobs lost, jobs gained (McKinsey Global Institute), p. 6.
16 Prior versions of Brynjolfsson and McAfee’s The second machine age and Frey and Osborne’s “The future of employment” appeared in 2011 and 2013, respectively. Both versions of Frey and Osborne’s paper use a 20-year forecast interval with 2010 as the base year. This window aligns well with the occupational data and projections for 2008–18 and 2019–29 used in this article. The 2008–18 projections are used for the previous decade because the program operated on a biennial schedule prior to 2019, so there were no projections for the period 2009–19. The base year employment for 2008–18 is also much less affected by the downturn of the Great Recession than if 2009 were the base year.
17 See Dubina, Morisi, Rieley, and Wagoner, “Projections overview and highlights.” Effects of COVID-19 on recent occupational employment are covered in a separate, companion paper (see note 1 for the presentation on that unpublished paper).
18 For further details on the Employment Projections program, see https://www.bls.gov/emp.
19 Frey and Osborne, “The future of employment.”
20 For further details on the Occupational Employment and Wage Statistics (OEWS) program, see https://www.bls.gov/oes. Note that after the data used in this article were collected, the program’s name changed to the Occupational Employment and Wage Statistics program.
21 See note 1.
22 Frey and Osborne, “The future of employment.” If an occupation shrinks at a rate of 27 percent per decade, after 10 years it will be 0.73 times the base-year value, and after 20 years it will be (0.73)2 = 0.53 times the base-year value, representing a 47-percent loss.
23 Brynjolfsson and McAfee, The second machine age; Ford, Rise of the robots; Frey and Osborne, “The future of employment”; and Jobs lost, jobs gained (McKinsey Global Institute).
24 Dubina, Morisi, Rieley, and Wagoner, “Projections overview and highlights.”
25 These key works are Brynjolfsson and McAfee, The second machine age; Ford, Rise of the robots; Frey and Osborne, “The future of employment”; and Jobs lost, jobs gained (McKinsey Global Institute).
26 See Ford, Rise of the robots, p. 103; and Frey and Osborne, “The future of employment,” p. 260.
27 All references to technological and other factors affecting staffing patterns are drawn from the U.S. Bureau of Labor Statistics projections spreadsheet file for 2019–29.
28 I thank Michael Wolf for suggesting this possible explanation.
29 T. Alan Lacey and Benjamin Wright, “Occupational employment projections to 2018,” Monthly Labor Review, December 2009, https://www.bls.gov/opub/mlr/2009/article/occupational-employment-projections-to-2018.htm.
30 Brynjolfsson and McAfee, The second machine age, p. 23; Ford, Rise of the robots, pp. 91, 121; Frey and Osborne, “The future of employment,” p. 259; and Brad Smith and Harry Shum, "The future computed: artificial intelligence and its role in society," (Redmond, WA: Microsoft Corporation, 2018), pp. 4, 41.
31 Emily Singer, "The slow rise of the robot surgeon," MIT Technology Review, March 24, 2010, https://www.technologyreview.com/2010/03/24/122356/the-slow-rise-of-the-robot-surgeon; D.T. Max, "Paging Dr. Robot," New Yorker, September 30, 2019, https://www.newyorker.com/magazine/2019/09/30/paging-dr-robot; Kyle H. Sheetz, Jake Claflin, and Justin B. Dimick, “Trends in the adoption of robotic surgery for common surgical procedures,” JAMA Network Open, January 2020, https://jamanetwork.com/journals/jamanetworkopen/fullarticle/2758472; and Cade Metz, “The robot surgeon will see you now,” The New York Times, April 30, 2021, https://www.nytimes.com/2021/04/30/technology/robot-surgery-surgeon.html.
32 Frey and Osborne, “The future of employment,” p. 260; Ford, Rise of the robots, p.154; and Jobs lost, jobs gained (McKinsey Global Institute), p. 52.
33 Naila H. Dhanani, Oscar A. Olavarria, Karla Bernardi, Nicole B. Lyons, Julie L. Holihan, Michele Loor, Alex B. Haynes, and Mike K. Liang, “The evidence behind robot-assisted abdominopelvic surgery: a systematic review,” Annals of Internal Medicine vol. 174, issue 8, August 2021, pp. 1110–1117, https://doi.org/10.7326/M20-7006.
34 Ford, Rise of the robots, p. xv; Jobs lost, jobs gained (McKinsey Global Institute), p. 24; and Darrell M. West, The future of work: robots, AI, and automation (Washington, DC: Brookings Institution Press, 2018), p. 25.
35 Katie Chockley and Ezekial Emanual, "The end of radiology? Three threats to the practice of radiology," Journal of the American College of Radiology vol. 13, issue 12A, December 2016, pp. 1415–1420, https://doi.org/10.1016/j.jacr.2016.07.010; Ken Budd, "Will artificial intelligence replace doctors?" AAMC, July 9, 2019, https://www.aamc.org/news-insights/will-artificial-intelligence-replace-doctors; and Scott J. Adams, Robert D. E. Henderson, Xin Yi, Paul Babyn, "Artificial intelligence solutions for analysis of x-ray images," Journal l'Association canadienne des radiologists vol. 72, issue 1, pp. 60–72, https://doi.org/10.1177/0846537120941671.
36 Curtis P. Langlotz, "Will artificial intelligence replace radiologists?" Radiology: Artificial Intelligence vol. 1, no. 3, May 2019, https://doi.org/10.1148/ryai.2019190058.
37 Geoffrey Hinton said, “It’s just completely obvious that within five years deep learning is going to do better than radiologists because it’s going to be able to get a lot more experience. It might be ten years…” “Geoff Hinton comments on radiology and deep learning at the 2016 Machine Learning and Market for Intelligence Conference in Toronto,” November 24, 2016, https://www.youtube.com/watch?v=2HMPRXstSvQ.
38 Chockley and Emanual, "The end of radiology?” p. 1419.
39 All numbers in charts 2 and 3 refer to radiologists whose primary activity was patient care. Values for 2000–05 are from Physician characteristics and distribution in the [U.S.] (American Medical Association, various editions). Values for 2006–19 are from the National Center for Health Workforce Analysis analysis of American Medical Association Physician Masterfile data. Values for 2009 are interpolated. Figures are totals for the following American Medical Association defined subspecialties: abdominal radiology, cardiothoracic radiology, diagnostic radiology, hospice and palliative medicine (radiology), musculoskeletal radiology, nuclear radiology, pediatric radiology, radiology, neuroradiology, radiological physics, and vascular and interventional radiology. I thank Stephen Pegula of the Health Resources and Services Administration (U.S. Department of Health and Human Services) for providing the data on radiologist employment for 2006–19.
40 The complexities of physician supply and demand: projections from 2019 to 2034 (Washington, DC: AAMC, June 2021), p. 41, https://www.aamc.org/media/54681/download.
41 Frank Levy and Max P. Rosen, “How radiologists are paid: an economic history, part IV: end of the bubble,” Journal of the American College of Radiology vol. 17, issue 9, March 2020, pp. 1080–85, https://doi.org/10.1016/j.jacr.2020.02.016.
42 Bibb Allen, Keith Dreyer, Geraldine B. McGinty, "Integrating artificial intelligence into radiologic practice: a look to the future," Journal of the American College of Radiology vol. 17, issue 2, November 2019, pp. 280–283, https://doi.org/10.1016/j.jacr.2019.10.010.
43 Ford, Rise of the robots, pp. 12ff, 210; Jobs lost, jobs gained (McKinsey Global Institute), pp. 6, 10; see also Frey and Osborne, “The future of employment,” p. 261.
44 Lisa Prevost, "For robots, it's a time to shine (and maybe disinfect)," The New York Times, August 4, 2020, https://www.nytimes.com/2020/08/04/business/robot-cleaning-coronavirus.html; and Frey and Osborne, “The future of employment,” p. 261.
45 For examples of news coverage, see Mindy Sink, “Pull up a lawn chair and watch the robot mow the grass,” The New York Times, May 18, 2000; Eric A. Taub, “The robotic lawn mower will take your call now,” The New York Times, May 8, 2008; and Ellen Rosen, “The robots are coming … to mow your lawn,” The New York Times, April 6, 2021. For examples of concerns, see Frey and Osborne, “The future of employment,” p. 261; and Jobs lost, jobs gained (McKinsey Global Institute), p. 30.
46 See Rodney Brooks, “The seven deadly sins of predicting the future of AI,” Rodney Brooks, September 17, 2017, https://rodneybrooks.com/the-seven-deadly-sins-of-predicting-the-future-of-ai. Basic technical details and costs can be found in John R. Delaney, “The best robot lawn mowers for 2022,” PCMag, March 3, 2022, https://www.pcmag.com/picks/the-best-robot-lawn-mowers.
47 See Frey and Osborne, “The future of employment,” p. 260; Jobs lost, jobs gained (McKinsey Global Institute), pp. 84, 141. For a more cautious view, see Ford, Rise of the robots, p. 190f, which, however, contrasts with Martin Ford, “Driverless trucks: economic tsunami may swallow one of most common US jobs,” The Guardian, February 16, 2017, https://www.theguardian.com/technology/2017/feb/16/self-driving-trucks-automation-jobs-trucking-industry.
48 Frey and Osborne, “The future of employment,” p. 260.
49 See Frey and Osborne, “The future of employment,” p. 262; and Jobs lost, jobs gained (McKinsey Global Institute), p.10.
50 Brynjolfsson and McAfee, The second machine age, p. 17; Jobs lost, jobs gained (McKinsey Global Institute), pp. 6, 26; and West, The future of work, p. 24.
51 Brynjolfsson and McAfee, The second machine age, p. 130; and Ford, Rise of the robots, p. 115.
52 Brynjolfsson and McAfee, The second machine age, p. 150. Note that the same source uses a different figure in a different passage on page 130, saying “tens of thousands of tax preparers now find their jobs and incomes threatened.”
53 Daniel E. Hecker, “Occupational employment projections to 2010,” Monthly Labor Review, November 2001, https://www.bls.gov/opub/mlr/2001/11/art4full.pdf.
54 Jobs in the tax preparation services industry fall under the North American Industry Classification System code 54-1213. To view the seasonality, see “Employment in tax preparation services,” The Economics Daily (U.S. Bureau of Labor Statistics, April 15, 2011), https://www.bls.gov/opub/ted/2011/ted_20110415.htm.
55 “All Employees in Private NAICS 541213 Tax preparation services for All establishment sizes in U.S. TOTAL, NSA,” series I.D.: ENUUS000105541213 (U.S. Bureau of Labor Statistics), https://data.bls.gov/cgi-bin/srgate. See also https://www.bls.gov/cew/about-data/data-availability.htm.
56 Frey and Osborne, “The future of employment,” p. 260; Ford, Rise of the robots, p. 115; and Brynjolfsson and McAfee, The second machine age, p. 191.
57 Cade Metz, “A.I. can now write its own computer code. That’s good for humans,” The New York Times, September 9, 2021, https://www.nytimes.com/2021/09/09/technology/codex-artificial-intelligence-coding.html.
58 Arin Greenwood, "Manhattan work at Mumbai prices," ABA Journal, October 1, 2007, https://www.abajournal.com/magazine/article/manhattan_work_at_mumbai_prices; Sarosh Kuruvilla and Ernesto Noronha, “From pyramids to diamonds: legal process offshoring, employment systems, and labor markets for lawyers in the United States and India,” Industrial and Labor Relations Review vol. 69, issue 2, 2016, pp. 354–377, https://doi.org/10.1177/0019793915619903.
59 Ford, Rise of the robots, p. 124; Frey and Osborne, “The future of employment,” p. 259; Jobs lost, jobs gained (McKinsey Global Institute), p. 6; and West, The future of work, p. 22.
60 Dana Remus and Frank Levy, “Can robots be lawyers? Computers, lawyers, and the practice of law,” Georgetown Journal of Legal Ethics vol. 30, issue 3, Summer 2017, pp. 501–559.
61 Brynjolfsson and McAfee, The second machine Age, p. 35.
62 Frey and Osborne, “The future of employment,” p. 265; Jobs lost, jobs gained (McKinsey Global Institute), p. 9.
63 Dubina, Morisi, Rieley, and Wagoner, “Projections overview and highlights.”
64 Frey and Osborne, “The future of employment,” pp. 259f, 265; Brynjolfsson and McAfee, The second machine age, p. 139; and Jobs lost, jobs gained (McKinsey Global Institute), p. 26.
65 Frey and Osborne, “The future of employment,” p. 262.
66 For the industrial distribution of this occupation, see https://www.bls.gov/oes/current/oes537065.htm.
67 Brynjolfsson and McAfee, The second machine age, p. 137.
68 Ford, Rise of the robots, p. 23ff.
69 Jobs lost, jobs gained (McKinsey Global Institute), p. 26.
70 Table 4 omits some occupations with larger declines over the period because of known changes in coding practices designed to address title inflation in some occupations (Standard Occupational Classification (SOC) system 11-1011, chief executives and other managerial occupations; SOC 43-6011 executive secretaries/administrative assistants). Others are omitted because of presumed changes in coding practices (SOC 47-3012, helpers–carpenters; SOC 49-9098, helpers–installation, maintenance, and repair). Declines in the sizes of these occupations are not believed to reflect actual changes in the economy for the most part.
71 Volker Nitsch, “Zipf zipped,” Journal of Urban Economics vol. 57, issue 1, 2005, p. 89, https://doi.org/10.1016/j.jue.2004.09.002.
72 Taking the natural logarithm of occupational employment reduces the skewness of the size distribution from 4.9 to 0.1 and reduces the kurtosis from 32.3 to 2.8. The Shapiro-Francia test fails to reject the null hypothesis that the distribution is lognormal (p > 0.17), as does Stata’s -sktest- command (p > 0.20), while the Shapiro-Wilk test is borderline (p > 0.09).