
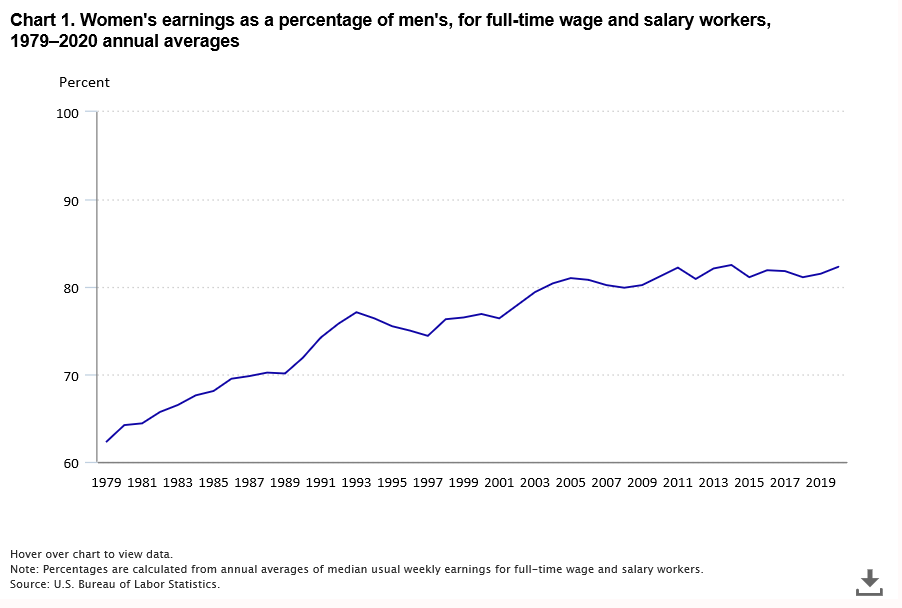
In 2020, women who were full-time wage and salary workers had median usual weekly earnings that were 82 percent of those of male full-time wage and salary workers. In 1979, the first year for which comparable earnings data are available, women’s earnings were 62 percent of men’s. Most of the growth in women’s earnings relative to men’s occurred in the 1980s (when the women’s-to-men’s ratio went from 64 percent to 70 percent) and in the 1990s (when the ratio went from 72 percent to 77 percent). Since 2004, the women’s-to-men’s earnings ratio has remained in the 80 to 83 percent range. (See chart 1 and tables 1 and 12.)
Data on median weekly earnings for 2020 reflect the impact of the coronavirus (COVID-19) pandemic on the labor market. Comparisons with data on earnings for earlier years should be interpreted with caution. Large declines in employment in 2020, particularly among low-wage workers (who were disproportionately affected by job loss related to the pandemic), resulted in changes in the median earnings distribution. This large and abrupt shift in the earnings distribution during the year manifested as an upward bump in the rate of earnings growth in 2020; however, the underlying rate of growth in workers’ median weekly earnings during the year is more difficult to discern because of the sudden, dramatic shift in the earnings distribution. More information on labor market developments in 2020 is available at www.bls.gov/covid19/effects-of-covid-19-pandemic-and-response-on-the-employment-situation-news-release.htm.
This report presents earnings data from the Current Population Survey (CPS), a national monthly sample survey of about 60,000 eligible households conducted by the U.S. Census Bureau for the U.S. Bureau of Labor Statistics (BLS). The weekly and hourly earnings estimates in this report reflect information collected from one-fourth of the households in the monthly survey and averaged for the calendar year. The data in this report are distinct from the annual earnings estimates for full-time, year-round workers collected separately in the Annual Social and Economic Supplement (ASEC) to the CPS and published by the U.S. Census Bureau. (See the BLS website for an explanation of the differences in these datasets.)
The earnings comparisons in this report are on a broad level and do not control for many factors that can be important in explaining earnings differences, such as job skills and responsibilities, work experience, and specialization. The earnings estimates referenced throughout this report are medians. The median is the midpoint in the earnings distribution, with half of workers having earnings above the median level and half having earnings below.
See the technical notes for more information, including a description of the source of the data and an explanation of the concepts and definitions used in this report.
Earnings of full-time workers
This report highlights data for women and men who usually work full time (35 hours or more per week) in wage and salary jobs, with sections focusing on characteristics, such as age, race and Hispanic or Latino ethnicity, education, occupation, and more.
Earnings by age group
In 2020, median weekly earnings were $891 for all women age 16 and older. For men age 16 and older, median weekly earnings were $1,082. Women’s median weekly earnings were highest for those between the ages of 35 to 44, with earnings of $978, and those ages 45 to 54, with earnings of $977. Women ages 55 to 64 had earnings that were slightly lower, at $955. For men, earnings were highest for 45- to 54-year-olds, with earnings of $1,260. Men ages 55 to 64 and ages 35 to 44 had earnings that were slightly lower, $1,228 and $1,205, respectively. Young women and men ages 16 to 24 had the lowest earnings ($589 and $622, respectively). (See chart 2 and table 1.)
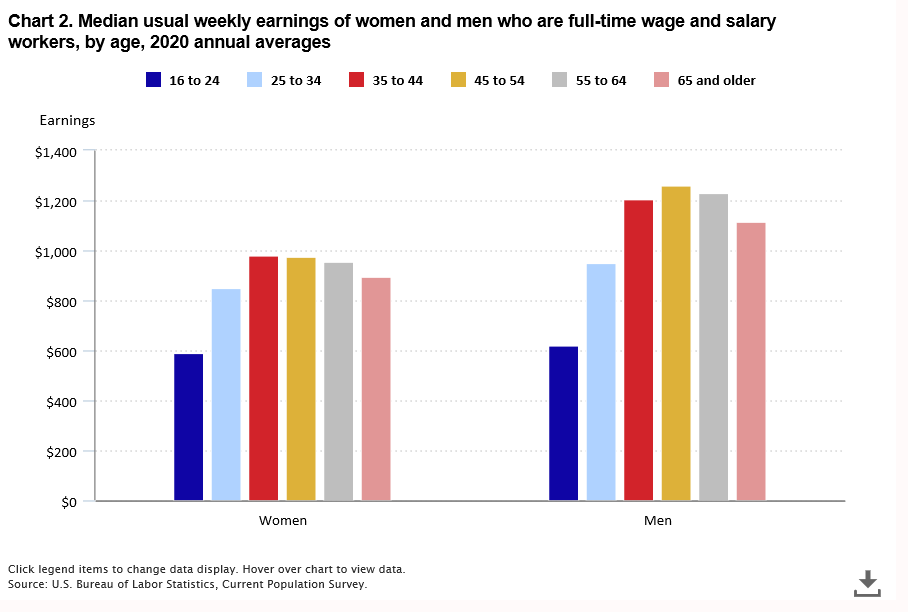
In 2020, women’s earnings ranged from 78 percent to 81 percent of men’s among workers age 35 and older. For those under age 35, the earnings differences between women and men were smaller. Women ages 25 to 34 earned 90 percent of what men did, while women ages 16 to 24 earned 95 percent of what men earned. The earnings difference between men and women has historically been smaller for those under age 35 than for those in older age groups. (See tables 1 and 12.)
Women’s-to-men’s earnings ratios have grown substantially for most age groups since 1979. For young workers ages 16 to 24, the gains occurred primarily in the 1980s. For workers ages 25 to 64, the gains continued into the 2000s, but have tapered off in recent years. (See table 12.)
Earnings by race and ethnicity
Asian women and men earned more than their White, Black, and Hispanic counterparts in 2020. Among women, Whites ($905) earned 79 percent as much as Asians ($1,143); Blacks ($764) earned 67 percent; and Hispanics ($705) earned 62 percent. Among men, these earnings differences were even larger: White men ($1,110) earned 77 percent as much as Asian men ($1,447); Black men ($830) earned 57 percent as much; and Hispanic men ($797) earned 55 percent. (See chart 3 and table 1.)
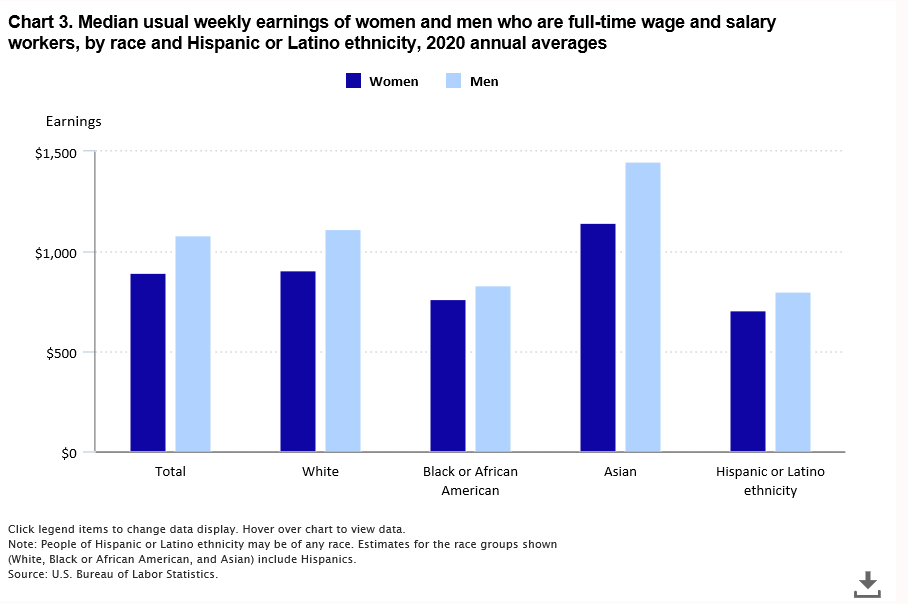
Earnings differences between women and men were largest among Asians and among Whites. Asian women earned 79 percent as much as Asian men in 2020, and White women earned 82 percent as much as White men. In comparison, Black women had median earnings that were 92 percent of Black men’s, and Hispanic women’s earnings were 89 percent of Hispanic men’s. (See table 1.)
Women’s earnings have increased considerably since 1979 (the first year for which comparable data for Whites, Blacks, and Hispanics are available), with White women experiencing the greatest earnings growth. From 1979 to 2019, inflation-adjusted median weekly earnings (also called constant-dollar earnings) increased by 39 percent for White women, by 27 percent for Black women, and by 24 percent for Hispanic women. For White and Black women, gains tapered off around 2004 and showed little net growth through 2019. By contrast, Hispanic women’s earnings remained on an upward trend, although substantial earnings growth for them did not begin until the late 1990s. Earnings of White, Black, and Hispanic women increased from 2019 to 2020, but these increases must be interpreted with caution due to the pandemic-related employment declines in 2020. These employment declines, which were most notable among lower paid workers, put upward pressure on median weekly earnings estimates. (See table 18.)
The long-term trend in men’s earnings has been quite different than that for women. Inflation-adjusted earnings for White and Black men trended down from 1979 through the first part of the 1990s, followed by a period of growth that stalled in the early 2000s. For Hispanic men, earnings also declined from 1979 through the mid-1990s, then began to trend up. From 1979 through 2019, inflation-adjusted earnings showed little change on net for White (6 percent), Black (3 percent), and Hispanic (4 percent) men. Median weekly earnings increased from 2019 to 2020 for White, Black, and Hispanic men, but these increases reflect the effects of the pandemic-related employment declines and must be interpreted with caution. (See table 18.)
Between 2000 and 2019, inflation-adjusted earnings for Asian women and men remained on an upward trend, with earnings increasing somewhat less for women than men (26 percent and 31 percent, respectively). (Data for Asians are not available prior to 2000.) Median earnings estimates for Asian men and women both increased sharply from 2019 to 2020, but again, these increases likely reflect the impact of pandemic-related employment declines on the earnings distributions. (See table 18.)
Earnings by educational attainment
Median weekly earnings vary significantly by educational attainment. Among all workers age 25 and older, the weekly earnings of those without a high school diploma ($619) were 44 percent of those with a bachelor’s degree and higher ($1,421) in 2020. For workers with a high school diploma who had not attended college, median earnings ($781) were 55 percent of those for workers with a bachelor’s degree and higher. Those with some college or an associate’s degree (median weekly earnings of $903) made 64 percent of what workers with a bachelor’s degree and higher made. (See table 1.)
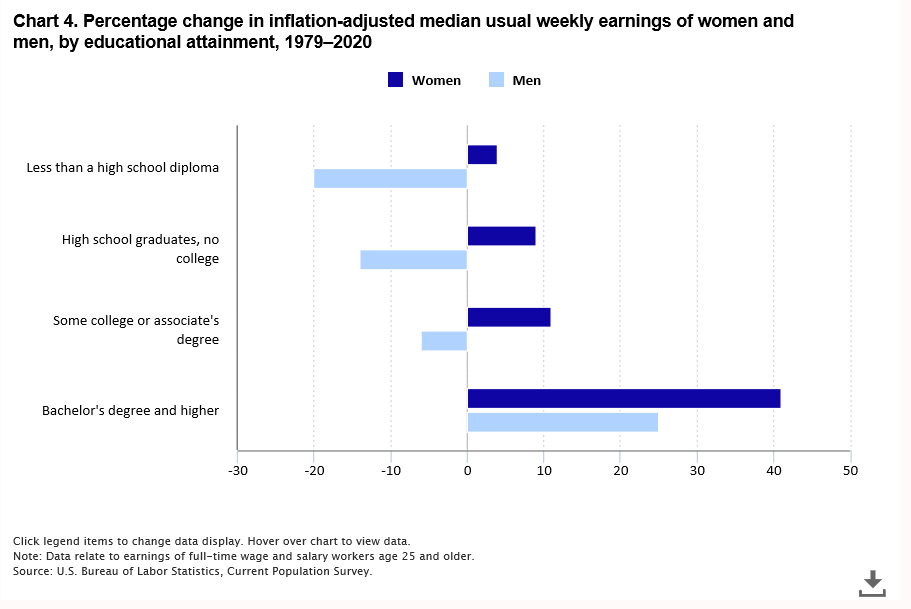
In each educational attainment category, the long-term trend in inflation-adjusted earnings has been more favorable for women than for men. The inflation-adjusted earnings of women without a high school diploma changed little (a 4-percent increase) between 1979 and 2020. By contrast, inflation-adjusted earnings for men declined by 20 percent. For those with a bachelor’s degree or higher, inflation-adjusted earnings for women have increased by 41 percent since 1979, while earnings for men have risen by 25 percent. (Data refer to workers age 25 and older.) (See chart 4 and table 19.)
Earnings by occupation
Women and men working full time in management, business, and financial operations occupations had higher median weekly earnings than workers in any other major occupational category in 2020 ($1,274 for women and $1,667 for men). Within this category, the highest earning women were chief executives ($2,051) and computer and information systems managers ($1,910). Men in these two occupation groups earned $2,712 and $2,091, respectively. (See table 2.)
The second-highest paying occupational category for women and men was professional and related occupations ($1,121 for women and $1,532 for men). This is a broad occupational category made up of several distinct job groupings for specialized fields, such as computer science and math, architecture and engineering, law, education, and healthcare. Within this diverse category, women who were pharmacists ($2,160), other physicians ($1,905), and physician assistants ($1,894) had the highest median weekly earnings in 2020. For men, those who were lawyers ($2,324), other physicians ($2,311), and pharmacists ($2,286) earned the most. (See table 2.)
Women and men employed in service occupations earned the least in 2020 ($574 for women and $704 for men). Within this category, women who were employed as fast food and counter workers ($470) and food preparation workers ($489) had the lowest median weekly earnings. For men, those who were employed as fast food and counter workers ($462) and cooks ($512) earned the least.
Occupational distributions of women and men
The occupational distributions of female and male full-time workers differ considerably. Compared with men, relatively few women work in natural resources, construction, and maintenance occupations and women are far more concentrated in office and administrative support jobs. (See chart 5 and table 2.)
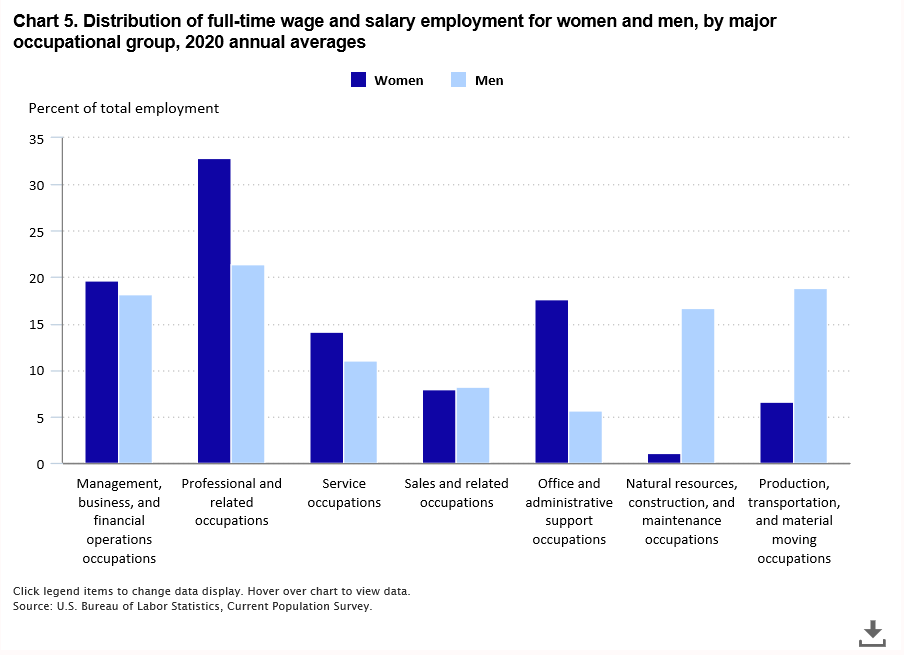
Women also are more likely than men to work in professional and related occupations. In 2020, 33 percent of women worked in professional and related occupations, compared with 21 percent of men. Within the professional category, though, the proportion of women employed in the higher paying jobs is much smaller than the proportion of men employed in them. In 2020, 11 percent of women in professional and related occupations were employed in the relatively high-paying computer (median weekly earnings of $1,423 for women and $1,738 for men) and engineering ($1,382 for women and $1,626 for men) occupations, compared with 48 percent of men. Women were over twice as likely to work in education ($1,026 for women and $1,327 for men) and healthcare ($1,153 for women and $1,506 for men) jobs, which generally pay less than computer and engineering jobs. Sixty-six percent of women in professional occupations worked in education and healthcare jobs in 2020, compared with 29 percent of men. (See table 2.)
Across all occupational categories, the three most common jobs for women were registered nurse ($1,240), elementary and middle school teacher ($1,085), and secretaries and administrative assistants ($777). Collectively, these occupations employed 6.3 million women in 2020, representing 13 percent of women in full-time wage and salary jobs.
Among men, the most common job by far was truck driver (driver/sales workers and truck drivers, $916). In 2020, 2.4 million, or 4 percent, of all male full-wage and salary workers were truck drivers. Although engineering jobs are shown separately by specialty (civil, mechanical, etc.) in this report, if combined, engineer would be the second most common job for men. In 2020, a total of 1.8 million men were employed full time in the 16 designated engineering specialties (median weekly earnings ranging from $1,595 to $1,993). (See table 2.)
Earnings for workers with and without children under 18
In 2020, about one-third of full-time wage and salary workers were parents of children under age 18. (As defined here, “children” include sons, daughters, stepchildren, and adopted children under age 18 who live in the household.) Median weekly earnings for mothers of children under age 18 ($909) were higher than the earnings for women without children under 18 ($882). Earnings for fathers of children under 18, at $1,229, were higher than the earnings of $1,005 for men without children under 18. (See table 7.)
Earnings by state of residence
Median weekly earnings and women’s-to-men’s earnings ratios vary by state of residence. (In this report, “state” refers to the 50 states and the District of Columbia.) The differences among the states reflect, in part, variation in the occupations and industries found in each state and differences in the demographic composition of each state’s labor force. Readers should note that sampling error for the state estimates is considerably larger than it is for the national estimates. (See the technical notes section for an explanation of sampling error.) Consequently, earnings comparisons between states should be made with caution. Readers also should note that the state estimates are based on workers’ state of residence; their reported earnings are not necessarily from a job located in the same state. (See table 3.)
Weekly work hours of full-time workers
Among full-time workers (that is, those usually working at a job 35 hours or more per week), men are more likely than women to work more than 40 hours per week. In 2020, 23 percent of men who usually work full time worked 41 or more hours per week, compared with 14 percent of women. Women were more likely than men to work 35 to 39 hours per week: 10 percent of women worked such hours in 2020, while 4 percent of men did. A majority of both male (73 percent) and female (76 percent) full-time workers had a 40-hour workweek. Among these workers, women earned 87 percent as much as men. (These percentages are calculated excluding people who usually work 35 or more hours per week and whose hours vary.) (See table 5.)
Earnings of part-time workers
Women are more likely than men to work part time—that is, less than 35 hours per week on a sole or main job. Women who worked part time made up 22 percent of all female wage and salary workers in 2020. In comparison, 11 percent of men in wage and salary jobs worked part time. (See tables 4 and 5.)
Median weekly earnings for female part-timers were $309 in 2020, little different than the $305 median for men. (See table 4.)
Part-time workers are more likely to be under age 25 than full-time workers. Among part-timers, 29 percent of women and 42 percent of men were under age 25 in 2020. Among full-time workers, 8 percent of women and 9 percent of men were under age 25. (See tables 1 and 4.)
Earnings of workers paid by the hour
In 2020, 58 percent of women and 54 percent of men in wage and salary jobs were paid by the hour. Women who were paid hourly rates had median hourly earnings of $15.22 in 2020, which were 86 percent of the $17.75 median for men. (See tables 8 and 11.)
Among workers who were paid hourly rates in 2020, 2 percent of women and 1 percent of men had hourly earnings at or below the prevailing federal minimum wage of $7.25. (See tables 10 and 11.) See the technical notes section for information about BLS estimates of the number of minimum wage workers.
Statistical Tables
| Table 1. Median usual weekly earnings of full-time wage and salary workers, by selected characteristics, 2020 annual averages | ||||||||||
|---|---|---|---|---|---|---|---|---|---|---|
| Characteristic | Total | Women | Men | Women's earnings as a percentage of men's | ||||||
| Number of workers (in thousands) | Median weekly earnings | Standard error of median | Number of workers (in thousands) | Median weekly earnings | Standard error of median | Number of workers (in thousands) | Median weekly earnings | Standard error of median | ||
Age | ||||||||||
Total, 16 years and older | 110,387 | $984 | $2 | 49,476 | $891 | $3 | 60,911 | $1,082 | $5 | 82.3 |
16 to 24 years | 9,364 | 606 | 3 | 4,172 | 589 | 4 | 5,191 | 622 | 4 | 94.7 |
16 to 19 years | 1,336 | 497 | 5 | 536 | 464 | 11 | 800 | 513 | 6 | 90.4 |
20 to 24 years | 8,027 | 624 | 4 | 3,636 | 606 | 4 | 4,391 | 648 | 5 | 93.5 |
25 years and older | 101,024 | 1,029 | 3 | 45,304 | 929 | 3 | 55,720 | 1,144 | 3 | 81.2 |
25 to 34 years | 27,661 | 904 | 4 | 12,375 | 852 | 6 | 15,287 | 952 | 6 | 89.5 |
35 to 44 years | 25,641 | 1,106 | 6 | 11,293 | 978 | 7 | 14,348 | 1,205 | 9 | 81.2 |
45 to 54 years | 23,814 | 1,129 | 6 | 10,853 | 977 | 7 | 12,961 | 1,260 | 9 | 77.5 |
55 to 64 years | 19,017 | 1,096 | 8 | 8,683 | 955 | 7 | 10,334 | 1,228 | 11 | 77.8 |
65 years and older | 4,890 | 999 | 11 | 2,100 | 897 | 12 | 2,790 | 1,115 | 19 | 80.4 |
Race and Hispanic or | ||||||||||
White | 85,142 | 1,003 | 3 | 37,091 | 905 | 3 | 48,051 | 1,110 | 5 | 81.5 |
Black or African American | 14,044 | 794 | 6 | 7,335 | 764 | 5 | 6,709 | 830 | 9 | 92.0 |
Asian | 7,353 | 1,310 | 21 | 3,269 | 1,143 | 14 | 4,084 | 1,447 | 20 | 79.0 |
Hispanic or Latino ethnicity | 19,558 | 758 | 4 | 7,863 | 705 | 5 | 11,695 | 797 | 5 | 88.5 |
Marital Status | ||||||||||
Never married | 33,818 | 792 | 3 | 15,119 | 765 | 4 | 18,699 | 814 | 4 | 94.0 |
Married, spouse present(1) | 60,048 | 1,133 | 3 | 24,915 | 981 | 4 | 35,132 | 1,250 | 5 | 78.5 |
Widowed, divorced, or separated(2) | 16,521 | 929 | 6 | 9,442 | 853 | 9 | 7,079 | 1,034 | 12 | 82.5 |
Widowed | 1,653 | 881 | 20 | 1,187 | 816 | 21 | 466 | 1,032 | 47 | 79.1 |
Divorced | 11,245 | 980 | 7 | 6,413 | 904 | 8 | 4,832 | 1,087 | 12 | 83.2 |
Separated(2) | 3,623 | 797 | 11 | 1,842 | 710 | 10 | 1,781 | 914 | 13 | 77.7 |
Union Affiliation(3) | ||||||||||
Members of unions(4) | 12,987 | 1,144 | 5 | 5,817 | 1,067 | 10 | 7,171 | 1,216 | 10 | 87.7 |
Represented by unions(5) | 14,486 | 1,138 | 5 | 6,529 | 1,057 | 9 | 7,957 | 1,210 | 9 | 87.4 |
Not represented by a union | 95,901 | 958 | 3 | 42,947 | 862 | 4 | 52,953 | 1,051 | 5 | 82.0 |
Educational Attainment | ||||||||||
Total, 25 years and older | 101,024 | 1,029 | 3 | 45,304 | 929 | 3 | 55,720 | 1,144 | 3 | 81.2 |
Less than a high school diploma | 5,699 | 619 | 3 | 1,829 | 525 | 6 | 3,870 | 674 | 6 | 77.9 |
High school graduates, no college | 24,153 | 781 | 3 | 9,140 | 671 | 4 | 15,013 | 881 | 5 | 76.2 |
Some college or associate degree | 25,413 | 903 | 4 | 11,677 | 779 | 4 | 13,736 | 1,027 | 7 | 75.9 |
Bachelor's degree and higher | 45,759 | 1,421 | 5 | 22,658 | 1,239 | 5 | 23,100 | 1,644 | 8 | 75.4 |
Footnotes | ||||||||||
Note: Estimates for the race groups shown (White, Black or African American, and Asian) do not sum to totals because data are not presented for all race groups. People of Hispanic or Latino ethnicity may be of any race; estimates for the race groups include Hispanics. | ||||||||||
Footnotes
(1) Beginning with data for 2020, includes people in both opposite-sex and same-sex marriages. Prior to 2020, included only people in opposite-sex marriages.
(2) Separated includes people who are married, spouse absent.
(3) Differences in earnings levels between workers with and without union affiliation reflect a variety of factors in addition to coverage by a collective bargaining agreement, including the distribution of workers by occupation, industry, and geographic region.
(4) Data refer to members of a labor union or an employee association similar to a union.
(5) Data refer to both union members and workers who report no union affiliation but whose jobs are covered by a union or an employee association contract.
Note: Estimates for the race groups shown (White, Black or African American, and Asian) do not sum to totals because data are not presented for all race groups. People of Hispanic or Latino ethnicity may be of any race; estimates for the race groups include Hispanics.
Source: U.S. Bureau of Labor Statistics.
| Table 2. Median usual weekly earnings of full-time wage and salary workers, by detailed occupation, 2020 annual averages [Numbers in thousands] | ||||||||||
|---|---|---|---|---|---|---|---|---|---|---|
| Occupation | Total | Women | Men | Women's earnings as a percentage of men's | ||||||
| Number of workers | Median weekly earnings | Standard error of median | Number of workers | Median weekly earnings | Standard error of median | Number of workers | Median weekly earnings | Standard error of median | ||
Total, full-time wage and salary workers | 110,387 | $984 | $2 | 49,476 | $891 | $3 | 60,911 | $1,082 | $5 | 82.3 |
Management, professional and related occupations | 50,023 | 1,356 | 4 | 25,933 | 1,164 | 4 | 24,090 | 1,578 | 9 | 73.8 |
Management, business, and financial operations occupations | 20,811 | 1,461 | 7 | 9,729 | 1,274 | 12 | 11,082 | 1,667 | 17 | 76.4 |
Management occupations | 13,517 | 1,541 | 9 | 5,747 | 1,347 | 12 | 7,770 | 1,737 | 16 | 77.5 |
Chief executives | 1,157 | 2,402 | 32 | 363 | 2,051 | 91 | 794 | 2,712 | 109 | 75.6 |
General and operations managers | 983 | 1,453 | 23 | 281 | 1,241 | 30 | 702 | 1,541 | 37 | 80.5 |
Legislators | 11 | - | - | 3 | - | - | 9 | - | - | - |
Advertising and promotions managers | 46 | - | - | 27 | - | - | 19 | - | - | - |
Marketing managers | 483 | 1,537 | 80 | 284 | 1,435 | 129 | 199 | 1,732 | 174 | 82.9 |
Sales managers | 495 | 1,794 | 85 | 163 | 1,411 | 64 | 332 | 1,896 | 22 | 74.4 |
Public relations and fundraising managers | 74 | 1,344 | 62 | 50 | 1,286 | 123 | 25 | - | - | - |
Administrative services managers | 62 | 1,284 | 375 | 41 | - | - | 22 | - | - | - |
Facilities managers | 122 | 1,318 | 172 | 33 | - | - | 89 | 1,389 | 83 | - |
Computer and information systems managers | 703 | 2,018 | 71 | 187 | 1,910 | 29 | 516 | 2,091 | 32 | 91.3 |
Financial managers | 1,228 | 1,492 | 48 | 624 | 1,242 | 35 | 603 | 1,880 | 30 | 66.1 |
Compensation and benefits managers | 14 | - | - | 13 | - | - | 1 | - | - | - |
Human resources managers | 264 | 1,644 | 61 | 194 | 1,599 | 79 | 70 | 1,748 | 62 | 91.5 |
Training and development managers | 47 | - | - | 20 | - | - | 27 | - | - | - |
Industrial production managers | 248 | 1,550 | 35 | 53 | 1,402 | 238 | 195 | 1,582 | 74 | 88.6 |
Purchasing managers | 221 | 1,544 | 46 | 98 | 1,441 | 73 | 123 | 1,636 | 46 | 88.1 |
Transportation, storage, and distribution managers | 266 | 972 | 36 | 55 | 943 | 37 | 212 | 989 | 48 | 95.3 |
Farmers, ranchers, and other agricultural managers | 109 | 874 | 83 | 17 | - | - | 92 | 874 | 75 | - |
Construction managers | 606 | 1,575 | 41 | 50 | 1,368 | 133 | 556 | 1,586 | 55 | 86.3 |
Education and childcare administrators | 846 | 1,462 | 25 | 560 | 1,400 | 29 | 286 | 1,590 | 57 | 88.1 |
Architectural and engineering managers | 155 | 2,413 | 358 | 15 | - | - | 140 | 2,402 | 369 | - |
Food service managers | 707 | 877 | 31 | 344 | 791 | 30 | 363 | 1,006 | 23 | 78.6 |
Funeral home managers | 6 | - | - | 3 | - | - | 4 | - | - | - |
Entertainment and recreation managers | 34 | - | - | 9 | - | - | 24 | - | - | - |
Lodging managers | 74 | 888 | 68 | 38 | - | - | 36 | - | - | - |
Medical and health services managers | 629 | 1,555 | 51 | 438 | 1,464 | 34 | 192 | 1,839 | 81 | 79.6 |
Natural sciences managers | 11 | - | - | 8 | - | - | 3 | - | - | - |
Postmasters and mail superintendents | 19 | - | - | 10 | - | - | 9 | - | - | - |
Property, real estate, and community association managers | 433 | 1,140 | 15 | 224 | 1,086 | 49 | 209 | 1,182 | 102 | 91.9 |
Social and community service managers | 330 | 1,234 | 27 | 240 | 1,163 | 24 | 90 | 1,580 | 261 | 73.6 |
Emergency management directors | 10 | - | - | 3 | - | - | 7 | - | - | - |
Personal service managers, all other | 2 | - | - | 1 | - | - | 1 | - | - | - |
Managers, all other | 3,120 | 1,564 | 23 | 1,299 | 1,379 | 22 | 1,821 | 1,749 | 20 | 78.8 |
Business and financial operations occupations | 7,294 | 1,363 | 10 | 3,982 | 1,209 | 17 | 3,312 | 1,550 | 16 | 78.0 |
Agents and business managers of artists, performers, and athletes | 27 | - | - | 15 | - | - | 12 | - | - | - |
Buyers and purchasing agents, farm products | 9 | - | - | 4 | - | - | 5 | - | - | - |
Wholesale and retail buyers, except farm products | 130 | 1,053 | 115 | 66 | 1,066 | 192 | 64 | 1,047 | 115 | 101.8 |
Purchasing agents, except wholesale, retail, and farm products | 219 | 1,231 | 46 | 113 | 1,138 | 30 | 106 | 1,387 | 87 | 82.0 |
Claims adjusters, appraisers, examiners, and investigators | 325 | 1,108 | 64 | 203 | 967 | 49 | 122 | 1,336 | 38 | 72.4 |
Compliance officers | 286 | 1,372 | 46 | 167 | 1,371 | 52 | 119 | 1,373 | 91 | 99.9 |
Cost estimators | 111 | 1,434 | 82 | 15 | - | - | 96 | 1,456 | 84 | - |
Human resources workers | 739 | 1,251 | 29 | 553 | 1,174 | 34 | 185 | 1,443 | 97 | 81.4 |
Compensation, benefits, and job analysis specialists | 67 | 1,143 | 73 | 53 | 1,041 | 47 | 14 | - | - | - |
Training and development specialists | 103 | 1,255 | 107 | 60 | 1,171 | 221 | 43 | - | - | - |
Logisticians | 134 | 1,173 | 159 | 50 | 1,140 | 42 | 84 | 1,256 | 56 | 90.8 |
Project management specialists | 644 | 1,560 | 76 | 295 | 1,468 | 38 | 350 | 1,693 | 85 | 86.7 |
Management analysts | 658 | 1,629 | 45 | 273 | 1,455 | 50 | 384 | 1,856 | 63 | 78.4 |
Meeting, convention, and event planners | 92 | 1,049 | 32 | 63 | 996 | 32 | 29 | - | - | - |
Fundraisers | 91 | 1,479 | 82 | 65 | 1,486 | 118 | 26 | - | - | - |
Market research analysts and marketing specialists | 358 | 1,326 | 127 | 212 | 1,198 | 47 | 145 | 1,608 | 70 | 74.5 |
Business operations specialists, all other | 271 | 1,273 | 112 | 144 | 1,086 | 60 | 126 | 1,540 | 58 | 70.5 |
Accountants and auditors | 1,488 | 1,298 | 46 | 893 | 1,186 | 24 | 595 | 1,520 | 34 | 78.0 |
Property appraisers and assessors | 51 | 1,225 | 136 | 19 | - | - | 32 | - | - | - |
Budget analysts | 66 | 1,461 | 31 | 32 | - | - | 33 | - | - | - |
Credit analysts | 20 | - | - | 11 | - | - | 9 | - | - | - |
Financial and investment analysts | 310 | 1,590 | 50 | 128 | 1,488 | 68 | 182 | 1,742 | 46 | 85.4 |
Personal financial advisors | 400 | 1,638 | 116 | 149 | 1,291 | 131 | 251 | 1,900 | 30 | 67.9 |
Insurance underwriters | 101 | 1,261 | 64 | 59 | 1,141 | 44 | 42 | - | - | - |
Financial examiners | 21 | - | - | 13 | - | - | 8 | - | - | - |
Credit counselors and loan officers | 391 | 1,199 | 92 | 222 | 1,013 | 29 | 169 | 1,492 | 118 | 67.9 |
Tax examiners and collectors, and revenue agents | 59 | 1,086 | 125 | 33 | - | - | 26 | - | - | - |
Tax preparers | 44 | - | - | 27 | - | - | 17 | - | - | - |
Other financial specialists | 80 | 1,328 | 197 | 43 | - | - | 37 | - | - | - |
Professional and related occupations | 29,213 | 1,270 | 6 | 16,204 | 1,121 | 5 | 13,008 | 1,532 | 9 | 73.2 |
Computer and mathematical occupations | 5,083 | 1,633 | 17 | 1,246 | 1,423 | 23 | 3,838 | 1,738 | 17 | 81.9 |
Computer and information research scientists | 39 | - | - | 9 | - | - | 30 | - | - | - |
Computer systems analysts | 529 | 1,515 | 29 | 175 | 1,413 | 53 | 353 | 1,621 | 51 | 87.2 |
Information security analysts | 125 | 2,078 | 57 | 11 | - | - | 114 | 2,082 | 27 | - |
Computer programmers | 388 | 1,653 | 42 | 82 | 1,529 | 304 | 307 | 1,673 | 77 | 91.4 |
Software developers | 1,742 | 1,920 | 33 | 322 | 1,728 | 106 | 1,420 | 2,004 | 29 | 86.2 |
Software quality assurance analysts and testers | 94 | 1,697 | 560 | 21 | - | - | 73 | 1,977 | 226 | - |
Web developers | 78 | 1,554 | 34 | 18 | - | - | 60 | 1,551 | 32 | - |
Web or digital interface designers | 52 | 1,158 | 62 | 22 | - | - | 30 | - | - | - |
Computer support specialists | 584 | 1,147 | 22 | 157 | 1,095 | 38 | 427 | 1,163 | 24 | 94.2 |
Database administrators and architects | 107 | 1,725 | 102 | 29 | - | - | 78 | 1,718 | 139 | - |
Network and computer systems administrators | 235 | 1,438 | 36 | 48 | - | - | 187 | 1,461 | 43 | - |
Computer network architects | 93 | 1,902 | 88 | 10 | - | - | 83 | 1,980 | 203 | - |
Computer occupations, all other | 716 | 1,394 | 44 | 199 | 1,161 | 35 | 517 | 1,456 | 37 | 79.7 |
Actuaries | 24 | - | - | 9 | - | - | 15 | - | - | - |
Mathematicians | 2 | - | - | 1 | - | - | 2 | - | - | - |
Operations research analysts | 154 | 1,615 | 106 | 73 | 1,460 | 58 | 81 | 1,786 | 172 | 81.7 |
Statisticians | 53 | 1,572 | 120 | 30 | - | - | 24 | - | - | - |
Other mathematical science occupations | 68 | 1,416 | 91 | 30 | - | - | 38 | - | - | - |
Architecture and engineering occupations | 2,933 | 1,575 | 21 | 467 | 1,382 | 35 | 2,466 | 1,626 | 21 | 85.0 |
Architects, except landscape and naval | 136 | 1,537 | 47 | 34 | - | - | 101 | 1,549 | 43 | - |
Landscape architects | 15 | - | - | 5 | - | - | 11 | - | - | - |
Surveyors, cartographers, and photogrammetrists | 38 | - | - | 3 | - | - | 36 | - | - | - |
Aerospace engineers | 121 | 1,939 | 150 | 14 | - | - | 107 | 1,993 | 154 | - |
Agricultural engineers | 6 | - | - | 0 | - | - | 6 | - | - | - |
Biomedical engineers | 22 | - | - | 10 | - | - | 12 | - | - | - |
Chemical engineers | 70 | 1,862 | 182 | 14 | - | - | 55 | 1,900 | 39 | - |
Civil engineers | 370 | 1,611 | 54 | 54 | 1,588 | 41 | 317 | 1,629 | 71 | 97.5 |
Computer hardware engineers | 84 | 1,889 | 41 | 18 | - | - | 66 | 1,884 | 36 | - |
Electrical and electronics engineers | 243 | 1,864 | 49 | 30 | - | - | 213 | 1,866 | 53 | - |
Environmental engineers | 26 | - | - | 11 | - | - | 15 | - | - | - |
Industrial engineers, including health and safety | 225 | 1,584 | 35 | 46 | - | - | 179 | 1,595 | 35 | - |
Marine engineers and naval architects | 18 | - | - | 0 | - | - | 18 | - | - | - |
Materials engineers | 52 | 1,586 | 86 | 10 | - | - | 42 | - | - | - |
Mechanical engineers | 348 | 1,713 | 86 | 31 | - | - | 317 | 1,736 | 29 | - |
Mining and geological engineers, including mining safety engineers | 15 | - | - | 2 | - | - | 13 | - | - | - |
Nuclear engineers | 9 | - | - | 1 | - | - | 7 | - | - | - |
Petroleum engineers | 18 | - | - | 2 | - | - | 16 | - | - | - |
Engineers, all other | 543 | 1,746 | 18 | 83 | 1,463 | 130 | 460 | 1,759 | 18 | 83.2 |
Architectural and civil drafters | 34 | - | - | 9 | - | - | 25 | - | - | - |
Other drafters | 77 | 1,126 | 61 | 16 | - | - | 60 | 1,137 | 63 | - |
Electrical and electronic engineering technologists and technicians | 81 | 1,172 | 162 | 3 | - | - | 78 | 1,198 | 76 | - |
Other engineering technologists and technicians, except drafters | 340 | 1,119 | 65 | 65 | 900 | 28 | 275 | 1,186 | 51 | 75.9 |
Surveying and mapping technicians | 43 | - | - | 6 | - | - | 38 | - | - | - |
Life, physical, and social science occupations | 1,401 | 1,336 | 32 | 666 | 1,202 | 31 | 735 | 1,450 | 33 | 82.9 |
Agricultural and food scientists | 26 | - | - | 11 | - | - | 15 | - | - | - |
Biological scientists | 72 | 1,141 | 44 | 35 | - | - | 37 | - | - | - |
Conservation scientists and foresters | 11 | - | - | 3 | - | - | 8 | - | - | - |
Medical scientists | 114 | 1,612 | 193 | 60 | 1,372 | 248 | 53 | 2,103 | 68 | 65.2 |
Life scientists, all other | 7 | - | - | 3 | - | - | 4 | - | - | - |
Astronomers and physicists | 19 | - | - | 9 | - | - | 10 | - | - | - |
Atmospheric and space scientists | 9 | - | - | 4 | - | - | 5 | - | - | - |
Chemists and materials scientists | 83 | 1,362 | 50 | 34 | - | - | 50 | 1,435 | 80 | - |
Environmental scientists and specialists, including health | 39 | - | - | 20 | - | - | 19 | - | - | - |
Geoscientists and hydrologists, except geographers | 43 | - | - | 8 | - | - | 34 | - | - | - |
Physical scientists, all other | 324 | 1,438 | 49 | 149 | 1,325 | 93 | 175 | 1,728 | 339 | 76.7 |
Economists | 26 | - | - | 11 | - | - | 15 | - | - | - |
Survey researchers | 5 | - | - | 3 | - | - | 1 | - | - | - |
Clinical and counseling psychologists | 8 | - | - | 5 | - | - | 3 | - | - | - |
School psychologists | 34 | - | - | 29 | - | - | 5 | - | - | - |
Other psychologists | 63 | 1,435 | 60 | 50 | 1,302 | 130 | 13 | - | - | - |
Sociologists | 3 | - | - | 2 | - | - | 1 | - | - | - |
Urban and regional planners | 47 | - | - | 19 | - | - | 29 | - | - | - |
Miscellaneous social scientists and related workers | 39 | - | - | 15 | - | - | 24 | - | - | - |
Agricultural and food science technicians | 38 | - | - | 15 | - | - | 24 | - | - | - |
Biological technicians | 22 | - | - | 15 | - | - | 7 | - | - | - |
Chemical technicians | 64 | 1,039 | 60 | 25 | - | - | 39 | - | - | - |
Geoscience and environmental science technicians | 18 | - | - | 6 | - | - | 13 | - | - | - |
Nuclear technicians | 6 | - | - | 0 | - | - | 6 | - | - | - |
Social science research assistants | 3 | - | - | 1 | - | - | 2 | - | - | - |
Other life, physical, and social science technicians | 202 | 1,074 | 51 | 111 | 1,047 | 35 | 90 | 1,116 | 50 | 93.8 |
Occupational health and safety specialists and technicians | 77 | 1,444 | 122 | 24 | - | - | 53 | 1,423 | 51 | - |
Community and social service occupations | 2,187 | 1,003 | 12 | 1,484 | 976 | 15 | 703 | 1,103 | 35 | 88.5 |
Substance abuse and behavioral disorder counselors | 99 | 950 | 49 | 82 | 966 | 45 | 17 | - | - | - |
Educational, guidance, and career counselors and advisors | 294 | 1,080 | 41 | 222 | 1,061 | 58 | 72 | 1,133 | 41 | 93.6 |
Marriage and family therapists | 22 | - | - | 19 | - | - | 3 | - | - | - |
Mental health counselors | 86 | 1,066 | 41 | 65 | 1,089 | 55 | 21 | - | - | - |
Rehabilitation counselors | 24 | - | - | 13 | - | - | 11 | - | - | - |
Counselors, all other | 132 | 956 | 56 | 85 | 947 | 46 | 47 | - | - | - |
Child, family, and school social workers | 58 | 894 | 24 | 51 | 894 | 22 | 7 | - | - | - |
Healthcare social workers | 70 | 1,152 | 27 | 61 | 1,139 | 26 | 9 | - | - | - |
Mental health and substance abuse social workers | 19 | - | - | 17 | - | - | 2 | - | - | - |
Social workers, all other | 593 | 985 | 21 | 509 | 972 | 26 | 84 | 1,170 | 66 | 83.1 |
Probation officers and correctional treatment specialists | 111 | 1,058 | 33 | 58 | 977 | 86 | 53 | 1,203 | 54 | 81.2 |
Social and human service assistants | 168 | 841 | 74 | 133 | 803 | 36 | 35 | - | - | - |
Other community and social service specialists | 83 | 1,034 | 74 | 62 | 1,045 | 76 | 22 | - | - | - |
Clergy | 353 | 1,055 | 63 | 61 | 858 | 114 | 292 | 1,131 | 32 | 75.9 |
Directors, religious activities and education | 36 | - | - | 22 | - | - | 14 | - | - | - |
Religious workers, all other | 38 | - | - | 24 | - | - | 14 | - | - | - |
Legal occupations | 1,410 | 1,540 | 24 | 812 | 1,252 | 37 | 599 | 2,275 | 98 | 55.0 |
Lawyers | 821 | 2,097 | 133 | 351 | 1,665 | 104 | 470 | 2,324 | 79 | 71.6 |
Judicial law clerks | 15 | - | - | 11 | - | - | 4 | - | - | - |
Judges, magistrates, and other judicial workers | 60 | 1,856 | 594 | 34 | - | - | 26 | - | - | - |
Paralegals and legal assistants | 343 | 942 | 22 | 295 | 918 | 23 | 48 | - | - | - |
Title examiners, abstractors, and searchers | 101 | 1,136 | 55 | 76 | 989 | 95 | 25 | - | - | - |
Legal support workers, all other | 71 | 1,042 | 57 | 46 | - | - | 25 | - | - | - |
Education, training, and library occupations | 7,012 | 1,096 | 9 | 5,142 | 1,026 | 9 | 1,870 | 1,327 | 24 | 77.3 |
Postsecondary teachers | 891 | 1,516 | 37 | 448 | 1,384 | 29 | 443 | 1,633 | 48 | 84.8 |
Preschool and kindergarten teachers | 412 | 721 | 27 | 411 | 721 | 26 | 2 | - | - | - |
Elementary and middle school teachers | 3,064 | 1,118 | 10 | 2,430 | 1,085 | 11 | 634 | 1,258 | 19 | 86.2 |
Secondary school teachers | 914 | 1,199 | 22 | 530 | 1,149 | 17 | 383 | 1,319 | 54 | 87.1 |
Special education teachers | 301 | 1,044 | 21 | 244 | 1,036 | 22 | 58 | 1,102 | 188 | 94.0 |
Tutors | 42 | - | - | 31 | - | - | 11 | - | - | - |
Other teachers and instructors | 376 | 1,061 | 40 | 231 | 942 | 30 | 145 | 1,314 | 132 | 71.7 |
Archivists, curators, and museum technicians | 46 | - | - | 27 | - | - | 19 | - | - | - |
Librarians and media collections specialists | 120 | 1,073 | 122 | 100 | 1,127 | 56 | 19 | - | - | - |
Library technicians | 17 | - | - | 14 | - | - | 2 | - | - | - |
Teacher assistants | 714 | 617 | 12 | 591 | 604 | 11 | 123 | 732 | 40 | 82.5 |
Other educational instruction and library workers | 116 | 1,145 | 68 | 85 | 1,108 | 97 | 31 | - | - | - |
Arts, design, entertainment, sports, and media occupations | 1,681 | 1,179 | 25 | 804 | 1,128 | 25 | 877 | 1,252 | 21 | 90.1 |
Artists and related workers | 87 | 1,116 | 67 | 28 | - | - | 59 | 1,152 | 55 | - |
Commercial and industrial designers | 6 | - | - | 3 | - | - | 3 | - | - | - |
Fashion designers | 24 | - | - | 16 | - | - | 7 | - | - | - |
Floral designers | 38 | - | - | 27 | - | - | 11 | - | - | - |
Graphic designers | 209 | 1,230 | 31 | 119 | 1,140 | 35 | 91 | 1,395 | 223 | 81.7 |
Interior designers | 74 | 1,107 | 53 | 55 | 1,021 | 235 | 19 | - | - | - |
Merchandise displayers and window trimmers | 22 | - | - | 12 | - | - | 10 | - | - | - |
Other designers | 271 | 1,210 | 66 | 101 | 1,107 | 154 | 170 | 1,234 | 69 | 89.7 |
Actors | 10 | - | - | 5 | - | - | 6 | - | - | - |
Producers and directors | 123 | 1,499 | 135 | 60 | 1,548 | 168 | 63 | 1,458 | 48 | 106.2 |
Athletes and sports competitors | 21 | - | - | 2 | - | - | 19 | - | - | - |
Coaches and scouts | 90 | 931 | 49 | 36 | - | - | 54 | 946 | 80 | - |
Umpires, referees, and other sports officials | 9 | - | - | 1 | - | - | 9 | - | - | - |
Dancers and choreographers | 4 | - | - | 4 | - | - | 0 | - | - | - |
Music directors and composers | 16 | - | - | 3 | - | - | 13 | - | - | - |
Musicians and singers | 12 | - | - | 2 | - | - | 10 | - | - | - |
Disc jockeys, except radio disc jockeys | 1 | - | - | 0 | - | - | 1 | - | - | - |
Entertainers and performers, sports and related workers, all other | 7 | - | - | 3 | - | - | 5 | - | - | - |
Broadcast announcers and radio disc jockeys | 18 | - | - | 2 | - | - | 16 | - | - | - |
News analysts, reporters, and journalists | 62 | 1,044 | 144 | 34 | - | - | 29 | - | - | - |
Public relations specialists | 128 | 1,553 | 40 | 80 | 1,452 | 275 | 48 | - | - | - |
Editors | 57 | 1,237 | 40 | 29 | - | - | 28 | - | - | - |
Technical writers | 53 | 1,347 | 115 | 26 | - | - | 28 | - | - | - |
Writers and authors | 98 | 1,257 | 61 | 64 | 1,127 | 77 | 35 | - | - | - |
Interpreters and translators | 44 | - | - | 25 | - | - | 18 | - | - | - |
Court reporters and simultaneous captioners | 21 | - | - | 18 | - | - | 3 | - | - | - |
Media and communication workers, all other | 14 | - | - | 6 | - | - | 8 | - | - | - |
Broadcast, sound, and lighting technicians | 53 | 1,001 | 42 | 6 | - | - | 47 | - | - | - |
Photographers | 66 | 990 | 38 | 30 | - | - | 36 | - | - | - |
Television, video, and film camera operators and editors | 40 | - | - | 10 | - | - | 30 | - | - | - |
Media and communication equipment workers, all other | 3 | - | - | 0 | - | - | 3 | - | - | - |
Healthcare practitioners and technical occupations | 7,504 | 1,227 | 10 | 5,584 | 1,153 | 7 | 1,921 | 1,506 | 29 | 76.6 |
Chiropractors | 9 | - | - | 2 | - | - | 8 | - | - | - |
Dentists | 58 | 2,079 | 130 | 18 | - | - | 41 | - | - | - |
Dietitians and nutritionists | 83 | 1,009 | 61 | 77 | 1,019 | 55 | 5 | - | - | - |
Optometrists | 21 | - | - | 10 | - | - | 11 | - | - | - |
Pharmacists | 241 | 2,222 | 90 | 134 | 2,160 | 142 | 108 | 2,286 | 36 | 94.5 |
Emergency medicine physicians | 10 | - | - | 2 | - | - | 8 | - | - | - |
Radiologists | 20 | - | - | 5 | - | - | 15 | - | - | - |
Other physicians | 752 | 2,102 | 238 | 313 | 1,905 | 43 | 439 | 2,311 | 134 | 82.4 |
Surgeons | 48 | - | - | 16 | - | - | 32 | - | - | - |
Physician assistants | 113 | 1,911 | 48 | 67 | 1,894 | 69 | 47 | - | - | - |
Podiatrists | 5 | - | - | 1 | - | - | 4 | - | - | - |
Audiologists | 13 | - | - | 12 | - | - | 1 | - | - | - |
Occupational therapists | 96 | 1,373 | 37 | 85 | 1,357 | 32 | 11 | - | - | - |
Physical therapists | 209 | 1,468 | 60 | 135 | 1,451 | 31 | 74 | 1,591 | 109 | 91.2 |
Radiation therapists | 11 | - | - | 3 | - | - | 8 | - | - | - |
Recreational therapists | 11 | - | - | 7 | - | - | 3 | - | - | - |
Respiratory therapists | 100 | 1,162 | 62 | 71 | 1,093 | 35 | 29 | - | - | - |
Speech-language pathologists | 152 | 1,297 | 45 | 143 | 1,272 | 35 | 8 | - | - | - |
Exercise physiologists | 5 | - | - | 4 | - | - | 0 | - | - | - |
Therapists, all other | 159 | 1,043 | 49 | 130 | 986 | 54 | 29 | - | - | - |
Veterinarians | 55 | 1,795 | 163 | 36 | - | - | 19 | - | - | - |
Registered nurses | 2,701 | 1,262 | 13 | 2,337 | 1,240 | 13 | 364 | 1,454 | 41 | 85.3 |
Nurse anesthetists | 30 | - | - | 16 | - | - | 15 | - | - | - |
Nurse midwives | 7 | - | - | 7 | - | - | 0 | - | - | - |
Nurse practitioners | 171 | 1,872 | 67 | 145 | 1,867 | 51 | 26 | - | - | - |
Acupuncturists | 7 | - | - | 3 | - | - | 4 | - | - | - |
Health diagnosing and treating practitioners, all other | 1 | - | - | 1 | - | - | 0 | - | - | - |
Clinical laboratory technologists and technicians | 289 | 1,028 | 57 | 211 | 946 | 36 | 78 | 1,195 | 75 | 79.2 |
Dental hygienists | 96 | 1,125 | 63 | 89 | 1,083 | 89 | 7 | - | - | - |
Cardiovascular technologists and technicians | 37 | - | - | 25 | - | - | 12 | - | - | - |
Diagnostic medical sonographers | 73 | 1,227 | 87 | 61 | 1,208 | 127 | 12 | - | - | - |
Radiologic technologists and technicians | 222 | 1,103 | 29 | 145 | 1,063 | 37 | 77 | 1,234 | 42 | 86.1 |
Magnetic resonance imaging technologists | 45 | - | - | 21 | - | - | 24 | - | - | - |
Nuclear medicine technologists and medical dosimetrists | 39 | - | - | 18 | - | - | 21 | - | - | - |
Emergency medical technicians | 134 | 844 | 33 | 44 | - | - | 90 | 936 | 148 | - |
Paramedics | 65 | 1,163 | 53 | 23 | - | - | 43 | - | - | - |
Pharmacy technicians | 257 | 723 | 19 | 199 | 700 | 19 | 58 | 814 | 59 | 86.0 |
Psychiatric technicians | 53 | 658 | 72 | 48 | - | - | 5 | - | - | - |
Surgical technologists | 74 | 875 | 36 | 49 | - | - | 25 | - | - | - |
Veterinary technologists and technicians | 73 | 655 | 43 | 65 | 633 | 39 | 8 | - | - | - |
Dietetic technicians and ophthalmic medical technicians | 44 | - | - | 34 | - | - | 10 | - | - | - |
Licensed practical and licensed vocational nurses | 500 | 875 | 26 | 445 | 864 | 24 | 55 | 964 | 34 | 89.6 |
Medical records specialists | 166 | 888 | 30 | 162 | 893 | 29 | 4 | - | - | - |
Opticians, dispensing | 32 | - | - | 27 | - | - | 4 | - | - | - |
Miscellaneous health technologists and technicians | 143 | 888 | 28 | 93 | 825 | 37 | 51 | 1,120 | 112 | 73.7 |
Other healthcare practitioners and technical occupations | 73 | 1,254 | 42 | 43 | - | - | 30 | - | - | - |
Service occupations | 13,771 | 621 | 3 | 7,032 | 574 | 4 | 6,740 | 704 | 5 | 81.5 |
Healthcare support occupations | 3,210 | 606 | 4 | 2,678 | 600 | 4 | 532 | 640 | 15 | 93.8 |
Home health aides | 310 | 549 | 14 | 283 | 551 | 14 | 27 | - | - | - |
Personal care aides | 788 | 543 | 12 | 612 | 537 | 12 | 176 | 567 | 26 | 94.7 |
Nursing assistants | 966 | 595 | 8 | 851 | 588 | 7 | 115 | 689 | 28 | 85.3 |
Orderlies and psychiatric aides | 57 | 663 | 72 | 30 | - | - | 27 | - | - | - |
Occupational therapy assistants and aides | 26 | - | - | 21 | - | - | 5 | - | - | - |
Physical therapist assistants and aides | 58 | 964 | 30 | 37 | - | - | 21 | - | - | - |
Massage therapists | 38 | - | - | 25 | - | - | 14 | - | - | - |
Dental assistants | 204 | 661 | 18 | 193 | 663 | 19 | 11 | - | - | - |
Medical assistants | 450 | 675 | 14 | 407 | 665 | 17 | 44 | - | - | - |
Medical transcriptionists | 29 | - | - | 24 | - | - | 4 | - | - | - |
Pharmacy aides | 32 | - | - | 21 | - | - | 11 | - | - | - |
Veterinary assistants and laboratory animal caretakers | 42 | - | - | 31 | - | - | 12 | - | - | - |
Phlebotomists | 86 | 614 | 19 | 70 | 612 | 19 | 15 | - | - | - |
Other healthcare support workers | 124 | 682 | 28 | 73 | 615 | 18 | 51 | 738 | 24 | 83.3 |
Protective service occupations | 2,690 | 982 | 12 | 610 | 768 | 21 | 2,080 | 1,043 | 23 | 73.6 |
First-line supervisors of correctional officers | 51 | 976 | 98 | 16 | - | - | 34 | - | - | - |
First-line supervisors of police and detectives | 92 | 1,551 | 63 | 11 | - | - | 80 | 1,553 | 59 | - |
First-line supervisors of fire fighting and prevention workers | 34 | - | - | 4 | - | - | 30 | - | - | - |
First-line supervisors of security workers | 67 | 946 | 116 | 24 | - | - | 44 | - | - | - |
First-line supervisors of protective service workers, all other | 8 | - | - | 0 | - | - | 8 | - | - | - |
Firefighters | 320 | 1,233 | 38 | 16 | - | - | 304 | 1,256 | 33 | - |
Fire inspectors | 21 | - | - | 1 | - | - | 20 | - | - | - |
Bailiffs | 11 | - | - | 5 | - | - | 5 | - | - | - |
Correctional officers and jailers | 337 | 907 | 27 | 112 | 743 | 25 | 225 | 1,073 | 73 | 69.2 |
Detectives and criminal investigators | 146 | 1,437 | 57 | 39 | - | - | 107 | 1,544 | 53 | - |
Fish and game wardens | 5 | - | - | 1 | - | - | 4 | - | - | - |
Parking enforcement workers | 7 | - | - | 2 | - | - | 5 | - | - | - |
Police officers | 742 | 1,155 | 21 | 131 | 1,074 | 46 | 611 | 1,188 | 54 | 90.4 |
Animal control workers | 9 | - | - | 3 | - | - | 7 | - | - | - |
Private detectives and investigators | 72 | 979 | 40 | 35 | - | - | 38 | - | - | - |
Security guards and gaming surveillance officers | 673 | 650 | 13 | 170 | 583 | 13 | 503 | 680 | 12 | 85.7 |
Crossing guards and flaggers | 17 | - | - | 7 | - | - | 10 | - | - | - |
Transportation security screeners | 40 | - | - | 16 | - | - | 24 | - | - | - |
School bus monitors | 0 | - | - | 0 | - | - | 0 | - | - | - |
Other protective service workers | 37 | - | - | 15 | - | - | 22 | - | - | - |
Food preparation and serving related occupations | 3,353 | 530 | 6 | 1,653 | 506 | 5 | 1,700 | 570 | 9 | 88.8 |
Chefs and head cooks | 321 | 696 | 26 | 57 | 613 | 18 | 263 | 707 | 27 | 86.7 |
First-line supervisors of food preparation and serving workers | 335 | 602 | 17 | 198 | 583 | 19 | 137 | 636 | 28 | 91.7 |
Cooks | 1,026 | 510 | 6 | 416 | 505 | 11 | 610 | 512 | 6 | 98.6 |
Food preparation workers | 355 | 510 | 9 | 224 | 489 | 10 | 132 | 576 | 26 | 84.9 |
Bartenders | 169 | 648 | 55 | 70 | 585 | 26 | 99 | 708 | 31 | 82.6 |
Fast food and counter workers | 231 | 468 | 19 | 146 | 470 | 19 | 84 | 462 | 48 | 101.7 |
Waiters and waitresses | 600 | 514 | 10 | 388 | 497 | 14 | 212 | 563 | 50 | 88.3 |
Food servers, nonrestaurant | 85 | 531 | 39 | 60 | 513 | 23 | 25 | - | - | - |
Dining room and cafeteria attendants and bartender helpers | 99 | 508 | 15 | 48 | - | - | 50 | 545 | 55 | - |
Dishwashers | 83 | 528 | 38 | 9 | - | - | 74 | 567 | 45 | - |
Hosts and hostesses, restaurant, lounge, and coffee shop | 46 | - | - | 36 | - | - | 10 | - | - | - |
Food preparation and serving related workers, all other | 4 | - | - | 1 | - | - | 3 | - | - | - |
Building and grounds cleaning and maintenance occupations | 3,138 | 603 | 4 | 1,087 | 511 | 5 | 2,051 | 651 | 8 | 78.5 |
First-line supervisors of housekeeping and janitorial workers | 171 | 738 | 26 | 64 | 596 | 37 | 107 | 902 | 71 | 66.1 |
First-line supervisors of landscaping, lawn service, and groundskeeping workers | 108 | 786 | 28 | 6 | - | - | 102 | 785 | 31 | - |
Janitors and building cleaners | 1,372 | 614 | 7 | 447 | 522 | 9 | 925 | 662 | 11 | 78.9 |
Maids and housekeeping cleaners | 629 | 503 | 6 | 531 | 497 | 6 | 98 | 556 | 20 | 89.4 |
Pest control workers | 90 | 749 | 35 | 3 | - | - | 87 | 747 | 35 | - |
Landscaping and groundskeeping workers | 665 | 605 | 8 | 30 | - | - | 635 | 603 | 8 | - |
Tree trimmers and pruners | 82 | 666 | 34 | 5 | - | - | 77 | 684 | 42 | - |
Other grounds maintenance workers | 21 | - | - | 1 | - | - | 20 | - | - | - |
Personal care and service occupations | 1,380 | 616 | 8 | 1,004 | 591 | 8 | 376 | 740 | 24 | 79.9 |
Supervisors of personal care and service workers | 96 | 761 | 40 | 60 | 719 | 95 | 35 | - | - | - |
Animal trainers | 34 | - | - | 22 | - | - | 12 | - | - | - |
Animal caretakers | 108 | 626 | 21 | 86 | 591 | 28 | 22 | - | - | - |
Gambling services workers | 53 | 765 | 76 | 26 | - | - | 27 | - | - | - |
Ushers, lobby attendants, and ticket takers | 3 | - | - | 1 | - | - | 1 | - | - | - |
Other entertainment attendants and related workers | 47 | - | - | 15 | - | - | 31 | - | - | - |
Embalmers, crematory operators and funeral attendants | 8 | - | - | 2 | - | - | 7 | - | - | - |
Morticians, undertakers, and funeral arrangers | 10 | - | - | 2 | - | - | 8 | - | - | - |
Barbers | 49 | - | - | 11 | - | - | 39 | - | - | - |
Hairdressers, hairstylists, and cosmetologists | 205 | 606 | 19 | 180 | 601 | 22 | 24 | - | - | - |
Manicurists and pedicurists | 110 | 607 | 27 | 84 | 578 | 28 | 26 | - | - | - |
Skincare specialists | 23 | - | - | 20 | - | - | 3 | - | - | - |
Other personal appearance workers | 5 | - | - | 5 | - | - | 0 | - | - | - |
Baggage porters, bellhops, and concierges | 44 | - | - | 16 | - | - | 28 | - | - | - |
Tour and travel guides | 16 | - | - | 3 | - | - | 13 | - | - | - |
Childcare workers | 383 | 537 | 26 | 358 | 542 | 24 | 25 | - | - | - |
Exercise trainers and group fitness instructors | 53 | 618 | 64 | 33 | - | - | 20 | - | - | - |
Recreation workers | 80 | 715 | 39 | 51 | 658 | 78 | 29 | - | - | - |
Residential advisors | 17 | - | - | 7 | - | - | 10 | - | - | - |
Personal care and service workers, all other | 37 | - | - | 22 | - | - | 14 | - | - | - |
Sales and office occupations | 21,165 | 809 | 4 | 12,729 | 746 | 4 | 8,435 | 956 | 8 | 78.0 |
Sales and related occupations | 8,958 | 880 | 10 | 3,967 | 715 | 8 | 4,991 | 1,046 | 17 | 68.4 |
First-line supervisors of retail sales workers | 2,141 | 858 | 16 | 960 | 733 | 14 | 1,181 | 981 | 22 | 74.7 |
First-line supervisors of non-retail sales workers | 783 | 1,226 | 40 | 273 | 1,076 | 71 | 510 | 1,338 | 56 | 80.4 |
Cashiers | 1,088 | 507 | 7 | 805 | 501 | 7 | 284 | 524 | 17 | 95.6 |
Counter and rental clerks | 48 | - | - | 21 | - | - | 27 | - | - | - |
Parts salespersons | 97 | 741 | 46 | 20 | - | - | 77 | 756 | 53 | - |
Retail salespersons | 1,603 | 705 | 13 | 611 | 603 | 12 | 992 | 779 | 21 | 77.4 |
Advertising sales agents | 120 | 1,066 | 89 | 69 | 1,055 | 72 | 50 | 1,199 | 171 | 88.0 |
Insurance sales agents | 469 | 931 | 31 | 242 | 825 | 37 | 226 | 1,169 | 145 | 70.6 |
Securities, commodities, and financial services sales agents | 200 | 1,545 | 135 | 41 | - | - | 158 | 1,880 | 87 | - |
Travel agents | 30 | - | - | 23 | - | - | 7 | - | - | - |
Sales representatives of services, except advertising, insurance, travel, and financial services | 497 | 1,351 | 59 | 163 | 1,101 | 78 | 333 | 1,482 | 44 | 74.3 |
Sales representatives, wholesale and manufacturing | 1,073 | 1,275 | 64 | 315 | 1,065 | 60 | 758 | 1,378 | 49 | 77.3 |
Models, demonstrators, and product promoters | 6 | - | - | 3 | - | - | 3 | - | - | - |
Real estate brokers and sales agents | 498 | 1,084 | 79 | 283 | 937 | 42 | 215 | 1,352 | 40 | 69.3 |
Sales engineers | 37 | - | - | 5 | - | - | 32 | - | - | - |
Telemarketers | 28 | - | - | 15 | - | - | 13 | - | - | - |
Door-to-door sales workers, news and street vendors, and related workers | 34 | - | - | 12 | - | - | 23 | - | - | - |
Sales and related workers, all other | 206 | 950 | 30 | 106 | 838 | 38 | 100 | 1,039 | 262 | 80.7 |
Office and administrative support occupations | 12,207 | 781 | 4 | 8,762 | 756 | 4 | 3,445 | 868 | 10 | 87.1 |
First-line supervisors of office and administrative support workers | 1,129 | 966 | 12 | 734 | 925 | 14 | 395 | 1,145 | 27 | 80.8 |
Switchboard operators, including answering service | 8 | - | - | 7 | - | - | 1 | - | - | - |
Telephone operators | 19 | - | - | 14 | - | - | 6 | - | - | - |
Communications equipment operators, all other | 8 | - | - | 3 | - | - | 6 | - | - | - |
Bill and account collectors | 96 | 758 | 19 | 69 | 744 | 29 | 27 | - | - | - |
Billing and posting clerks | 379 | 749 | 15 | 339 | 736 | 15 | 40 | - | - | - |
Bookkeeping, accounting, and auditing clerks | 741 | 824 | 16 | 636 | 809 | 13 | 105 | 1,101 | 44 | 73.5 |
Gambling cage workers | 11 | - | - | 6 | - | - | 5 | - | - | - |
Payroll and timekeeping clerks | 129 | 945 | 93 | 111 | 921 | 59 | 18 | - | - | - |
Procurement clerks | 27 | - | - | 16 | - | - | 11 | - | - | - |
Tellers | 225 | 639 | 23 | 183 | 634 | 25 | 42 | - | - | - |
Financial clerks, all other | 90 | 1,039 | 53 | 58 | 903 | 32 | 31 | - | - | - |
Brokerage clerks | 4 | - | - | 3 | - | - | 2 | - | - | - |
Correspondence clerks | 3 | - | - | 3 | - | - | 0 | - | - | - |
Court, municipal, and license clerks | 73 | 777 | 75 | 65 | 764 | 44 | 8 | - | - | - |
Credit authorizers, checkers, and clerks | 41 | - | - | 28 | - | - | 13 | - | - | - |
Customer service representatives | 1,814 | 721 | 8 | 1,160 | 698 | 9 | 655 | 771 | 17 | 90.5 |
Eligibility interviewers, government programs | 71 | 898 | 42 | 54 | 824 | 127 | 17 | - | - | - |
File Clerks | 138 | 751 | 30 | 106 | 744 | 32 | 32 | - | - | - |
Hotel, motel, and resort desk clerks | 60 | 534 | 69 | 50 | 520 | 26 | 10 | - | - | - |
Interviewers, except eligibility and loan | 155 | 711 | 25 | 123 | 710 | 27 | 33 | - | - | - |
Library assistants, clerical | 25 | - | - | 19 | - | - | 6 | - | - | - |
Loan interviewers and clerks | 135 | 911 | 69 | 103 | 874 | 59 | 32 | - | - | - |
New accounts clerks | 22 | - | - | 14 | - | - | 8 | - | - | - |
Order clerks | 75 | 704 | 40 | 39 | - | - | 36 | - | - | - |
Human resources assistants, except payroll and timekeeping | 44 | - | - | 38 | - | - | 6 | - | - | - |
Receptionists and information clerks | 846 | 642 | 9 | 738 | 636 | 9 | 108 | 688 | 24 | 92.4 |
Reservation and transportation ticket agents and travel clerks | 81 | 879 | 80 | 44 | - | - | 37 | - | - | - |
Information and record clerks, all other | 81 | 915 | 55 | 57 | 830 | 67 | 24 | - | - | - |
Cargo and freight agents | 16 | - | - | 7 | - | - | 9 | - | - | - |
Couriers and messengers | 340 | 779 | 26 | 55 | 701 | 19 | 284 | 814 | 26 | 86.1 |
Public safety telecommunicators | 102 | 858 | 63 | 60 | 799 | 53 | 42 | - | - | - |
Dispatchers, except police, fire, and ambulance | 178 | 768 | 37 | 95 | 717 | 29 | 84 | 908 | 123 | 79.0 |
Meter readers, utilities | 18 | - | - | 1 | - | - | 17 | - | - | - |
Postal service clerks | 80 | 1,010 | 39 | 45 | - | - | 35 | - | - | - |
Postal service mail carriers | 290 | 1,017 | 38 | 104 | 962 | 25 | 185 | 1,089 | 73 | 88.3 |
Postal service mail sorters, processors, and processing machine operators | 60 | 977 | 56 | 26 | - | - | 34 | - | - | - |
Production, planning, and expediting clerks | 243 | 1,072 | 64 | 125 | 908 | 35 | 118 | 1,227 | 68 | 74.0 |
Shipping, receiving, and inventory clerks | 505 | 696 | 13 | 165 | 667 | 16 | 340 | 713 | 16 | 93.5 |
Weighers, measurers, checkers, and samplers, recordkeeping | 53 | 729 | 102 | 23 | - | - | 30 | - | - | - |
Executive secretaries and executive administrative assistants | 170 | 991 | 44 | 158 | 991 | 41 | 12 | - | - | - |
Legal secretaries and administrative assistants | 54 | 914 | 41 | 42 | - | - | 12 | - | - | - |
Medical secretaries and administrative assistants | 63 | 804 | 33 | 59 | 800 | 31 | 4 | - | - | - |
Secretaries and administrative assistants, except legal, medical, and executive | 1,607 | 781 | 10 | 1,496 | 777 | 9 | 112 | 929 | 106 | 83.6 |
Data entry keyers | 180 | 710 | 16 | 128 | 700 | 13 | 51 | 803 | 31 | 87.2 |
Word processors and typists | 32 | - | - | 26 | - | - | 6 | - | - | - |
Desktop publishers | 0 | - | - | 0 | - | - | 0 | - | - | - |
Insurance claims and policy processing clerks | 221 | 760 | 19 | 184 | 759 | 16 | 37 | - | - | - |
Mail clerks and mail machine operators, except postal service | 35 | - | - | 17 | - | - | 19 | - | - | - |
Office clerks, general | 912 | 736 | 10 | 759 | 726 | 11 | 153 | 790 | 41 | 91.9 |
Office machine operators, except computer | 12 | - | - | 9 | - | - | 4 | - | - | - |
Proofreaders and copy markers | 4 | - | - | 2 | - | - | 2 | - | - | - |
Statistical assistants | 66 | 1,272 | 368 | 27 | - | - | 39 | - | - | - |
Office and administrative support workers, all other | 437 | 867 | 19 | 330 | 875 | 23 | 107 | 836 | 43 | 104.7 |
Natural resources, construction, and maintenance occupations | 10,690 | 905 | 6 | 538 | 682 | 17 | 10,152 | 917 | 6 | 74.4 |
Farming, fishing, and forestry occupations | 787 | 589 | 9 | 187 | 528 | 17 | 600 | 608 | 11 | 86.8 |
First-line supervisors of farming, fishing, and forestry workers | 43 | - | - | 5 | - | - | 39 | - | - | - |
Agricultural inspectors | 14 | - | - | 8 | - | - | 6 | - | - | - |
Animal breeders | 0 | - | - | 0 | - | - | 0 | - | - | - |
Graders and sorters, agricultural products | 41 | - | - | 30 | - | - | 11 | - | - | - |
Miscellaneous agricultural workers | 628 | 574 | 9 | 137 | 519 | 11 | 491 | 589 | 11 | 88.1 |
Fishing and hunting workers | 14 | - | - | 0 | - | - | 14 | - | - | - |
Forest and conservation workers | 17 | - | - | 7 | - | - | 10 | - | - | - |
Logging workers | 29 | - | - | 0 | - | - | 29 | - | - | - |
Construction and extraction occupations | 5,826 | 906 | 7 | 191 | 796 | 26 | 5,635 | 910 | 8 | 87.5 |
First-line supervisors of construction trades and extraction workers | 596 | 1,200 | 22 | 17 | - | - | 579 | 1,199 | 23 | - |
Boilermakers | 14 | - | - | 0 | - | - | 14 | - | - | - |
Brickmasons, blockmasons, and stonemasons | 87 | 749 | 38 | 0 | - | - | 87 | 749 | 38 | - |
Carpenters | 756 | 892 | 18 | 17 | - | - | 739 | 889 | 18 | - |
Carpet, floor, and tile installers and finishers | 117 | 770 | 38 | 4 | - | - | 113 | 785 | 45 | - |
Cement masons, concrete finishers, and terrazzo workers | 54 | 782 | 27 | 2 | - | - | 52 | 787 | 26 | - |
Construction laborers | 1,343 | 783 | 12 | 39 | - | - | 1,304 | 788 | 13 | - |
Construction equipment operators | 328 | 979 | 31 | 10 | - | - | 317 | 980 | 30 | - |
Drywall installers, ceiling tile installers, and tapers | 131 | 784 | 14 | 8 | - | - | 123 | 787 | 16 | - |
Electricians | 735 | 1,024 | 32 | 22 | - | - | 713 | 1,035 | 37 | - |
Glaziers | 43 | - | - | 2 | - | - | 41 | - | - | - |
Insulation workers | 49 | - | - | 2 | - | - | 47 | - | - | - |
Painters and paperhangers | 316 | 691 | 14 | 26 | - | - | 290 | 695 | 14 | - |
Pipelayers | 41 | - | - | 1 | - | - | 39 | - | - | - |
Plumbers, pipefitters, and steamfitters | 444 | 1,002 | 17 | 8 | - | - | 436 | 1,004 | 18 | - |
Plasterers and stucco masons | 24 | - | - | 0 | - | - | 24 | - | - | - |
Reinforcing iron and rebar workers | 3 | - | - | 0 | - | - | 3 | - | - | - |
Roofers | 146 | 732 | 34 | 1 | - | - | 145 | 729 | 32 | - |
Sheet metal workers | 103 | 905 | 64 | 4 | - | - | 99 | 905 | 63 | - |
Structural iron and steel workers | 38 | - | - | 1 | - | - | 36 | - | - | - |
Solar photovoltaic installers | 18 | - | - | 0 | - | - | 18 | - | - | - |
Helpers, construction trades | 48 | - | - | 2 | - | - | 46 | - | - | - |
Construction and building inspectors | 73 | 1,119 | 32 | 11 | - | - | 62 | 1,113 | 29 | - |
Elevator installers and repairers | 17 | - | - | 0 | - | - | 17 | - | - | - |
Fence erectors | 27 | - | - | 0 | - | - | 27 | - | - | - |
Hazardous materials removal workers | 26 | - | - | 4 | - | - | 22 | - | - | - |
Highway maintenance workers | 89 | 846 | 37 | 6 | - | - | 83 | 868 | 38 | - |
Rail-track laying and maintenance equipment operators | 5 | - | - | 0 | - | - | 5 | - | - | - |
Septic tank servicers and sewer pipe cleaners | 4 | - | - | 0 | - | - | 4 | - | - | - |
Miscellaneous construction and related workers | 22 | - | - | 0 | - | - | 22 | - | - | - |
Derrick, rotary drill, and service unit operators, oil and gas | 16 | - | - | 0 | - | - | 16 | - | - | - |
Excavating and loading machine and dragline operators, surface mining | 6 | - | - | 0 | - | - | 6 | - | - | - |
Earth drillers, except oil and gas | 19 | - | - | 1 | - | - | 18 | - | - | - |
Explosives workers, ordnance handling experts, and blasters | 6 | - | - | 0 | - | - | 6 | - | - | - |
Underground mining machine operators | 35 | - | - | 2 | - | - | 33 | - | - | - |
Roustabouts, oil and gas | 7 | - | - | 0 | - | - | 7 | - | - | - |
Other extraction workers | 40 | - | - | 0 | - | - | 40 | - | - | - |
Installation, maintenance, and repair occupations | 4,077 | 984 | 7 | 160 | 801 | 18 | 3,917 | 991 | 7 | 80.8 |
First-line supervisors of mechanics, installers, and repairers | 212 | 1,269 | 63 | 21 | - | - | 191 | 1,283 | 50 | - |
Computer, automated teller, and office machine repairers | 142 | 960 | 36 | 15 | - | - | 127 | 965 | 40 | - |
Radio and telecommunications equipment installers and repairers | 125 | 1,192 | 115 | 8 | - | - | 116 | 1,242 | 75 | - |
Avionics technicians | 8 | - | - | 0 | - | - | 8 | - | - | - |
Electric motor, power tool, and related repairers | 15 | - | - | 0 | - | - | 14 | - | - | - |
Electrical and electronics installers and repairers, transportation equipment | 3 | - | - | 0 | - | - | 3 | - | - | - |
Electrical and electronics repairers, industrial and utility | 9 | - | - | 0 | - | - | 9 | - | - | - |
Electronic equipment installers and repairers, motor vehicles | 4 | - | - | 0 | - | - | 4 | - | - | - |
Electronic home entertainment equipment installers and repairers | 23 | - | - | 1 | - | - | 22 | - | - | - |
Security and fire alarm systems installers | 50 | 1,028 | 74 | 0 | - | - | 50 | 1,028 | 74 | - |
Aircraft mechanics and service technicians | 151 | 1,164 | 33 | 5 | - | - | 146 | 1,174 | 49 | - |
Automotive body and related repairers | 102 | 904 | 274 | 2 | - | - | 100 | 975 | 224 | - |
Automotive glass installers and repairers | 12 | - | - | 3 | - | - | 10 | - | - | - |
Automotive service technicians and mechanics | 585 | 855 | 31 | 4 | - | - | 581 | 857 | 31 | - |
Bus and truck mechanics and diesel engine specialists | 312 | 1,023 | 29 | 6 | - | - | 306 | 1,023 | 31 | - |
Heavy vehicle and mobile equipment service technicians and mechanics | 179 | 999 | 23 | 1 | - | - | 178 | 998 | 23 | - |
Small engine mechanics | 36 | - | - | 0 | - | - | 36 | - | - | - |
Miscellaneous vehicle and mobile equipment mechanics, installers, and repairers | 72 | 665 | 36 | 1 | - | - | 71 | 668 | 35 | - |
Control and valve installers and repairers | 25 | - | - | 1 | - | - | 24 | - | - | - |
Heating, air conditioning, and refrigeration mechanics and installers | 382 | 1,003 | 29 | 6 | - | - | 377 | 1,011 | 29 | - |
Home appliance repairers | 24 | - | - | 1 | - | - | 22 | - | - | - |
Industrial and refractory machinery mechanics | 401 | 1,031 | 25 | 23 | - | - | 377 | 1,049 | 24 | - |
Maintenance and repair workers, general | 550 | 895 | 17 | 24 | - | - | 526 | 897 | 17 | - |
Maintenance workers, machinery | 22 | - | - | 0 | - | - | 22 | - | - | - |
Millwrights | 62 | 1,178 | 42 | 1 | - | - | 61 | 1,185 | 38 | - |
Electrical power-line installers and repairers | 139 | 1,268 | 156 | 2 | - | - | 136 | 1,306 | 167 | - |
Telecommunications line installers and repairers | 155 | 1,031 | 131 | 9 | - | - | 146 | 1,076 | 140 | - |
Precision instrument and equipment repairers | 62 | 1,085 | 58 | 11 | - | - | 52 | 1,098 | 53 | - |
Wind turbine service technicians | 5 | - | - | 1 | - | - | 4 | - | - | - |
Coin, vending, and amusement machine servicers and repairers | 27 | - | - | 6 | - | - | 22 | - | - | - |
Commercial divers | 3 | - | - | 0 | - | - | 3 | - | - | - |
Locksmiths and safe repairers | 19 | - | - | 0 | - | - | 19 | - | - | - |
Manufactured building and mobile home installers | 3 | - | - | 0 | - | - | 3 | - | - | - |
Riggers | 6 | - | - | 0 | - | - | 6 | - | - | - |
Helpers--installation, maintenance, and repair workers | 16 | - | - | 2 | - | - | 14 | - | - | - |
Other installation, maintenance, and repair workers | 139 | 780 | 49 | 8 | - | - | 131 | 810 | 69 | - |
Production, transportation, and material moving occupations | 14,738 | 746 | 4 | 3,243 | 614 | 4 | 11,494 | 796 | 4 | 77.1 |
Production occupations | 6,820 | 775 | 5 | 1,765 | 630 | 8 | 5,055 | 841 | 7 | 74.9 |
First-line supervisors of production and operating workers | 713 | 1,038 | 36 | 122 | 816 | 70 | 591 | 1,099 | 26 | 74.2 |
Aircraft structure, surfaces, rigging, and systems assemblers | 3 | - | - | 1 | - | - | 2 | - | - | - |
Electrical, electronics, and electromechanical assemblers | 90 | 640 | 103 | 37 | - | - | 53 | 742 | 29 | - |
Engine and other machine assemblers | 3 | - | - | 0 | - | - | 3 | - | - | - |
Structural metal fabricators and fitters | 17 | - | - | 0 | - | - | 17 | - | - | - |
Other assemblers and fabricators | 828 | 705 | 10 | 263 | 638 | 21 | 565 | 740 | 15 | 86.2 |
Bakers | 131 | 596 | 16 | 78 | 584 | 17 | 53 | 621 | 212 | 94.0 |
Butchers and other meat, poultry, and fish processing workers | 221 | 733 | 14 | 57 | 642 | 32 | 163 | 754 | 15 | 85.1 |
Food and tobacco roasting, baking, and drying machine operators and tenders | 8 | - | - | 1 | - | - | 7 | - | - | - |
Food batchmakers | 70 | 649 | 31 | 38 | - | - | 32 | - | - | - |
Food cooking machine operators and tenders | 7 | - | - | 5 | - | - | 2 | - | - | - |
Food processing workers, all other | 118 | 669 | 30 | 44 | - | - | 74 | 743 | 36 | - |
Computer numerically controlled tool programmers and operators | 96 | 964 | 38 | 6 | - | - | 89 | 974 | 38 | - |
Forming machine setters, operators, and tenders, metal and plastic | 24 | - | - | 1 | - | - | 23 | - | - | - |
Cutting, punching, and press machine setters, operators, and tenders, metal and plastic | 69 | 821 | 39 | 11 | - | - | 58 | 843 | 24 | - |
Grinding, lapping, polishing, and buffing machine tool setters, operators, and tenders, metal and plastic | 35 | - | - | 6 | - | - | 29 | - | - | - |
Other machine tool setters, operators, and tenders, metal and plastic | 8 | - | - | 2 | - | - | 6 | - | - | - |
Machinists | 297 | 923 | 20 | 25 | - | - | 272 | 940 | 23 | - |
Metal furnace operators, tenders, pourers, and casters | 19 | - | - | 0 | - | - | 19 | - | - | - |
Model makers and patternmakers, metal and plastic | 9 | - | - | 2 | - | - | 7 | - | - | - |
Molders and molding machine setters, operators, and tenders, metal and plastic | 37 | - | - | 5 | - | - | 31 | - | - | - |
Tool and die makers | 37 | - | - | 1 | - | - | 36 | - | - | - |
Welding, soldering, and brazing workers | 486 | 839 | 17 | 16 | - | - | 471 | 848 | 17 | - |
Other metal workers and plastic workers | 338 | 770 | 24 | 61 | 622 | 41 | 277 | 816 | 33 | 76.2 |
Prepress technicians and workers | 12 | - | - | 3 | - | - | 10 | - | - | - |
Printing press operators | 120 | 748 | 30 | 25 | - | - | 95 | 757 | 29 | - |
Print binding and finishing workers | 16 | - | - | 7 | - | - | 9 | - | - | - |
Laundry and dry-cleaning workers | 94 | 538 | 41 | 60 | 522 | 34 | 34 | - | - | - |
Pressers, textile, garment, and related materials | 23 | - | - | 15 | - | - | 7 | - | - | - |
Sewing machine operators | 97 | 579 | 17 | 59 | 584 | 16 | 37 | - | - | - |
Shoe and leather workers | 6 | - | - | 3 | - | - | 2 | - | - | - |
Tailors, dressmakers, and sewers | 31 | - | - | 26 | - | - | 5 | - | - | - |
Textile machine setters, operators, and tenders | 15 | - | - | 10 | - | - | 5 | - | - | - |
Upholsterers | 20 | - | - | 2 | - | - | 18 | - | - | - |
Other textile, apparel, and furnishings workers | 12 | - | - | 2 | - | - | 9 | - | - | - |
Cabinetmakers and bench carpenters | 31 | - | - | 1 | - | - | 29 | - | - | - |
Furniture finishers | 9 | - | - | 6 | - | - | 3 | - | - | - |
Sawing machine setters, operators, and tenders, wood | 20 | - | - | 3 | - | - | 16 | - | - | - |
Woodworking machine setters, operators, and tenders, except sawing | 9 | - | - | 1 | - | - | 9 | - | - | - |
Other woodworkers | 12 | - | - | 0 | - | - | 12 | - | - | - |
Power plant operators, distributors, and dispatchers | 38 | - | - | 1 | - | - | 37 | - | - | - |
Stationary engineers and boiler operators | 45 | - | - | 5 | - | - | 40 | - | - | - |
Water and wastewater treatment plant and system operators | 116 | 955 | 80 | 12 | - | - | 104 | 990 | 71 | - |
Miscellaneous plant and system operators | 42 | - | - | 4 | - | - | 38 | - | - | - |
Chemical processing machine setters, operators, and tenders | 50 | 1,083 | 36 | 3 | - | - | 47 | - | - | - |
Crushing, grinding, polishing, mixing, and blending workers | 79 | 766 | 25 | 17 | - | - | 61 | 788 | 59 | - |
Cutting workers | 54 | 692 | 50 | 14 | - | - | 40 | - | - | - |
Extruding, forming, pressing, and compacting machine setters, operators, and tenders | 22 | - | - | 7 | - | - | 15 | - | - | - |
Furnace, kiln, oven, drier, and kettle operators and tenders | 10 | - | - | 0 | - | - | 10 | - | - | - |
Inspectors, testers, sorters, samplers, and weighers | 684 | 814 | 19 | 266 | 710 | 12 | 418 | 910 | 25 | 78.0 |
Jewelers and precious stone and metal workers | 22 | - | - | 10 | - | - | 12 | - | - | - |
Dental and ophthalmic laboratory technicians and medical appliance technicians | 59 | 694 | 67 | 36 | - | - | 23 | - | - | - |
Packaging and filling machine operators and tenders | 224 | 620 | 26 | 98 | 544 | 32 | 126 | 667 | 27 | 81.6 |
Painting workers | 139 | 849 | 44 | 15 | - | - | 124 | 879 | 37 | - |
Photographic process workers and processing machine operators | 3 | - | - | 2 | - | - | 1 | - | - | - |
Adhesive bonding machine operators and tenders | 8 | - | - | 2 | - | - | 6 | - | - | - |
Etchers and engravers | 3 | - | - | 0 | - | - | 3 | - | - | - |
Molders, shapers, and casters, except metal and plastic | 19 | - | - | 2 | - | - | 17 | - | - | - |
Paper goods machine setters, operators, and tenders | 22 | - | - | 4 | - | - | 18 | - | - | - |
Tire builders | 0 | - | - | 0 | - | - | 0 | - | - | - |
Helpers--production workers | 31 | - | - | 9 | - | - | 23 | - | - | - |
Other production equipment operators and tenders | 5 | - | - | 0 | - | - | 5 | - | - | - |
Other production workers | 957 | 739 | 15 | 251 | 637 | 13 | 706 | 798 | 19 | 79.8 |
Transportation and material moving occupations | 7,917 | 719 | 5 | 1,478 | 600 | 5 | 6,439 | 759 | 6 | 79.1 |
Supervisors of transportation and material moving workers | 222 | 919 | 18 | 47 | - | - | 175 | 943 | 67 | - |
Aircraft pilots and flight engineers | 112 | 1,923 | 219 | 3 | - | - | 109 | 1,984 | 222 | - |
Air traffic controllers and airfield operations specialists | 32 | - | - | 3 | - | - | 29 | - | - | - |
Flight attendants | 54 | 895 | 81 | 41 | - | - | 13 | - | - | - |
Ambulance drivers and attendants, except emergency medical technicians | 8 | - | - | 1 | - | - | 7 | - | - | - |
Bus drivers, school | 105 | 647 | 27 | 53 | 622 | 24 | 52 | 708 | 129 | 87.9 |
Bus drivers, transit and intercity | 146 | 783 | 36 | 57 | 791 | 41 | 89 | 774 | 54 | 102.2 |
Driver/sales workers and truck drivers | 2,592 | 896 | 13 | 183 | 666 | 27 | 2,409 | 916 | 14 | 72.7 |
Shuttle drivers and chauffeurs | 57 | 606 | 23 | 10 | - | - | 47 | - | - | - |
Taxi drivers | 157 | 734 | 52 | 25 | - | - | 132 | 743 | 62 | - |
Motor vehicle operators, all other | 84 | 616 | 17 | 15 | - | - | 70 | 642 | 60 | - |
Locomotive engineers and operators | 50 | 1,489 | 32 | 5 | - | - | 45 | - | - | - |
Railroad conductors and yardmasters | 34 | - | - | 0 | - | - | 34 | - | - | - |
Other rail transportation workers | 11 | - | - | 2 | - | - | 8 | - | - | - |
Sailors and marine oilers | 16 | - | - | 0 | - | - | 16 | - | - | - |
Ship and boat captains and operators | 30 | - | - | 2 | - | - | 28 | - | - | - |
Ship engineers | 1 | - | - | 0 | - | - | 1 | - | - | - |
Parking attendants | 44 | - | - | 7 | - | - | 36 | - | - | - |
Transportation service attendants | 81 | 611 | 45 | 11 | - | - | 70 | 614 | 61 | - |
Transportation inspectors | 26 | - | - | 6 | - | - | 21 | - | - | - |
Passenger attendants | 14 | - | - | 11 | - | - | 4 | - | - | - |
Other transportation workers | 24 | - | - | 7 | - | - | 16 | - | - | - |
Crane and tower operators | 48 | - | - | 2 | - | - | 46 | - | - | - |
Conveyor, dredge, and hoist and winch operators | 23 | - | - | 1 | - | - | 22 | - | - | - |
Industrial truck and tractor operators | 507 | 711 | 14 | 41 | - | - | 467 | 708 | 15 | - |
Cleaners of vehicles and equipment | 214 | 580 | 11 | 35 | - | - | 179 | 581 | 12 | - |
Laborers and freight, stock, and material movers, hand | 1,587 | 650 | 8 | 319 | 595 | 9 | 1,268 | 672 | 9 | 88.5 |
Machine feeders and offbearers | 11 | - | - | 6 | - | - | 4 | - | - | - |
Packers and packagers, hand | 436 | 582 | 7 | 231 | 544 | 15 | 205 | 604 | 8 | 90.1 |
Stockers and order fillers | 1,058 | 593 | 6 | 345 | 576 | 11 | 714 | 602 | 8 | 95.7 |
Pumping station operators | 17 | - | - | 0 | - | - | 17 | - | - | - |
Refuse and recyclable material collectors | 70 | 680 | 41 | 6 | - | - | 64 | 698 | 38 | - |
Other material moving workers | 46 | - | - | 5 | - | - | 41 | - | - | - |
Note: Median earnings are not shown where employment is less than 50,000. Women's earnings as a percentage of men's are not shown where employment for either women or men is less than 50,000. Dash indicates no data or data that do not meet publication criteria. | ||||||||||
Note: Median earnings are not shown where employment is less than 50,000. Women's earnings as a percentage of men's are not shown where employment for either women or men is less than 50,000. Dash indicates no data or data that do not meet publication criteria.
Source: U.S. Bureau of Labor Statistics.
| Table 3. Median usual weekly earnings of full-time wage and salary workers, by state, 2020 annual averages | ||||||||||
|---|---|---|---|---|---|---|---|---|---|---|
| State | Total | Women | Men | Women's earnings as a percentage of men's | ||||||
| Number of workers (in thousands) | Median weekly earnings | Standard error of median | Number of workers (in thousands) | Median weekly earnings | Standard error of median | Number of workers (in thousands) | Median weekly earnings | Standard error of median | ||
United States | 110,387 | $984 | $2 | 49,476 | $891 | $3 | 60,911 | $1,082 | $5 | 82.3 |
Alabama | 1,628 | 887 | 15 | 745 | 791 | 21 | 884 | 978 | 29 | 80.9 |
Alaska | 238 | 1,021 | 21 | 106 | 913 | 27 | 132 | 1,128 | 27 | 80.9 |
Arizona | 2,384 | 932 | 16 | 1,073 | 856 | 28 | 1,312 | 991 | 15 | 86.4 |
Arkansas | 995 | 849 | 16 | 443 | 771 | 17 | 552 | 917 | 21 | 84.1 |
California | 12,544 | 1,063 | 11 | 5,401 | 993 | 12 | 7,143 | 1,133 | 14 | 87.6 |
Colorado | 2,008 | 1,103 | 24 | 834 | 966 | 24 | 1,174 | 1,237 | 17 | 78.1 |
Connecticut | 1,221 | 1,190 | 25 | 536 | 1,166 | 37 | 684 | 1,202 | 25 | 97.0 |
Delaware | 358 | 947 | 21 | 168 | 838 | 29 | 190 | 1,076 | 65 | 77.9 |
District of Columbia | 311 | 1,628 | 27 | 156 | 1,506 | 51 | 155 | 1,759 | 38 | 85.6 |
Florida | 7,025 | 904 | 10 | 3,249 | 831 | 10 | 3,776 | 988 | 12 | 84.1 |
Georgia | 3,584 | 891 | 16 | 1,716 | 788 | 18 | 1,868 | 1,011 | 33 | 77.9 |
Hawaii | 419 | 980 | 25 | 196 | 896 | 24 | 223 | 1,128 | 47 | 79.4 |
Idaho | 588 | 862 | 16 | 239 | 731 | 13 | 349 | 966 | 22 | 75.7 |
Illinois | 4,293 | 1,030 | 17 | 1,951 | 931 | 15 | 2,342 | 1,162 | 18 | 80.1 |
Indiana | 2,378 | 903 | 16 | 1,050 | 801 | 21 | 1,328 | 1,040 | 28 | 77.0 |
Iowa | 1,159 | 933 | 19 | 521 | 854 | 16 | 638 | 1,020 | 28 | 83.7 |
Kansas | 1,044 | 889 | 14 | 457 | 810 | 21 | 586 | 962 | 23 | 84.2 |
Kentucky | 1,439 | 850 | 17 | 656 | 737 | 16 | 783 | 960 | 23 | 76.8 |
Louisiana | 1,457 | 896 | 20 | 693 | 760 | 26 | 764 | 1,024 | 35 | 74.2 |
Maine | 451 | 918 | 21 | 206 | 794 | 22 | 245 | 1,036 | 38 | 76.6 |
Maryland | 2,279 | 1,149 | 19 | 1,104 | 1,074 | 51 | 1,175 | 1,248 | 39 | 86.1 |
Massachusetts | 2,429 | 1,239 | 21 | 1,114 | 1,115 | 26 | 1,314 | 1,356 | 16 | 82.2 |
Michigan | 3,277 | 995 | 11 | 1,500 | 897 | 17 | 1,777 | 1,113 | 19 | 80.6 |
Minnesota | 2,040 | 1,062 | 20 | 914 | 984 | 16 | 1,126 | 1,147 | 17 | 85.8 |
Mississippi | 894 | 764 | 15 | 432 | 675 | 23 | 461 | 878 | 27 | 76.9 |
Missouri | 2,094 | 904 | 19 | 979 | 807 | 17 | 1,115 | 1,026 | 30 | 78.7 |
Montana | 325 | 876 | 19 | 142 | 771 | 19 | 183 | 955 | 26 | 80.7 |
Nebraska | 742 | 931 | 15 | 337 | 843 | 18 | 405 | 1,014 | 29 | 83.1 |
Nevada | 1,035 | 886 | 14 | 449 | 791 | 13 | 586 | 991 | 19 | 79.8 |
New Hampshire | 525 | 1,051 | 27 | 234 | 954 | 19 | 291 | 1,156 | 24 | 82.5 |
New Jersey | 3,178 | 1,163 | 11 | 1,421 | 1,041 | 31 | 1,756 | 1,267 | 24 | 82.2 |
New Mexico | 618 | 858 | 20 | 275 | 801 | 24 | 343 | 915 | 33 | 87.5 |
New York | 6,312 | 1,101 | 14 | 2,934 | 1,000 | 11 | 3,378 | 1,183 | 18 | 84.5 |
North Carolina | 3,524 | 936 | 14 | 1,609 | 837 | 20 | 1,916 | 1,032 | 22 | 81.1 |
North Dakota | 281 | 963 | 16 | 127 | 851 | 20 | 155 | 1,065 | 22 | 79.9 |
Ohio | 3,852 | 967 | 12 | 1,708 | 862 | 15 | 2,144 | 1,052 | 22 | 81.9 |
Oklahoma | 1,265 | 844 | 20 | 538 | 753 | 14 | 728 | 942 | 18 | 79.9 |
Oregon | 1,352 | 1,026 | 21 | 564 | 936 | 24 | 787 | 1,121 | 39 | 83.5 |
Pennsylvania | 4,295 | 1,002 | 11 | 1,922 | 884 | 20 | 2,373 | 1,111 | 19 | 79.6 |
Rhode Island | 375 | 1,020 | 25 | 163 | 951 | 28 | 212 | 1,112 | 35 | 85.5 |
South Carolina | 1,747 | 883 | 18 | 817 | 767 | 22 | 930 | 988 | 23 | 77.6 |
South Dakota | 315 | 877 | 13 | 145 | 797 | 18 | 170 | 936 | 20 | 85.1 |
Tennessee | 2,284 | 861 | 20 | 1,035 | 760 | 18 | 1,249 | 929 | 25 | 81.8 |
Texas | 9,882 | 939 | 10 | 4,274 | 875 | 13 | 5,608 | 1,006 | 11 | 87.0 |
Utah | 1,074 | 941 | 13 | 418 | 782 | 20 | 656 | 1,076 | 26 | 72.7 |
Vermont | 217 | 960 | 18 | 108 | 886 | 20 | 109 | 1,059 | 56 | 83.7 |
Virginia | 3,181 | 1,130 | 22 | 1,453 | 1,002 | 30 | 1,728 | 1,260 | 28 | 79.5 |
Washington | 2,680 | 1,109 | 19 | 1,139 | 982 | 34 | 1,540 | 1,224 | 33 | 80.2 |
West Virginia | 570 | 829 | 16 | 258 | 739 | 14 | 313 | 907 | 16 | 81.5 |
Wisconsin | 2,025 | 966 | 18 | 880 | 885 | 18 | 1,145 | 1,023 | 21 | 86.5 |
Wyoming | 195 | 940 | 17 | 84 | 795 | 26 | 111 | 1,057 | 23 | 75.2 |
Note: In general, the sampling error for the state estimates is considerably larger than it is for the national estimates; thus, comparisons of state estimates should be made with caution. Data shown are based on workers' state of residence; workers' reported earnings, however, may or may not be from a job located in the same state. | ||||||||||
Note: In general, the sampling error for the state estimates is considerably larger than it is for the national estimates; thus, comparisons of state estimates should be made with caution. Data shown are based on workers' state of residence; workers' reported earnings, however, may or may not be from a job located in the same state.
Source: U.S. Bureau of Labor Statistics.
| Table 4. Median usual weekly earnings of part-time wage and salary workers, by selected demographic characteristics, 2020 annual averages | ||||||||||
|---|---|---|---|---|---|---|---|---|---|---|
| Characteristic | Total | Women | Men | Women's earnings as a percentage of men's | ||||||
| Number of workers (in thousands) | Median weekly earnings | Standard error of median | Number of workers (in thousands) | Median weekly earnings | Standard error of median | Number of workers (in thousands) | Median weekly earnings | Standard error of median | ||
Age | ||||||||||
Total, 16 years and older | 21,616 | $307 | $2 | 13,911 | $309 | $2 | 7,705 | $305 | $2 | 101.3 |
16 to 24 years | 7,354 | 239 | 2 | 4,095 | 231 | 3 | 3,259 | 248 | 3 | 93.1 |
16 to 19 years | 3,252 | 197 | 2 | 1,786 | 191 | 3 | 1,466 | 204 | 4 | 93.6 |
20 to 24 years | 4,102 | 276 | 3 | 2,309 | 266 | 4 | 1,793 | 289 | 4 | 92.0 |
25 years and older | 14,262 | 364 | 3 | 9,816 | 359 | 3 | 4,446 | 376 | 5 | 95.5 |
25 to 34 years | 3,743 | 359 | 5 | 2,406 | 358 | 6 | 1,337 | 363 | 9 | 98.6 |
35 to 44 years | 2,800 | 385 | 5 | 2,092 | 380 | 6 | 708 | 399 | 10 | 95.2 |
45 to 54 years | 2,515 | 399 | 5 | 1,905 | 394 | 6 | 610 | 415 | 12 | 94.9 |
55 to 64 years | 2,795 | 369 | 6 | 2,018 | 361 | 7 | 777 | 395 | 14 | 91.4 |
65 years and older | 2,409 | 300 | 5 | 1,395 | 278 | 7 | 1,014 | 327 | 11 | 85.0 |
Race and Hispanic or | ||||||||||
White | 16,871 | 309 | 2 | 10,952 | 312 | 2 | 5,919 | 305 | 3 | 102.3 |
Black or African American | 2,654 | 286 | 4 | 1,673 | 281 | 6 | 981 | 294 | 6 | 95.6 |
Asian | 1,214 | 328 | 8 | 752 | 332 | 12 | 462 | 322 | 9 | 103.1 |
Hispanic or Latino ethnicity | 3,971 | 309 | 3 | 2,420 | 304 | 4 | 1,552 | 316 | 5 | 96.2 |
Marital Status | ||||||||||
Never married | 10,801 | 267 | 2 | 5,968 | 263 | 3 | 4,833 | 272 | 3 | 96.7 |
Married, spouse present(1) | 8,103 | 385 | 4 | 5,930 | 378 | 4 | 2,173 | 408 | 8 | 92.6 |
Widowed, divorced, or separated(2) | 2,712 | 328 | 6 | 2,013 | 321 | 5 | 699 | 350 | 11 | 91.7 |
Widowed | 548 | 281 | 12 | 448 | 281 | 16 | 100 | 282 | 19 | 99.6 |
Divorced | 1,571 | 341 | 8 | 1,149 | 333 | 10 | 422 | 360 | 15 | 92.5 |
Separated(2) | 593 | 336 | 10 | 415 | 323 | 11 | 177 | 367 | 18 | 88.0 |
Footnotes | ||||||||||
Note: Estimates for the race groups shown (White, Black or African American, and Asian) do not sum to totals because data are not presented for all race groups. People of Hispanic or Latino ethnicity may be of any race; estimates for the race groups include Hispanics. | ||||||||||
Footnotes
(1) Beginning with data for 2020, includes people in both opposite-sex and same-sex marriages. Prior to 2020, included only people in opposite-sex marriages.
(2) Separated includes people who are married, spouse absent.
Note: Estimates for the race groups shown (White, Black or African American, and Asian) do not sum to totals because data are not presented for all race groups. People of Hispanic or Latino ethnicity may be of any race; estimates for the race groups include Hispanics.
Source: U.S. Bureau of Labor Statistics.
| Table 5. Median usual weekly earnings of wage and salary workers, by hours usually worked, 2020 annual averages | ||||||||||
|---|---|---|---|---|---|---|---|---|---|---|
| Hours of work | Total | Women | Men | Women's earnings as a percentage of men's | ||||||
| Number of workers (in thousands) | Median weekly earnings | Standard error of median | Number of workers (in thousands) | Median weekly earnings | Standard error of median | Number of workers (in thousands) | Median weekly earnings | Standard error of median | ||
Total, 16 years and older | 132,174 | $863 | $3 | 63,462 | $750 | $2 | 68,711 | $983 | $3 | 76.3 |
0 to 34 hours | 19,918 | 311 | 2 | 12,916 | 313 | 2 | 7,002 | 307 | 3 | 102.0 |
0 to 4 hours | 421 | 87 | 9 | 290 | 72 | 4 | 130 | 160 | 54 | 45.0 |
5 to 9 hours | 986 | 106 | 2 | 669 | 108 | 3 | 317 | 101 | 4 | 106.9 |
10 to 14 hours | 1,800 | 146 | 2 | 1,166 | 149 | 3 | 634 | 140 | 4 | 106.4 |
15 to 19 hours | 2,394 | 209 | 2 | 1,589 | 212 | 3 | 805 | 203 | 4 | 104.4 |
20 to 24 hours | 5,789 | 287 | 2 | 3,679 | 293 | 3 | 2,110 | 278 | 3 | 105.4 |
25 to 29 hours | 2,872 | 359 | 4 | 1,872 | 356 | 4 | 1,001 | 364 | 7 | 97.8 |
30 to 34 hours | 5,655 | 451 | 4 | 3,650 | 455 | 5 | 2,005 | 445 | 7 | 102.2 |
35 hours and over | 106,080 | 989 | 2 | 47,700 | 896 | 3 | 58,380 | 1,088 | 5 | 82.4 |
35 to 39 hours | 7,378 | 629 | 7 | 4,892 | 649 | 9 | 2,486 | 600 | 9 | 108.2 |
40 hours | 78,789 | 926 | 3 | 36,343 | 864 | 3 | 42,447 | 989 | 4 | 87.4 |
41 hours and over | 19,913 | 1,447 | 7 | 6,466 | 1,334 | 15 | 13,448 | 1,501 | 10 | 88.9 |
41 to 44 hours | 1,033 | 1,075 | 27 | 398 | 963 | 41 | 636 | 1,145 | 27 | 84.1 |
45 to 48 hours | 5,622 | 1,300 | 17 | 1,986 | 1,202 | 27 | 3,636 | 1,351 | 13 | 89.0 |
49 to 59 hours | 9,105 | 1,546 | 10 | 2,888 | 1,443 | 16 | 6,217 | 1,592 | 19 | 90.6 |
60 hours and over | 4,152 | 1,607 | 26 | 1,193 | 1,478 | 31 | 2,959 | 1,661 | 41 | 89.0 |
Hours vary | 6,176 | 622 | 10 | 2,846 | 487 | 9 | 3,329 | 748 | 13 | 65.1 |
Usually less than 35 hours | 1,698 | 264 | 6 | 995 | 251 | 7 | 703 | 282 | 8 | 89.0 |
Usually 35 or more hours | 4,307 | 827 | 15 | 1,776 | 709 | 14 | 2,531 | 923 | 20 | 76.8 |
Note: Data refer to the sole or principal job of full-time and part-time workers. Estimates for the "hours vary" groups do not sum to totals because data are not presented for a small number of multiple jobholders whose usual number of hours on the principal job is not identifiable. | ||||||||||
Note: Data refer to the sole or principal job of full-time and part-time workers. Estimates for the "hours vary" groups do not sum to totals because data are not presented for a small number of multiple jobholders whose usual number of hours on the principal job is not identifiable.
Source: U.S. Bureau of Labor Statistics.
| Table 6. Distribution of full-time wage and salary workers, by usual weekly earnings and selected demographic characteristics, 2020 annual averages [In thousands] | |||||||||
|---|---|---|---|---|---|---|---|---|---|
| Characteristic | Total employed | Number of workers by usual weekly earnings | |||||||
| Under $350.00 | $350.00 to $499.99 | $500.00 to $599.99 | $600.00 to $749.99 | $750.00 to $999.99 | $1,000.00 to $1,199.99 | $1,200.00 to $1,999.99 | $2,000.00 or more | ||
Age | |||||||||
Total, 16 years and older | 110,387 | 3,191 | 8,995 | 8,399 | 15,271 | 19,288 | 12,669 | 26,128 | 16,446 |
16 to 24 years | 9,364 | 725 | 2,132 | 1,481 | 2,052 | 1,453 | 644 | 697 | 180 |
16 to 19 years | 1,336 | 234 | 453 | 245 | 228 | 101 | 41 | 31 | 4 |
20 to 24 years | 8,027 | 490 | 1,680 | 1,236 | 1,824 | 1,352 | 603 | 666 | 176 |
25 years and older | 101,024 | 2,466 | 6,863 | 6,918 | 13,219 | 17,835 | 12,026 | 25,431 | 16,266 |
25 to 34 years | 27,661 | 680 | 2,195 | 2,379 | 4,534 | 5,729 | 3,456 | 6,043 | 2,646 |
35 to 44 years | 25,641 | 578 | 1,540 | 1,543 | 3,079 | 4,324 | 3,069 | 6,839 | 4,668 |
45 to 54 years | 23,814 | 525 | 1,440 | 1,401 | 2,789 | 3,883 | 2,716 | 6,486 | 4,575 |
55 to 64 years | 19,017 | 452 | 1,202 | 1,231 | 2,235 | 3,162 | 2,248 | 4,988 | 3,499 |
65 years and older | 4,890 | 230 | 487 | 363 | 582 | 737 | 536 | 1,075 | 878 |
Women, 16 years and older | 49,476 | 1,829 | 4,936 | 4,556 | 7,455 | 9,209 | 5,886 | 10,378 | 5,228 |
16 to 24 years | 4,172 | 400 | 1,012 | 691 | 874 | 593 | 272 | 275 | 54 |
16 to 19 years | 536 | 116 | 204 | 90 | 71 | 26 | 16 | 13 | 0 |
20 to 24 years | 3,636 | 284 | 808 | 601 | 804 | 567 | 255 | 262 | 54 |
25 years and older | 45,304 | 1,428 | 3,924 | 3,865 | 6,581 | 8,615 | 5,614 | 10,103 | 5,174 |
25 to 34 years | 12,375 | 400 | 1,144 | 1,221 | 2,107 | 2,655 | 1,641 | 2,333 | 872 |
35 to 44 years | 11,293 | 312 | 879 | 870 | 1,540 | 2,089 | 1,403 | 2,684 | 1,517 |
45 to 54 years | 10,853 | 312 | 897 | 852 | 1,477 | 1,951 | 1,257 | 2,658 | 1,447 |
55 to 64 years | 8,683 | 270 | 740 | 748 | 1,175 | 1,589 | 1,074 | 2,002 | 1,085 |
65 years and older | 2,100 | 134 | 263 | 173 | 281 | 331 | 240 | 426 | 252 |
Men, 16 years and older | 60,911 | 1,362 | 4,059 | 3,843 | 7,816 | 10,079 | 6,783 | 15,750 | 11,218 |
16 to 24 years | 5,191 | 324 | 1,120 | 790 | 1,177 | 860 | 372 | 422 | 126 |
16 to 19 years | 800 | 118 | 248 | 155 | 157 | 75 | 25 | 18 | 4 |
20 to 24 years | 4,391 | 206 | 871 | 635 | 1,021 | 785 | 347 | 404 | 122 |
25 years and older | 55,720 | 1,038 | 2,939 | 3,053 | 6,638 | 9,220 | 6,411 | 15,328 | 11,093 |
25 to 34 years | 15,287 | 280 | 1,051 | 1,157 | 2,426 | 3,074 | 1,815 | 3,709 | 1,774 |
35 to 44 years | 14,348 | 266 | 661 | 673 | 1,539 | 2,235 | 1,667 | 4,155 | 3,151 |
45 to 54 years | 12,961 | 213 | 543 | 549 | 1,312 | 1,931 | 1,459 | 3,828 | 3,127 |
55 to 64 years | 10,334 | 182 | 462 | 483 | 1,059 | 1,573 | 1,174 | 2,986 | 2,414 |
65 years and older | 2,790 | 96 | 224 | 190 | 301 | 406 | 296 | 650 | 626 |
Race and Hispanic or | |||||||||
White | 85,142 | 2,304 | 6,408 | 6,277 | 11,367 | 15,043 | 10,032 | 20,795 | 12,917 |
Women | 37,091 | 1,303 | 3,511 | 3,338 | 5,506 | 7,020 | 4,584 | 7,945 | 3,886 |
Men | 48,051 | 1,001 | 2,897 | 2,939 | 5,861 | 8,023 | 5,448 | 12,850 | 9,031 |
Black or African American | 14,044 | 591 | 1,807 | 1,325 | 2,550 | 2,587 | 1,502 | 2,513 | 1,169 |
Women | 7,335 | 361 | 1,006 | 759 | 1,331 | 1,355 | 765 | 1,216 | 542 |
Men | 6,709 | 230 | 801 | 565 | 1,219 | 1,231 | 737 | 1,298 | 627 |
Asian | 7,353 | 164 | 396 | 404 | 708 | 998 | 695 | 2,034 | 1,954 |
Women | 3,269 | 83 | 218 | 233 | 333 | 525 | 324 | 903 | 650 |
Men | 4,084 | 81 | 178 | 171 | 375 | 473 | 371 | 1,131 | 1,304 |
Hispanic or Latino ethnicity | 19,558 | 802 | 2,494 | 2,312 | 3,790 | 3,544 | 1,896 | 3,274 | 1,447 |
Women | 7,863 | 442 | 1,193 | 1,088 | 1,529 | 1,347 | 734 | 1,091 | 438 |
Men | 11,695 | 360 | 1,300 | 1,224 | 2,261 | 2,197 | 1,162 | 2,183 | 1,009 |
Note: Estimates for the race groups shown (White, Black or African American, and Asian) do not sum to totals because data are not presented for all race groups. People of Hispanic or Latino ethnicity may be of any race; estimates for the race groups include Hispanics. | |||||||||
Note: Estimates for the race groups shown (White, Black or African American, and Asian) do not sum to totals because data are not presented for all race groups. People of Hispanic or Latino ethnicity may be of any race; estimates for the race groups include Hispanics.
Source: U.S. Bureau of Labor Statistics.
| Table 7. Median usual weekly earnings of full-time wage and salary workers, by marital status and presence and age of own children under 18 years old, 2020 annual averages | |||
|---|---|---|---|
| Characteristic | Number of workers (in thousands) | Median weekly earnings | Standard error of median |
Women | |||
Total, all marital statuses | 49,476 | $891 | $3 |
With children under 18 years old | 16,841 | 909 | 6 |
With children 6 to 17, none younger | 10,287 | 918 | 7 |
With children under 6 years old | 6,554 | 894 | 9 |
With no children under 18 years old | 32,635 | 882 | 4 |
Total, married, spouse present(1) | 24,915 | 981 | 4 |
With children under 18 years old | 11,376 | 1,007 | 7 |
With children 6 to 17, none younger | 6,711 | 1,005 | 9 |
With children under 6 years old | 4,664 | 1,010 | 10 |
With no children under 18 years old | 13,540 | 960 | 6 |
Total, other marital statuses(2) | 24,561 | 795 | 4 |
With children under 18 years old | 5,466 | 727 | 6 |
With children 6 to 17, none younger | 3,576 | 766 | 7 |
With children under 6 years old | 1,890 | 654 | 12 |
With no children under 18 years old | 19,095 | 819 | 5 |
Men | |||
Total, all marital statuses | 60,911 | 1,082 | 5 |
With children under 18 years old | 20,847 | 1,229 | 7 |
With children 6 to 17, none younger | 11,350 | 1,285 | 13 |
With children under 6 years old | 9,496 | 1,161 | 9 |
With no children under 18 years old | 40,064 | 1,005 | 4 |
Total, married, spouse present(1) | 35,132 | 1,250 | 5 |
With children under 18 years old | 18,247 | 1,283 | 11 |
With children 6 to 17, none younger | 9,953 | 1,343 | 11 |
With children under 6 years old | 8,294 | 1,236 | 10 |
With no children under 18 years old | 16,885 | 1,216 | 8 |
Total, other marital statuses(2) | 25,778 | 877 | 5 |
With children under 18 years old | 2,599 | 896 | 13 |
With children 6 to 17, none younger | 1,397 | 1,002 | 15 |
With children under 6 years old | 1,202 | 789 | 14 |
With no children under 18 years old | 23,179 | 874 | 5 |
Footnotes | |||
Note: Children refer to "own" children and include sons, daughters, stepchildren, and adopted children. Excluded are other related children such as grandchildren, nieces, nephews, and cousins, as well as unrelated children. | |||
Footnotes
(1) Beginning with data for 2020, includes people in both opposite-sex and same-sex marriages. Prior to 2020, included only people in opposite-sex marriages.
(2) Includes people who are never married; widowed; divorced; separated; and married, spouse absent.
Note: Children refer to "own" children and include sons, daughters, stepchildren, and adopted children. Excluded are other related children such as grandchildren, nieces, nephews, and cousins, as well as unrelated children.
Source: U.S. Bureau of Labor Statistics.
| Table 8. Median hourly earnings of wage and salary workers paid hourly rates, by selected characteristics, 2020 annual averages | ||||||||||
|---|---|---|---|---|---|---|---|---|---|---|
| Characteristic | Total | Women | Men | Women's earnings as a percentage of men's | ||||||
| Number of workers (in thousands) | Median hourly earnings | Standard error of median | Number of workers (in thousands) | Median hourly earnings | Standard error of median | Number of workers (in thousands) | Median hourly earnings | Standard error of median | ||
Age | ||||||||||
Total, 16 years and older | 73,305 | $16.36 | $0.05 | 36,513 | $15.22 | $0.03 | 36,792 | $17.75 | $0.06 | 85.7 |
16 to 24 years | 14,051 | 12.69 | 0.07 | 6,992 | 12.12 | 0.03 | 7,059 | 13.08 | 0.04 | 92.7 |
16 to 19 years | 4,352 | 11.07 | 0.06 | 2,226 | 10.81 | 0.09 | 2,125 | 11.60 | 0.25 | 93.2 |
20 to 24 years | 9,699 | 13.50 | 0.09 | 4,766 | 12.98 | 0.05 | 4,933 | 14.08 | 0.06 | 92.2 |
25 years and older | 59,254 | 17.86 | 0.03 | 29,521 | 16.50 | 0.08 | 29,734 | 19.18 | 0.10 | 86.0 |
25 to 34 years | 17,872 | 16.85 | 0.05 | 8,460 | 15.93 | 0.06 | 9,412 | 17.56 | 0.13 | 90.7 |
35 to 44 years | 13,691 | 18.52 | 0.13 | 6,687 | 16.95 | 0.08 | 7,004 | 20.10 | 0.06 | 84.3 |
45 to 54 years | 12,672 | 18.90 | 0.11 | 6,454 | 17.07 | 0.11 | 6,218 | 21.05 | 0.14 | 81.1 |
55 to 64 years | 11,179 | 18.60 | 0.17 | 5,926 | 17.04 | 0.08 | 5,253 | 20.15 | 0.07 | 84.6 |
65 years and older | 3,840 | 15.84 | 0.14 | 1,993 | 15.03 | 0.08 | 1,847 | 16.75 | 0.26 | 89.7 |
Race and Hispanic or | ||||||||||
White | 55,889 | 16.78 | 0.05 | 27,257 | 15.31 | 0.06 | 28,632 | 17.98 | 0.04 | 85.2 |
Black or African American | 10,738 | 15.17 | 0.03 | 5,846 | 14.95 | 0.04 | 4,892 | 15.88 | 0.07 | 94.1 |
Asian | 3,533 | 17.25 | 0.26 | 1,857 | 16.56 | 0.38 | 1,676 | 18.04 | 0.15 | 91.8 |
Hispanic or Latino ethnicity | 16,220 | 15.20 | 0.03 | 7,257 | 14.68 | 0.09 | 8,963 | 16.24 | 0.12 | 90.4 |
Marital Status | ||||||||||
Never married | 30,236 | 14.81 | 0.02 | 14,315 | 13.99 | 0.04 | 15,921 | 15.07 | 0.02 | 92.8 |
Married, spouse present(1) | 31,844 | 18.88 | 0.07 | 15,382 | 17.11 | 0.06 | 16,462 | 20.20 | 0.08 | 84.7 |
Widowed, divorced, or separated(2) | 11,225 | 16.94 | 0.07 | 6,816 | 15.80 | 0.11 | 4,409 | 18.98 | 0.16 | 83.2 |
Widowed | 1,360 | 15.39 | 0.26 | 1,032 | 15.08 | 0.11 | 329 | 17.28 | 0.88 | 87.3 |
Divorced | 7,263 | 17.81 | 0.11 | 4,323 | 16.52 | 0.19 | 2,940 | 19.97 | 0.09 | 82.7 |
Separated(2) | 2,602 | 15.42 | 0.24 | 1,461 | 14.85 | 0.07 | 1,141 | 17.17 | 0.26 | 86.5 |
Union Affiliation(3) | ||||||||||
Members of unions(4) | 8,112 | 22.20 | 0.21 | 3,222 | 19.83 | 0.14 | 4,890 | 24.78 | 0.30 | 80.0 |
Represented by unions(5) | 8,916 | 22.01 | 0.10 | 3,597 | 19.59 | 0.25 | 5,318 | 24.17 | 0.33 | 81.1 |
Not represented by a union | 64,389 | 15.89 | 0.03 | 32,916 | 15.09 | 0.02 | 31,474 | 16.91 | 0.04 | 89.2 |
Educational Attainment | ||||||||||
Total, 25 years and older | 59,254 | 17.86 | 0.03 | 29,521 | 16.50 | 0.08 | 29,734 | 19.18 | 0.10 | 86.0 |
Less than a high school diploma | 5,345 | 14.75 | 0.09 | 2,111 | 12.87 | 0.07 | 3,235 | 15.59 | 0.23 | 82.6 |
High school graduates, no college | 19,996 | 16.80 | 0.06 | 8,612 | 15.00 | 0.03 | 11,384 | 18.31 | 0.11 | 81.9 |
Some college or associate degree | 19,061 | 18.00 | 0.05 | 10,011 | 16.60 | 0.12 | 9,050 | 19.98 | 0.05 | 83.1 |
Bachelor's degree and higher | 14,852 | 22.18 | 0.17 | 8,788 | 21.83 | 0.22 | 6,065 | 23.04 | 0.18 | 94.7 |
Footnotes | ||||||||||
Note: Estimates for the race groups shown (White, Black or African American, and Asian) do not sum to totals because data are not presented for all race groups. People of Hispanic or Latino ethnicity may be of any race; estimates for the race groups include Hispanics. | ||||||||||
Footnotes
(1) Beginning with data for 2020, includes people in both opposite-sex and same-sex marriages. Prior to 2020, included only people in opposite-sex marriages.
(2) Separated includes people who are married, spouse absent.
(3) Differences in earnings levels between workers with and without union affiliation reflect a variety of factors in addition to coverage by a collective bargaining agreement, including the distribution of workers by occupation, industry, and geographic region.
(4) Data refer to members of a labor union or an employee association similar to a union.
(5) Data refer to both union members and workers who report no union affiliation but whose jobs are covered by a union or an employee association contract.
Note: Estimates for the race groups shown (White, Black or African American, and Asian) do not sum to totals because data are not presented for all race groups. People of Hispanic or Latino ethnicity may be of any race; estimates for the race groups include Hispanics.
Source: U.S. Bureau of Labor Statistics.
| Table 9. Distribution of wage and salary workers paid hourly rates, by hourly earnings and selected demographic characteristics, 2020 annual averages [In thousands] | ||||||||
|---|---|---|---|---|---|---|---|---|
| Characteristic | Total employed | Number of workers by hourly earnings | ||||||
| Under $6.00 | $6.00 to $7.99 | $8.00 to $9.99 | $10.00 to $11.99 | $12.00 to $14.99 | $15.00 to $19.99 | $20.00 or more | ||
Age | ||||||||
Total, 16 years and older | 73,305 | 673 | 748 | 3,570 | 7,381 | 14,562 | 20,359 | 26,013 |
16 to 24 years | 14,051 | 280 | 410 | 1,729 | 2,881 | 4,191 | 3,328 | 1,231 |
16 to 19 years | 4,352 | 83 | 252 | 948 | 1,125 | 1,294 | 535 | 115 |
20 to 24 years | 9,699 | 197 | 158 | 781 | 1,757 | 2,897 | 2,793 | 1,116 |
25 years and older | 59,254 | 393 | 338 | 1,841 | 4,499 | 10,371 | 17,030 | 24,782 |
25 to 34 years | 17,872 | 181 | 117 | 575 | 1,413 | 3,467 | 5,932 | 6,188 |
35 to 44 years | 13,691 | 91 | 71 | 363 | 944 | 2,267 | 3,680 | 6,276 |
45 to 54 years | 12,672 | 63 | 53 | 333 | 831 | 2,022 | 3,382 | 5,987 |
55 to 64 years | 11,179 | 43 | 52 | 346 | 834 | 1,787 | 3,032 | 5,085 |
65 years and older | 3,840 | 14 | 45 | 223 | 477 | 829 | 1,006 | 1,246 |
Women, 16 years and older | 36,513 | 486 | 449 | 2,211 | 4,350 | 8,207 | 9,946 | 10,863 |
16 to 24 years | 6,992 | 217 | 245 | 994 | 1,526 | 2,118 | 1,408 | 485 |
16 to 19 years | 2,226 | 61 | 144 | 521 | 603 | 644 | 205 | 48 |
20 to 24 years | 4,766 | 156 | 101 | 473 | 923 | 1,473 | 1,203 | 437 |
25 years and older | 29,521 | 269 | 204 | 1,218 | 2,824 | 6,089 | 8,537 | 10,379 |
25 to 34 years | 8,460 | 121 | 70 | 352 | 818 | 1,834 | 2,671 | 2,594 |
35 to 44 years | 6,687 | 65 | 47 | 225 | 590 | 1,364 | 1,858 | 2,538 |
45 to 54 years | 6,454 | 46 | 28 | 248 | 569 | 1,284 | 1,825 | 2,453 |
55 to 64 years | 5,926 | 27 | 29 | 243 | 565 | 1,157 | 1,663 | 2,241 |
65 years and older | 1,993 | 10 | 29 | 150 | 283 | 449 | 521 | 552 |
Men, 16 years and older | 36,792 | 186 | 299 | 1,359 | 3,030 | 6,355 | 10,413 | 15,150 |
16 to 24 years | 7,059 | 63 | 165 | 735 | 1,355 | 2,073 | 1,920 | 746 |
16 to 19 years | 2,125 | 22 | 108 | 427 | 521 | 650 | 330 | 67 |
20 to 24 years | 4,933 | 41 | 57 | 308 | 834 | 1,424 | 1,590 | 679 |
25 years and older | 29,734 | 124 | 133 | 623 | 1,675 | 4,282 | 8,493 | 14,403 |
25 to 34 years | 9,412 | 60 | 46 | 223 | 595 | 1,633 | 3,261 | 3,594 |
35 to 44 years | 7,004 | 26 | 24 | 138 | 354 | 902 | 1,822 | 3,738 |
45 to 54 years | 6,218 | 17 | 25 | 86 | 263 | 738 | 1,557 | 3,534 |
55 to 64 years | 5,253 | 16 | 23 | 102 | 269 | 630 | 1,368 | 2,843 |
65 years and older | 1,847 | 5 | 15 | 74 | 194 | 379 | 485 | 695 |
Race and Hispanic or | ||||||||
White | 55,889 | 513 | 512 | 2,444 | 5,425 | 11,055 | 15,271 | 20,668 |
Women | 27,257 | 372 | 309 | 1,513 | 3,212 | 6,193 | 7,314 | 8,346 |
Men | 28,632 | 141 | 204 | 931 | 2,213 | 4,862 | 7,957 | 12,323 |
Black or African American | 10,738 | 92 | 171 | 850 | 1,385 | 2,166 | 3,207 | 2,867 |
Women | 5,846 | 74 | 108 | 538 | 818 | 1,229 | 1,704 | 1,374 |
Men | 4,892 | 18 | 63 | 312 | 567 | 936 | 1,503 | 1,493 |
Asian | 3,533 | 35 | 12 | 111 | 272 | 683 | 960 | 1,460 |
Women | 1,857 | 16 | 7 | 58 | 164 | 397 | 495 | 720 |
Men | 1,676 | 19 | 5 | 53 | 108 | 286 | 465 | 740 |
Hispanic or Latino ethnicity | 16,220 | 124 | 130 | 797 | 1,652 | 4,039 | 4,963 | 4,515 |
Women | 7,257 | 79 | 73 | 488 | 925 | 2,132 | 2,052 | 1,507 |
Men | 8,963 | 45 | 57 | 309 | 727 | 1,907 | 2,910 | 3,008 |
Note: Estimates for the race groups shown (White, Black or African American, and Asian) do not sum to totals because data are not presented for all race groups. People of Hispanic or Latino ethnicity may be of any race; estimates for the race groups include Hispanics. | ||||||||
Note: Estimates for the race groups shown (White, Black or African American, and Asian) do not sum to totals because data are not presented for all race groups. People of Hispanic or Latino ethnicity may be of any race; estimates for the race groups include Hispanics.
Source: U.S. Bureau of Labor Statistics.
| Table 10. Wage and salary workers paid hourly rates with earnings at or below the prevailing federal minimum wage, by selected demographic characteristics, 2020 annual averages [Numbers in thousands] | |||||
|---|---|---|---|---|---|
| Characteristic | Workers paid hourly rates | ||||
| Total | Below prevailing federal minimum wage | At prevailing federal minimum wage | Total at or below prevailing federal minimum wage | ||
| Number | Percentage of workers paid hourly rates | ||||
Age | |||||
Total, 16 years and older | 73,305 | 865 | 247 | 1,112 | 1.5 |
16 to 24 years | 14,051 | 376 | 153 | 529 | 3.8 |
16 to 19 years | 4,352 | 129 | 93 | 222 | 5.1 |
20 to 24 years | 9,699 | 247 | 60 | 307 | 3.2 |
25 years and older | 59,254 | 489 | 94 | 583 | 1.0 |
25 to 34 years | 17,872 | 216 | 34 | 250 | 1.4 |
35 to 44 years | 13,691 | 113 | 17 | 130 | 1.0 |
45 to 54 years | 12,672 | 80 | 13 | 93 | 0.7 |
55 to 64 years | 11,179 | 60 | 14 | 75 | 0.7 |
65 years and older | 3,840 | 20 | 15 | 35 | 0.9 |
Women, 16 years and older | 36,513 | 607 | 136 | 742 | 2.0 |
16 to 24 years | 6,992 | 281 | 88 | 369 | 5.3 |
16 to 19 years | 2,226 | 89 | 51 | 141 | 6.3 |
20 to 24 years | 4,766 | 192 | 37 | 229 | 4.8 |
25 years and older | 29,521 | 325 | 48 | 373 | 1.3 |
25 to 34 years | 8,460 | 140 | 20 | 160 | 1.9 |
35 to 44 years | 6,687 | 81 | 8 | 89 | 1.3 |
45 to 54 years | 6,454 | 58 | 2 | 60 | 0.9 |
55 to 64 years | 5,926 | 34 | 6 | 40 | 0.7 |
65 years and older | 1,993 | 12 | 12 | 24 | 1.2 |
Men, 16 years and older | 36,792 | 258 | 111 | 369 | 1.0 |
16 to 24 years | 7,059 | 94 | 65 | 159 | 2.3 |
16 to 19 years | 2,125 | 40 | 41 | 81 | 3.8 |
20 to 24 years | 4,933 | 55 | 24 | 78 | 1.6 |
25 years and older | 29,734 | 164 | 46 | 210 | 0.7 |
25 to 34 years | 9,412 | 76 | 14 | 90 | 1.0 |
35 to 44 years | 7,004 | 32 | 9 | 41 | 0.6 |
45 to 54 years | 6,218 | 22 | 11 | 33 | 0.5 |
55 to 64 years | 5,253 | 26 | 8 | 34 | 0.7 |
65 years and older | 1,847 | 8 | 4 | 11 | 0.6 |
Race and Hispanic or | |||||
White | 55,889 | 631 | 178 | 810 | 1.4 |
Women | 27,257 | 451 | 92 | 544 | 2.0 |
Men | 28,632 | 180 | 86 | 266 | 0.9 |
Black or African American | 10,738 | 146 | 50 | 196 | 1.8 |
Women | 5,846 | 104 | 35 | 139 | 2.4 |
Men | 4,892 | 42 | 15 | 57 | 1.2 |
Asian | 3,533 | 39 | 3 | 43 | 1.2 |
Women | 1,857 | 18 | 2 | 20 | 1.1 |
Men | 1,676 | 22 | 1 | 23 | 1.4 |
Hispanic or Latino ethnicity | 16,220 | 160 | 46 | 205 | 1.3 |
Women | 7,257 | 102 | 22 | 124 | 1.7 |
Men | 8,963 | 58 | 24 | 82 | 0.9 |
Full- and Part-time Status(1) | |||||
Full-time workers | 55,669 | 397 | 72 | 468 | 0.8 |
Women | 25,156 | 281 | 38 | 318 | 1.3 |
Men | 30,514 | 116 | 34 | 150 | 0.5 |
Part-time workers | 17,531 | 462 | 175 | 637 | 3.6 |
Women | 11,305 | 323 | 98 | 421 | 3.7 |
Men | 6,226 | 139 | 77 | 216 | 3.5 |
Footnotes | |||||
Note: See the technical notes section for information about the federal minimum wage level and estimating the number of minimum wage workers. Estimates for the race groups shown (White, Black or African American, and Asian) do not sum to totals because data are not presented for all race groups. People of Hispanic or Latino ethnicity may be of any race; estimates for the race groups include Hispanics. | |||||
Footnotes
(1) The distinction between full- and part-time workers is based on hours usually worked. These data do not sum to totals because full- or part-time status on the principal job is not identifiable for a small number of multiple jobholders.
Note: See the technical notes section for information about the federal minimum wage level and estimating the number of minimum wage workers. Estimates for the race groups shown (White, Black or African American, and Asian) do not sum to totals because data are not presented for all race groups. People of Hispanic or Latino ethnicity may be of any race; estimates for the race groups include Hispanics.
Source: U.S. Bureau of Labor Statistics.
| Table 11. Wage and salary workers paid hourly rates with earnings at or below the prevailing federal minimum wage, 1979-2020 annual averages [Numbers in thousands] | |||||||
|---|---|---|---|---|---|---|---|
| Year | Total wage and salary workers | Workers paid hourly rates | |||||
| Total | Percentage of total wage and salary workers | Below prevailing federal minimum wage(1) | At prevailing federal minimum wage(1) | Total at or below prevailing federal minimum wage | |||
| Number | Percentage of workers paid hourly rates | ||||||
Total | |||||||
1979 | 87,529 | 51,721 | 59.1 | 2,916 | 3,997 | 6,912 | 13.4 |
1980 | 87,644 | 51,335 | 58.6 | 3,087 | 4,686 | 7,773 | 15.1 |
1981 | 88,516 | 51,869 | 58.6 | 3,513 | 4,311 | 7,824 | 15.1 |
1982 | 87,368 | 50,846 | 58.2 | 2,348 | 4,148 | 6,496 | 12.8 |
1983 | 88,290 | 51,820 | 58.7 | 2,077 | 4,261 | 6,338 | 12.2 |
1984 | 92,194 | 54,143 | 58.7 | 1,838 | 4,125 | 5,963 | 11.0 |
1985 | 94,521 | 55,762 | 59.0 | 1,639 | 3,899 | 5,538 | 9.9 |
1986 | 96,903 | 57,529 | 59.4 | 1,599 | 3,461 | 5,060 | 8.8 |
1987 | 99,303 | 59,552 | 60.0 | 1,468 | 3,229 | 4,698 | 7.9 |
1988 | 101,407 | 60,878 | 60.0 | 1,319 | 2,608 | 3,927 | 6.5 |
1989 | 103,480 | 62,389 | 60.3 | 1,372 | 1,790 | 3,162 | 5.1 |
1990 | 104,876 | 63,172 | 60.2 | 2,132 | 1,096 | 3,228 | 5.1 |
1991 | 103,723 | 62,627 | 60.4 | 2,377 | 2,906 | 5,283 | 8.4 |
1992 | 104,668 | 63,610 | 60.8 | 1,939 | 2,982 | 4,921 | 7.7 |
1993 | 106,101 | 64,274 | 60.6 | 1,707 | 2,625 | 4,332 | 6.7 |
1994 | 107,989 | 66,549 | 61.6 | 1,995 | 2,132 | 4,128 | 6.2 |
1995 | 110,038 | 68,354 | 62.1 | 1,699 | 1,956 | 3,656 | 5.3 |
1996 | 111,960 | 69,255 | 61.9 | 1,863 | 1,861 | 3,724 | 5.4 |
1997 | 114,533 | 70,735 | 61.8 | 2,990 | 1,764 | 4,754 | 6.7 |
1998 | 116,730 | 71,440 | 61.2 | 2,834 | 1,593 | 4,427 | 6.2 |
1999 | 118,963 | 72,306 | 60.8 | 2,194 | 1,146 | 3,340 | 4.6 |
2000 | 122,089 | 73,496 | 60.2 | 1,752 | 898 | 2,650 | 3.6 |
2001 | 122,229 | 73,392 | 60.0 | 1,518 | 656 | 2,174 | 3.0 |
2002 | 121,826 | 72,508 | 59.5 | 1,579 | 567 | 2,146 | 3.0 |
2003 | 122,358 | 72,946 | 59.6 | 1,555 | 545 | 2,100 | 2.9 |
2004 | 123,554 | 73,939 | 59.8 | 1,483 | 520 | 2,003 | 2.7 |
2005 | 125,889 | 75,609 | 60.1 | 1,403 | 479 | 1,882 | 2.5 |
2006 | 128,237 | 76,514 | 59.7 | 1,283 | 409 | 1,692 | 2.2 |
2007 | 129,767 | 75,873 | 58.5 | 1,462 | 267 | 1,729 | 2.3 |
2008 | 129,377 | 75,305 | 58.2 | 1,940 | 286 | 2,226 | 3.0 |
2009 | 124,490 | 72,611 | 58.3 | 2,592 | 980 | 3,572 | 4.9 |
2010 | 124,073 | 72,902 | 58.8 | 2,541 | 1,820 | 4,361 | 6.0 |
2011 | 125,187 | 73,926 | 59.1 | 2,152 | 1,677 | 3,829 | 5.2 |
2012 | 127,577 | 75,276 | 59.0 | 1,984 | 1,566 | 3,550 | 4.7 |
2013 | 129,110 | 75,948 | 58.8 | 1,768 | 1,532 | 3,301 | 4.3 |
2014 | 131,431 | 77,207 | 58.7 | 1,737 | 1,255 | 2,992 | 3.9 |
2015 | 133,743 | 78,232 | 58.5 | 1,691 | 870 | 2,561 | 3.3 |
2016 | 136,101 | 79,883 | 58.7 | 1,451 | 701 | 2,153 | 2.7 |
2017 | 137,890 | 80,439 | 58.3 | 1,282 | 542 | 1,824 | 2.3 |
2018 | 140,099 | 81,915 | 58.5 | 1,276 | 434 | 1,711 | 2.1 |
2019 | 141,737 | 82,289 | 58.1 | 1,211 | 392 | 1,603 | 1.9 |
2020 | 132,174 | 73,305 | 55.5 | 865 | 247 | 1,112 | 1.5 |
Women | |||||||
1979 | 38,129 | 23,329 | 61.2 | 2,070 | 2,644 | 4,714 | 20.2 |
1980 | 38,944 | 23,626 | 60.7 | 2,104 | 2,990 | 5,095 | 21.6 |
1981 | 39,672 | 24,294 | 61.2 | 2,394 | 2,778 | 5,172 | 21.3 |
1982 | 39,777 | 24,365 | 61.3 | 1,651 | 2,561 | 4,212 | 17.3 |
1983 | 40,433 | 24,989 | 61.8 | 1,492 | 2,603 | 4,095 | 16.4 |
1984 | 42,172 | 26,003 | 61.7 | 1,348 | 2,499 | 3,847 | 14.8 |
1985 | 43,506 | 26,869 | 61.8 | 1,198 | 2,356 | 3,554 | 13.2 |
1986 | 44,961 | 27,863 | 62.0 | 1,192 | 2,125 | 3,317 | 11.9 |
1987 | 46,365 | 29,078 | 62.7 | 1,105 | 1,946 | 3,051 | 10.5 |
1988 | 47,495 | 29,820 | 62.8 | 1,008 | 1,542 | 2,550 | 8.6 |
1989 | 48,691 | 30,702 | 63.1 | 994 | 1,056 | 2,050 | 6.7 |
1990 | 49,323 | 31,069 | 63.0 | 1,420 | 711 | 2,131 | 6.9 |
1991 | 49,105 | 30,988 | 63.1 | 1,582 | 1,792 | 3,374 | 10.9 |
1992 | 49,842 | 31,454 | 63.1 | 1,286 | 1,751 | 3,036 | 9.7 |
1993 | 50,626 | 31,937 | 63.1 | 1,133 | 1,534 | 2,667 | 8.4 |
1994 | 51,419 | 33,021 | 64.2 | 1,322 | 1,241 | 2,563 | 7.8 |
1995 | 52,369 | 33,934 | 64.8 | 1,157 | 1,161 | 2,318 | 6.8 |
1996 | 53,488 | 34,418 | 64.3 | 1,244 | 1,106 | 2,350 | 6.8 |
1997 | 54,708 | 35,214 | 64.4 | 1,843 | 1,092 | 2,935 | 8.3 |
1998 | 55,757 | 35,680 | 64.0 | 1,794 | 965 | 2,760 | 7.7 |
1999 | 57,050 | 36,233 | 63.5 | 1,426 | 700 | 2,126 | 5.9 |
2000 | 58,427 | 36,777 | 62.9 | 1,170 | 579 | 1,749 | 4.8 |
2001 | 58,582 | 36,848 | 62.9 | 1,021 | 409 | 1,430 | 3.9 |
2002 | 58,555 | 36,508 | 62.3 | 997 | 350 | 1,347 | 3.7 |
2003 | 59,122 | 37,093 | 62.7 | 1,062 | 332 | 1,394 | 3.8 |
2004 | 59,408 | 37,133 | 62.5 | 1,013 | 310 | 1,323 | 3.6 |
2005 | 60,423 | 37,957 | 62.8 | 944 | 290 | 1,234 | 3.3 |
2006 | 61,426 | 38,321 | 62.4 | 861 | 263 | 1,124 | 2.9 |
2007 | 62,299 | 38,082 | 61.1 | 1,002 | 181 | 1,183 | 3.1 |
2008 | 62,532 | 37,972 | 60.7 | 1,302 | 196 | 1,498 | 3.9 |
2009 | 60,951 | 37,426 | 61.4 | 1,603 | 612 | 2,215 | 5.9 |
2010 | 60,542 | 37,404 | 61.8 | 1,598 | 1,151 | 2,749 | 7.3 |
2011 | 60,502 | 37,469 | 61.9 | 1,366 | 1,029 | 2,395 | 6.4 |
2012 | 61,679 | 38,163 | 61.9 | 1,288 | 999 | 2,287 | 6.0 |
2013 | 62,316 | 38,404 | 61.6 | 1,148 | 910 | 2,058 | 5.4 |
2014 | 63,383 | 38,802 | 61.2 | 1,139 | 739 | 1,878 | 4.8 |
2015 | 64,445 | 39,500 | 61.3 | 1,062 | 540 | 1,602 | 4.1 |
2016 | 65,512 | 40,315 | 61.5 | 952 | 432 | 1,384 | 3.4 |
2017 | 66,421 | 40,658 | 61.2 | 829 | 316 | 1,146 | 2.8 |
2018 | 67,467 | 41,223 | 61.1 | 812 | 267 | 1,078 | 2.6 |
2019 | 68,388 | 41,372 | 60.5 | 800 | 268 | 1,067 | 2.6 |
2020 | 63,462 | 36,513 | 57.5 | 607 | 136 | 742 | 2.0 |
Men | |||||||
1979 | 49,400 | 28,392 | 57.5 | 846 | 1,353 | 2,199 | 7.7 |
1980 | 48,700 | 27,709 | 56.9 | 983 | 1,696 | 2,678 | 9.7 |
1981 | 48,844 | 27,576 | 56.5 | 1,119 | 1,533 | 2,652 | 9.6 |
1982 | 47,591 | 26,481 | 55.6 | 697 | 1,587 | 2,284 | 8.6 |
1983 | 47,856 | 26,831 | 56.1 | 585 | 1,658 | 2,243 | 8.4 |
1984 | 50,022 | 28,140 | 56.3 | 490 | 1,626 | 2,116 | 7.5 |
1985 | 51,015 | 28,893 | 56.6 | 440 | 1,544 | 1,984 | 6.9 |
1986 | 51,942 | 29,666 | 57.1 | 408 | 1,336 | 1,743 | 5.9 |
1987 | 52,938 | 30,474 | 57.6 | 364 | 1,283 | 1,647 | 5.4 |
1988 | 53,912 | 31,058 | 57.6 | 311 | 1,066 | 1,377 | 4.4 |
1989 | 54,789 | 31,687 | 57.8 | 379 | 733 | 1,112 | 3.5 |
1990 | 55,553 | 32,104 | 57.8 | 712 | 385 | 1,097 | 3.4 |
1991 | 54,618 | 31,639 | 57.9 | 795 | 1,114 | 1,909 | 6.0 |
1992 | 54,826 | 32,155 | 58.6 | 653 | 1,231 | 1,885 | 5.9 |
1993 | 55,475 | 32,337 | 58.3 | 573 | 1,091 | 1,664 | 5.1 |
1994 | 56,570 | 33,528 | 59.3 | 674 | 891 | 1,565 | 4.7 |
1995 | 57,669 | 34,420 | 59.7 | 542 | 796 | 1,338 | 3.9 |
1996 | 58,473 | 34,838 | 59.6 | 619 | 755 | 1,374 | 3.9 |
1997 | 59,825 | 35,521 | 59.4 | 1,147 | 673 | 1,820 | 5.1 |
1998 | 60,973 | 35,761 | 58.7 | 1,039 | 628 | 1,667 | 4.7 |
1999 | 61,914 | 36,073 | 58.3 | 768 | 446 | 1,214 | 3.4 |
2000 | 63,662 | 36,720 | 57.7 | 582 | 319 | 901 | 2.5 |
2001 | 63,647 | 36,544 | 57.4 | 497 | 247 | 744 | 2.0 |
2002 | 63,272 | 36,000 | 56.9 | 582 | 217 | 799 | 2.2 |
2003 | 63,236 | 35,853 | 56.7 | 493 | 213 | 706 | 2.0 |
2004 | 64,145 | 36,806 | 57.4 | 470 | 210 | 680 | 1.8 |
2005 | 65,466 | 37,652 | 57.5 | 459 | 189 | 648 | 1.7 |
2006 | 66,811 | 38,193 | 57.2 | 422 | 146 | 568 | 1.5 |
2007 | 67,468 | 37,790 | 56.0 | 460 | 86 | 546 | 1.4 |
2008 | 66,846 | 37,334 | 55.9 | 638 | 90 | 728 | 1.9 |
2009 | 63,539 | 35,185 | 55.4 | 990 | 368 | 1,358 | 3.9 |
2010 | 63,531 | 35,498 | 55.9 | 943 | 669 | 1,612 | 4.5 |
2011 | 64,686 | 36,457 | 56.4 | 785 | 648 | 1,433 | 3.9 |
2012 | 65,898 | 37,113 | 56.3 | 696 | 567 | 1,263 | 3.4 |
2013 | 66,794 | 37,544 | 56.2 | 621 | 622 | 1,243 | 3.3 |
2014 | 68,048 | 38,405 | 56.4 | 598 | 516 | 1,114 | 2.9 |
2015 | 69,298 | 38,732 | 55.9 | 629 | 330 | 959 | 2.5 |
2016 | 70,589 | 39,568 | 56.1 | 499 | 270 | 769 | 1.9 |
2017 | 71,469 | 39,781 | 55.7 | 452 | 226 | 678 | 1.7 |
2018 | 72,632 | 40,691 | 56.0 | 464 | 168 | 632 | 1.6 |
2019 | 73,349 | 40,918 | 55.8 | 411 | 125 | 536 | 1.3 |
2020 | 68,711 | 36,792 | 53.5 | 258 | 111 | 369 | 1.0 |
Footnotes | |||||||
Note: The comparability of historical labor force data has been affected at various times by methodological and other changes in the Current Population Survey (CPS). Information about historical comparability is online at https://www.bls.gov/cps/documentation.htm#comp. See the technical notes section for information about the federal minimum wage level and estimating the number of minimum wage workers. | |||||||
Footnotes
(1) Data for 1990-91, 1996-97, and 2007-09 reflect changes in the minimum wage that took place in those years.
Note: The comparability of historical labor force data has been affected at various times by methodological and other changes in the Current Population Survey (CPS). Information about historical comparability is online at https://www.bls.gov/cps/documentation.htm#comp. See the technical notes section for information about the federal minimum wage level and estimating the number of minimum wage workers.
Source: U.S. Bureau of Labor Statistics.
| Table 12. Women's earnings as a percentage of men's, by age, for full-time wage and salary workers, 1979-2020 | ||||||||||
|---|---|---|---|---|---|---|---|---|---|---|
| Year | Total, 16 years and older | 16 to 24 years | 25 years and older | |||||||
| Total | 16 to 19 years | 20 to 24 years | Total | 25 to 34 years | 35 to 44 years | 45 to 54 years | 55 to 64 years | 65 years and older | ||
1979 | 62.3 | 78.6 | 85.2 | 76.3 | 62.1 | 67.5 | 58.3 | 56.8 | 60.6 | 77.6 |
1980 | 64.2 | 80.3 | 89.5 | 78.1 | 62.8 | 69.4 | 58.3 | 56.9 | 59.4 | 76.4 |
1981 | 64.4 | 82.6 | 91.7 | 80.6 | 62.6 | 70.3 | 59.9 | 56.8 | 58.9 | 71.1 |
1982 | 65.7 | 85.3 | 92.9 | 82.4 | 64.9 | 72.1 | 61.1 | 60.1 | 61.4 | 70.3 |
1983 | 66.5 | 88.8 | 94.0 | 85.5 | 65.8 | 73.3 | 61.5 | 59.5 | 61.8 | 68.8 |
1984 | 67.6 | 87.9 | 93.1 | 85.2 | 67.1 | 74.6 | 62.0 | 59.4 | 61.5 | 66.8 |
1985 | 68.1 | 87.6 | 90.7 | 85.7 | 66.8 | 75.1 | 63.0 | 59.7 | 61.0 | 65.9 |
1986 | 69.5 | 89.0 | 91.4 | 87.5 | 66.5 | 76.1 | 63.9 | 60.9 | 61.2 | 71.5 |
1987 | 69.8 | 88.3 | 87.8 | 88.0 | 67.3 | 76.7 | 66.1 | 62.3 | 62.2 | 68.7 |
1988 | 70.2 | 89.7 | 89.8 | 90.0 | 68.8 | 77.7 | 68.5 | 61.7 | 62.3 | 70.9 |
1989 | 70.1 | 90.8 | 94.3 | 89.7 | 70.2 | 78.3 | 68.3 | 62.7 | 63.9 | 74.3 |
1990 | 71.9 | 90.1 | 90.8 | 90.3 | 72.1 | 79.3 | 69.6 | 63.8 | 63.7 | 74.4 |
1991 | 74.2 | 93.3 | 93.6 | 93.3 | 74.0 | 81.0 | 70.7 | 65.0 | 64.5 | 68.3 |
1992 | 75.8 | 94.0 | 94.0 | 94.3 | 74.6 | 82.0 | 71.9 | 65.8 | 64.9 | 77.9 |
1993 | 77.1 | 94.8 | 92.8 | 95.4 | 74.8 | 83.0 | 73.0 | 67.4 | 67.4 | 74.3 |
1994 | 76.4 | 93.9 | 92.5 | 94.5 | 73.1 | 82.9 | 72.6 | 67.1 | 66.0 | 76.2 |
1995 | 75.5 | 90.8 | 88.1 | 92.4 | 72.8 | 82.2 | 72.6 | 67.7 | 64.7 | 80.0 |
1996 | 75.0 | 92.5 | 88.8 | 92.8 | 74.1 | 83.2 | 73.3 | 68.9 | 65.3 | 70.0 |
1997 | 74.4 | 92.1 | 91.6 | 90.5 | 75.1 | 82.9 | 74.0 | 69.4 | 64.7 | 77.0 |
1998 | 76.3 | 91.3 | 88.6 | 89.4 | 75.9 | 82.9 | 73.6 | 70.5 | 68.1 | 72.6 |
1999 | 76.5 | 91.0 | 91.4 | 90.5 | 74.4 | 81.5 | 71.7 | 70.0 | 67.9 | 78.7 |
2000 | 76.9 | 91.7 | 92.5 | 92.7 | 74.5 | 82.4 | 71.6 | 73.2 | 69.1 | 75.1 |
2001 | 76.4 | 90.3 | 90.3 | 91.9 | 75.4 | 83.0 | 72.5 | 73.5 | 70.5 | 69.0 |
2002 | 77.9 | 93.9 | 94.6 | 93.9 | 77.6 | 84.5 | 75.2 | 74.6 | 71.6 | 73.8 |
2003 | 79.4 | 93.2 | 93.1 | 93.9 | 78.5 | 86.9 | 76.1 | 73.0 | 72.7 | 71.1 |
2004 | 80.4 | 93.8 | 92.1 | 93.8 | 78.6 | 87.8 | 75.6 | 72.9 | 73.0 | 74.6 |
2005 | 81.0 | 93.2 | 92.1 | 93.8 | 79.4 | 89.0 | 75.5 | 75.5 | 74.7 | 76.4 |
2006 | 80.8 | 94.5 | 87.6 | 94.9 | 78.7 | 88.2 | 77.2 | 73.5 | 72.9 | 77.5 |
2007 | 80.2 | 92.3 | 89.1 | 90.3 | 78.5 | 86.9 | 76.5 | 74.5 | 72.8 | 77.8 |
2008 | 79.9 | 91.1 | 87.3 | 92.5 | 78.2 | 88.5 | 74.5 | 74.9 | 75.4 | 74.8 |
2009 | 80.2 | 92.6 | 90.7 | 92.9 | 78.7 | 88.7 | 77.4 | 73.6 | 75.3 | 76.1 |
2010 | 81.2 | 95.3 | 94.6 | 93.8 | 80.5 | 90.8 | 79.9 | 76.5 | 75.2 | 75.7 |
2011 | 82.2 | 92.5 | 88.6 | 93.2 | 81.0 | 92.3 | 78.5 | 76.0 | 75.1 | 80.9 |
2012 | 80.9 | 88.9 | 88.5 | 89.0 | 79.9 | 90.2 | 78.1 | 75.1 | 76.2 | 77.6 |
2013 | 82.1 | 88.3 | 89.7 | 89.8 | 81.1 | 89.4 | 80.2 | 76.6 | 77.1 | 73.7 |
2014 | 82.5 | 91.5 | 91.1 | 92.3 | 81.6 | 89.9 | 81.0 | 77.2 | 76.4 | 78.6 |
2015 | 81.1 | 88.2 | 89.4 | 89.7 | 80.4 | 89.6 | 81.8 | 76.8 | 73.7 | 73.8 |
2016 | 81.9 | 94.9 | 92.6 | 95.6 | 80.9 | 88.8 | 83.3 | 77.8 | 73.7 | 75.5 |
2017 | 81.8 | 91.2 | 87.6 | 90.2 | 81.3 | 88.2 | 81.0 | 77.5 | 78.0 | 77.0 |
2018 | 81.1 | 90.8 | 89.4 | 92.2 | 80.9 | 87.0 | 79.6 | 77.0 | 75.0 | 77.2 |
2019 | 81.5 | 89.0 | 84.4 | 90.4 | 80.8 | 87.8 | 80.1 | 77.3 | 75.5 | 76.5 |
2020 | 82.3 | 94.7 | 90.4 | 93.5 | 81.2 | 89.5 | 81.2 | 77.5 | 77.8 | 80.4 |
Note: The comparability of historical labor force data has been affected at various times by methodological and other changes in the Current Population Survey (CPS). Information about historical comparability is online at https://www.bls.gov/cps/documentation.htm#comp. The women's-to-men's earnings ratios shown here are calculated from the current-dollar median usual weekly earnings of full-time wage and salary workers in table 22. | ||||||||||
Note: The comparability of historical labor force data has been affected at various times by methodological and other changes in the Current Population Survey (CPS). Information about historical comparability is online at https://www.bls.gov/cps/documentation.htm#comp. The women's-to-men's earnings ratios shown here are calculated from the current-dollar median usual weekly earnings of full-time wage and salary workers in table 22.
Source: U.S. Bureau of Labor Statistics.
| Table 13. Women's earnings as a percentage of men's, by race and Hispanic or Latino ethnicity, for full-time wage and salary workers, 1979-2020 | |||||
|---|---|---|---|---|---|
| Year | Total, 16 years and older | White | Black or African American | Asian | Hispanic or Latino ethnicity |
1979 | 62.3 | 61.7 | 74.4 | - | 71.7 |
1980 | 64.2 | 63.4 | 75.8 | - | 73.5 |
1981 | 64.4 | 63.1 | 76.9 | - | 75.7 |
1982 | 65.7 | 64.5 | 78.1 | - | 75.5 |
1983 | 66.5 | 65.6 | 78.9 | - | 78.5 |
1984 | 67.6 | 66.8 | 79.5 | - | 77.7 |
1985 | 68.1 | 67.2 | 82.6 | - | 77.7 |
1986 | 69.5 | 67.9 | 82.8 | - | 80.6 |
1987 | 69.8 | 68.2 | 84.4 | - | 82.0 |
1988 | 70.2 | 68.4 | 82.8 | - | 84.4 |
1989 | 70.1 | 69.3 | 86.5 | - | 85.4 |
1990 | 71.9 | 71.5 | 85.3 | - | 87.4 |
1991 | 74.2 | 73.7 | 86.1 | - | 90.4 |
1992 | 75.8 | 75.3 | 88.2 | - | 89.1 |
1993 | 77.1 | 76.5 | 88.8 | - | 90.5 |
1994 | 76.4 | 74.6 | 86.5 | - | 88.9 |
1995 | 75.5 | 73.3 | 86.4 | - | 87.1 |
1996 | 75.0 | 73.8 | 87.9 | - | 88.8 |
1997 | 74.4 | 74.6 | 86.8 | - | 85.7 |
1998 | 76.3 | 76.1 | 85.5 | - | 86.4 |
1999 | 76.5 | 75.7 | 83.8 | - | 85.7 |
2000 | 76.9 | 75.8 | 84.1 | 79.9 | 87.8 |
2001 | 76.4 | 75.8 | 85.8 | 76.9 | 88.2 |
2002 | 77.9 | 77.9 | 90.3 | 74.9 | 88.0 |
2003 | 79.4 | 79.3 | 88.5 | 77.5 | 88.4 |
2004 | 80.4 | 79.8 | 88.8 | 76.4 | 87.3 |
2005 | 81.0 | 80.2 | 89.3 | 80.6 | 87.7 |
2006 | 80.8 | 80.0 | 87.8 | 79.3 | 87.1 |
2007 | 80.2 | 79.4 | 88.8 | 78.1 | 91.0 |
2008 | 79.9 | 79.3 | 89.4 | 78.0 | 89.6 |
2009 | 80.2 | 79.2 | 93.7 | 81.8 | 89.5 |
2010 | 81.2 | 80.5 | 93.5 | 82.6 | 90.7 |
2011 | 82.2 | 82.1 | 91.1 | 77.4 | 90.7 |
2012 | 80.9 | 80.8 | 90.1 | 73.0 | 88.0 |
2013 | 82.1 | 81.7 | 91.3 | 77.3 | 91.1 |
2014 | 82.5 | 81.8 | 89.9 | 77.9 | 89.0 |
2015 | 81.1 | 80.8 | 90.4 | 77.7 | 89.7 |
2016 | 81.9 | 81.3 | 89.3 | 78.4 | 88.4 |
2017 | 81.8 | 81.9 | 92.5 | 74.8 | 87.4 |
2018 | 81.1 | 81.5 | 89.0 | 75.5 | 85.7 |
2019 | 81.5 | 81.1 | 91.5 | 76.7 | 85.9 |
2020 | 82.3 | 81.5 | 92.0 | 79.0 | 88.5 |
Note: The comparability of historical labor force data has been affected at various times by methodological and other changes in the Current Population Survey (CPS). Information about historical comparability is online at https://www.bls.gov/cps/documentation.htm#comp. The women's-to-men's earnings ratios shown here are calculated from the current-dollar median usual weekly earnings of full-time wage and salary workers in table 23. As of 2003, estimates for the race groups shown (White, Black or African American, and Asian) include people who selected that race group only; people who selected more than one race group are not included. Prior to 2003, people who reported more than one race were included in the group they identified as the main race. Asian data for 2000-2002 are for Asians and Pacific Islanders. As of 2003, Asians constitute a separate category. Data for Asians were not tabulated prior to 2000. People of Hispanic or Latino ethnicity may be of any race; estimates for the race groups include Hispanics. Dash indicates data not available. | |||||
Note: The comparability of historical labor force data has been affected at various times by methodological and other changes in the Current Population Survey (CPS). Information about historical comparability is online at https://www.bls.gov/cps/documentation.htm#comp. The women's-to-men's earnings ratios shown here are calculated from the current-dollar median usual weekly earnings of full-time wage and salary workers in table 23. As of 2003, estimates for the race groups shown (White, Black or African American, and Asian) include people who selected that race group only; people who selected more than one race group are not included. Prior to 2003, people who reported more than one race were included in the group they identified as the main race. Asian data for 2000-2002 are for Asians and Pacific Islanders. As of 2003, Asians constitute a separate category. Data for Asians were not tabulated prior to 2000. People of Hispanic or Latino ethnicity may be of any race; estimates for the race groups include Hispanics. Dash indicates data not available.
Source: U.S. Bureau of Labor Statistics.
| Table 14. Women's earnings as a percentage of men's, by educational attainment, for full-time wage and salary workers 25 years and older, 1979-2020 | |||||
|---|---|---|---|---|---|
| Year | Total, 25 years and older | Less than a high school diploma | High school graduates, no college | Some college or associate degree | Bachelor's degree and higher |
1979 | 62.1 | 60.3 | 60.1 | 64.1 | 66.7 |
1980 | 62.8 | 61.4 | 61.5 | 64.5 | 67.9 |
1981 | 62.6 | 61.2 | 61.0 | 65.6 | 66.9 |
1982 | 64.9 | 62.8 | 63.1 | 66.7 | 68.8 |
1983 | 65.8 | 64.8 | 63.4 | 68.2 | 71.2 |
1984 | 67.1 | 64.9 | 64.9 | 68.4 | 69.4 |
1985 | 66.8 | 64.3 | 65.8 | 67.2 | 70.2 |
1986 | 66.5 | 64.8 | 66.6 | 68.0 | 70.6 |
1987 | 67.3 | 66.0 | 68.1 | 69.8 | 71.4 |
1988 | 68.8 | 66.6 | 68.2 | 71.6 | 71.4 |
1989 | 70.2 | 66.8 | 67.6 | 73.3 | 71.9 |
1990 | 72.1 | 68.8 | 68.6 | 72.9 | 72.2 |
1991 | 74.0 | 71.6 | 69.8 | 72.6 | 73.6 |
1992 | 74.6 | 72.9 | 70.4 | 73.3 | 75.1 |
1993 | 74.8 | 73.9 | 71.3 | 73.8 | 75.8 |
1994 | 73.1 | 75.1 | 70.8 | 72.1 | 76.8 |
1995 | 72.8 | 75.5 | 70.2 | 71.6 | 76.2 |
1996 | 74.1 | 75.1 | 70.7 | 73.2 | 75.2 |
1997 | 75.1 | 75.3 | 70.7 | 73.9 | 75.0 |
1998 | 75.9 | 73.9 | 70.8 | 74.0 | 75.3 |
1999 | 74.4 | 73.4 | 69.8 | 73.4 | 75.7 |
2000 | 74.5 | 74.9 | 71.1 | 73.1 | 74.1 |
2001 | 75.4 | 75.4 | 72.7 | 71.9 | 73.7 |
2002 | 77.6 | 77.2 | 74.2 | 74.3 | 74.2 |
2003 | 78.5 | 76.7 | 75.5 | 75.7 | 73.6 |
2004 | 78.6 | 74.9 | 75.7 | 75.8 | 75.2 |
2005 | 79.4 | 74.9 | 75.6 | 76.6 | 75.7 |
2006 | 78.7 | 76.3 | 73.7 | 75.6 | 75.1 |
2007 | 78.5 | 76.7 | 74.3 | 75.2 | 75.0 |
2008 | 78.2 | 76.1 | 73.3 | 75.7 | 74.3 |
2009 | 78.7 | 76.4 | 75.7 | 75.4 | 73.1 |
2010 | 80.5 | 79.8 | 76.5 | 75.5 | 74.1 |
2011 | 81.0 | 80.9 | 76.9 | 76.8 | 74.9 |
2012 | 79.9 | 76.0 | 76.3 | 76.9 | 73.0 |
2013 | 81.1 | 80.0 | 78.3 | 76.6 | 74.8 |
2014 | 81.6 | 79.1 | 77.0 | 75.8 | 75.7 |
2015 | 80.4 | 80.4 | 77.2 | 75.2 | 74.9 |
2016 | 80.9 | 76.8 | 77.9 | 76.8 | 75.2 |
2017 | 81.3 | 76.5 | 76.5 | 76.3 | 76.4 |
2018 | 80.9 | 77.3 | 75.2 | 75.4 | 75.1 |
2019 | 80.8 | 76.7 | 75.0 | 74.4 | 76.0 |
2020 | 81.2 | 77.9 | 76.2 | 75.9 | 75.4 |
Note: The comparability of historical labor force data has been affected at various times by methodological and other changes in the Current Population Survey (CPS). Information about historical comparability is online at https://www.bls.gov/cps/documentation.htm#comp. The women's-to-men's earnings ratios shown here are calculated from the current-dollar median usual weekly earnings of full-time wage and salary workers 25 years and older in table 24. | |||||
Note: The comparability of historical labor force data has been affected at various times by methodological and other changes in the Current Population Survey (CPS). Information about historical comparability is online at https://www.bls.gov/cps/documentation.htm#comp. The women's-to-men's earnings ratios shown here are calculated from the current-dollar median usual weekly earnings of full-time wage and salary workers 25 years and older in table 24.
Source: U.S. Bureau of Labor Statistics.
| Table 15. Women's earnings as a percentage of men's, by age, for wage and salary workers paid hourly rates, 1979-2020 | ||||||||||
|---|---|---|---|---|---|---|---|---|---|---|
| Year | Total, 16 years and older | 16 to 24 years | 25 years and older | |||||||
| Total | 16 to 19 years | 20 to 24 years | Total | 25 to 34 years | 35 to 44 years | 45 to 54 years | 55 to 64 years | 65 years and older | ||
1979 | 64.1 | 81.8 | 95.0 | 75.9 | 58.3 | 63.3 | 55.8 | 54.1 | 56.9 | 87.6 |
1980 | 64.8 | 84.1 | 93.2 | 77.0 | 58.7 | 64.1 | 54.9 | 54.4 | 56.4 | 89.2 |
1981 | 65.1 | 86.1 | 96.7 | 80.0 | 60.3 | 66.7 | 57.5 | 54.1 | 56.2 | 88.1 |
1982 | 67.3 | 86.3 | 97.0 | 81.8 | 62.1 | 67.7 | 57.1 | 55.7 | 59.0 | 88.1 |
1983 | 69.4 | 87.2 | 96.7 | 84.4 | 62.9 | 70.3 | 57.6 | 56.7 | 58.0 | 87.6 |
1984 | 69.8 | 86.0 | 96.5 | 84.5 | 63.7 | 71.1 | 59.0 | 56.9 | 59.5 | 89.0 |
1985 | 70.0 | 85.7 | 96.3 | 87.2 | 64.7 | 72.4 | 60.3 | 57.8 | 60.4 | 88.8 |
1986 | 70.2 | 85.8 | 95.5 | 86.7 | 66.0 | 74.1 | 61.4 | 59.0 | 60.3 | 91.3 |
1987 | 72.1 | 85.9 | 93.9 | 86.1 | 67.2 | 74.3 | 62.9 | 61.3 | 62.0 | 91.2 |
1988 | 73.8 | 89.1 | 94.4 | 87.2 | 68.7 | 75.6 | 66.1 | 61.6 | 62.4 | 92.8 |
1989 | 75.4 | 90.7 | 93.4 | 86.9 | 69.8 | 78.0 | 67.0 | 63.4 | 63.8 | 87.1 |
1990 | 77.9 | 91.0 | 93.8 | 90.1 | 71.8 | 79.4 | 68.7 | 64.3 | 66.2 | 89.6 |
1991 | 78.6 | 91.0 | 97.9 | 91.7 | 73.5 | 80.4 | 70.4 | 65.0 | 68.9 | 92.6 |
1992 | 80.3 | 91.3 | 97.7 | 92.5 | 76.0 | 82.6 | 73.1 | 66.1 | 69.3 | 92.6 |
1993 | 80.4 | 91.7 | 97.1 | 94.2 | 77.3 | 83.6 | 73.1 | 67.3 | 69.0 | 92.1 |
1994 | 80.6 | 90.5 | 97.0 | 91.2 | 78.2 | 85.5 | 73.4 | 69.9 | 70.7 | 94.0 |
1995 | 80.8 | 90.9 | 96.1 | 89.3 | 76.1 | 83.7 | 72.6 | 70.8 | 71.4 | 94.2 |
1996 | 81.2 | 92.1 | 97.0 | 89.6 | 78.2 | 83.1 | 74.6 | 72.1 | 72.4 | 91.6 |
1997 | 80.8 | 92.2 | 96.6 | 91.2 | 78.8 | 82.7 | 75.7 | 72.3 | 70.5 | 98.1 |
1998 | 81.8 | 90.3 | 96.7 | 89.1 | 77.9 | 86.1 | 77.4 | 75.0 | 72.4 | 93.2 |
1999 | 83.8 | 92.7 | 96.8 | 89.9 | 79.4 | 83.9 | 76.9 | 72.7 | 76.4 | 95.4 |
2000 | 83.8 | 91.7 | 93.8 | 93.0 | 80.8 | 88.3 | 76.3 | 73.2 | 76.8 | 94.7 |
2001 | 85.2 | 90.5 | 95.8 | 89.7 | 79.2 | 85.8 | 75.0 | 76.1 | 80.2 | 90.4 |
2002 | 85.0 | 92.5 | 96.9 | 91.3 | 82.1 | 85.1 | 78.7 | 77.6 | 80.8 | 89.3 |
2003 | 84.8 | 93.2 | 97.6 | 91.0 | 83.1 | 87.5 | 79.1 | 79.0 | 78.4 | 90.3 |
2004 | 84.6 | 93.9 | 95.9 | 91.7 | 81.7 | 88.3 | 78.4 | 79.1 | 79.6 | 92.5 |
2005 | 84.8 | 92.6 | 96.0 | 92.4 | 83.2 | 89.2 | 79.6 | 80.2 | 80.2 | 97.8 |
2006 | 84.0 | 90.9 | 95.7 | 90.5 | 83.2 | 87.6 | 80.0 | 76.4 | 80.6 | 93.0 |
2007 | 84.8 | 89.3 | 95.4 | 90.4 | 81.7 | 87.4 | 81.5 | 79.6 | 79.2 | 92.2 |
2008 | 85.4 | 91.2 | 96.6 | 91.6 | 83.0 | 87.0 | 80.5 | 78.2 | 81.8 | 91.6 |
2009 | 85.5 | 93.1 | 97.1 | 92.0 | 84.7 | 90.6 | 80.7 | 77.0 | 84.5 | 92.6 |
2010 | 86.0 | 93.6 | 97.8 | 91.7 | 85.6 | 91.9 | 82.9 | 79.9 | 83.2 | 93.8 |
2011 | 86.8 | 94.6 | 97.5 | 92.5 | 86.7 | 92.0 | 83.8 | 81.5 | 82.2 | 91.5 |
2012 | 86.4 | 93.0 | 97.9 | 92.0 | 86.8 | 91.5 | 83.9 | 81.2 | 83.1 | 90.9 |
2013 | 86.6 | 92.3 | 96.7 | 94.0 | 87.5 | 91.1 | 84.9 | 81.2 | 84.1 | 94.9 |
2014 | 84.6 | 92.4 | 96.1 | 96.3 | 85.7 | 87.0 | 84.6 | 81.2 | 81.3 | 89.2 |
2015 | 85.6 | 95.1 | 97.5 | 93.5 | 87.8 | 91.0 | 85.7 | 84.3 | 82.1 | 89.5 |
2016 | 87.0 | 97.7 | 95.7 | 91.9 | 87.6 | 88.2 | 85.8 | 83.0 | 83.7 | 88.1 |
2017 | 89.2 | 93.5 | 97.1 | 92.6 | 87.2 | 92.4 | 83.4 | 80.9 | 81.8 | 93.0 |
2018 | 87.8 | 93.1 | 97.6 | 95.9 | 84.7 | 92.2 | 82.5 | 80.0 | 79.9 | 92.4 |
2019 | 88.6 | 95.0 | 95.5 | 92.0 | 86.3 | 90.8 | 83.0 | 83.0 | 81.7 | 93.5 |
2020 | 85.7 | 92.7 | 93.2 | 92.2 | 86.0 | 90.7 | 84.3 | 81.1 | 84.6 | 89.7 |
Note: The comparability of historical labor force data has been affected at various times by methodological and other changes in the Current Population Survey (CPS). Information on historical comparability is online at https://www.bls.gov/cps/documentation.htm#comp. The women's-to-men's earnings ratios shown here are calculated from the current-dollar median hourly earnings of workers paid hourly rates in table 25. | ||||||||||
Note: The comparability of historical labor force data has been affected at various times by methodological and other changes in the Current Population Survey (CPS). Information on historical comparability is online at https://www.bls.gov/cps/documentation.htm#comp. The women's-to-men's earnings ratios shown here are calculated from the current-dollar median hourly earnings of workers paid hourly rates in table 25.
Source: U.S. Bureau of Labor Statistics.
| Table 16. Women's earnings as a percentage of men's, by race and Hispanic or Latino ethnicity, for wage and salary workers paid hourly rates, 1979-2020 | |||||
|---|---|---|---|---|---|
| Year | Total, 16 years and older | White | Black or African American | Asian | Hispanic or Latino ethnicity |
1979 | 64.1 | 62.5 | 72.6 | - | 71.8 |
1980 | 64.8 | 63.6 | 74.9 | - | 75.1 |
1981 | 65.1 | 63.8 | 72.1 | - | 76.4 |
1982 | 67.3 | 66.0 | 75.2 | - | 75.6 |
1983 | 69.4 | 68.0 | 79.2 | - | 76.1 |
1984 | 69.8 | 68.6 | 79.1 | - | 77.0 |
1985 | 70.0 | 67.8 | 82.0 | - | 79.4 |
1986 | 70.2 | 68.8 | 78.7 | - | 80.8 |
1987 | 72.1 | 70.9 | 80.1 | - | 80.2 |
1988 | 73.8 | 72.7 | 80.8 | - | 81.1 |
1989 | 75.4 | 74.0 | 83.2 | - | 83.0 |
1990 | 77.9 | 75.6 | 84.5 | - | 86.1 |
1991 | 78.6 | 76.6 | 86.5 | - | 86.9 |
1992 | 80.3 | 78.6 | 87.1 | - | 88.3 |
1993 | 80.4 | 78.9 | 89.6 | - | 88.6 |
1994 | 80.6 | 79.7 | 87.5 | - | 89.3 |
1995 | 80.8 | 78.4 | 87.3 | - | 90.9 |
1996 | 81.2 | 79.6 | 88.0 | - | 88.8 |
1997 | 80.8 | 80.3 | 87.5 | - | 86.3 |
1998 | 81.8 | 81.8 | 86.9 | - | 87.6 |
1999 | 83.8 | 82.3 | 83.2 | - | 86.6 |
2000 | 83.8 | 83.0 | 88.8 | 90.5 | 87.3 |
2001 | 85.2 | 83.8 | 89.9 | 85.1 | 85.6 |
2002 | 85.0 | 83.8 | 92.3 | 91.7 | 86.1 |
2003 | 84.8 | 84.0 | 91.7 | 89.8 | 88.5 |
2004 | 84.6 | 84.0 | 91.3 | 88.8 | 90.2 |
2005 | 84.8 | 84.2 | 91.1 | 91.3 | 90.1 |
2006 | 84.0 | 83.6 | 88.5 | 90.7 | 87.6 |
2007 | 84.8 | 83.7 | 90.3 | 89.5 | 88.5 |
2008 | 85.4 | 84.5 | 89.9 | 87.3 | 85.1 |
2009 | 85.5 | 84.8 | 89.7 | 90.4 | 84.6 |
2010 | 86.0 | 85.0 | 92.1 | 88.0 | 86.2 |
2011 | 86.8 | 85.9 | 93.5 | 89.8 | 86.8 |
2012 | 86.4 | 85.3 | 92.0 | 90.1 | 85.4 |
2013 | 86.6 | 85.7 | 94.9 | 91.6 | 87.5 |
2014 | 84.6 | 83.3 | 94.8 | 90.2 | 86.6 |
2015 | 85.6 | 85.9 | 92.4 | 92.8 | 85.8 |
2016 | 87.0 | 87.2 | 92.6 | 93.6 | 85.2 |
2017 | 89.2 | 87.8 | 94.1 | 85.5 | 84.1 |
2018 | 87.8 | 86.3 | 91.6 | 89.6 | 85.3 |
2019 | 88.6 | 87.3 | 93.5 | 88.8 | 90.1 |
2020 | 85.7 | 85.2 | 94.1 | 91.8 | 90.4 |
Note: The comparability of historical labor force data has been affected at various times by methodological and other changes in the Current Population Survey (CPS). Information about historical comparability is online at https://www.bls.gov/cps/documentation.htm#comp. The women's-to-men's earnings ratios shown here are calculated from the current-dollar median hourly earnings of wage and salary workers paid hourly rates in table 26. As of 2003, estimates for the race groups shown (White, Black or African American, and Asian) include people who selected that race group only; people who selected more than one race group are not included. Prior to 2003, people who reported more than one race were included in the group they identified as the main race. Asian data for 2000-2002 are for Asians and Pacific Islanders. As of 2003, Asians constitute a separate category. Data for Asians were not tabulated prior to 2000. People of Hispanic or Latino ethnicity may be of any race; estimates for the race groups include Hispanics. Dash indicates data not available. | |||||
Note: The comparability of historical labor force data has been affected at various times by methodological and other changes in the Current Population Survey (CPS). Information about historical comparability is online at https://www.bls.gov/cps/documentation.htm#comp. The women's-to-men's earnings ratios shown here are calculated from the current-dollar median hourly earnings of wage and salary workers paid hourly rates in table 26. As of 2003, estimates for the race groups shown (White, Black or African American, and Asian) include people who selected that race group only; people who selected more than one race group are not included. Prior to 2003, people who reported more than one race were included in the group they identified as the main race. Asian data for 2000-2002 are for Asians and Pacific Islanders. As of 2003, Asians constitute a separate category. Data for Asians were not tabulated prior to 2000. People of Hispanic or Latino ethnicity may be of any race; estimates for the race groups include Hispanics. Dash indicates data not available.
Source: U.S. Bureau of Labor Statistics.
| Table 17. Inflation-adjusted median usual weekly earnings, by age, for full-time wage and salary workers, 1979-2020 annual averages [In constant 2020 dollars] | ||||||||||
|---|---|---|---|---|---|---|---|---|---|---|
| Year | Total, 16 years and older | 16 to 24 years | 25 years and older | |||||||
| Total | 16 to 19 years | 20 to 24 years | Total | 25 to 34 years | 35 to 44 years | 45 to 54 years | 55 to 64 years | 65 years and older | ||
Total | ||||||||||
1979 | $803 | $573 | $480 | $620 | $883 | $850 | $933 | $920 | $873 | $660 |
1980 | 787 | 562 | 462 | 601 | 859 | 829 | 907 | 895 | 856 | 610 |
1981 | 778 | 548 | 441 | 584 | 844 | 811 | 893 | 877 | 847 | 608 |
1982 | 780 | 537 | 424 | 568 | 845 | 804 | 915 | 891 | 840 | 654 |
1983 | 777 | 524 | 407 | 553 | 851 | 797 | 918 | 911 | 859 | 648 |
1984 | 776 | 517 | 402 | 550 | 862 | 798 | 926 | 917 | 871 | 648 |
1985 | 791 | 515 | 400 | 552 | 871 | 802 | 933 | 920 | 876 | 683 |
1986 | 812 | 525 | 403 | 561 | 885 | 814 | 948 | 941 | 898 | 674 |
1987 | 817 | 531 | 406 | 566 | 880 | 814 | 950 | 937 | 884 | 677 |
1988 | 812 | 525 | 414 | 561 | 873 | 808 | 949 | 956 | 884 | 681 |
1989 | 806 | 523 | 412 | 558 | 863 | 796 | 954 | 954 | 871 | 675 |
1990 | 794 | 518 | 403 | 549 | 865 | 784 | 936 | 942 | 881 | 661 |
1991 | 792 | 515 | 396 | 541 | 868 | 771 | 926 | 942 | 872 | 708 |
1992 | 799 | 501 | 385 | 526 | 869 | 766 | 913 | 947 | 877 | 686 |
1993 | 812 | 499 | 379 | 526 | 869 | 772 | 915 | 959 | 871 | 696 |
1994 | 809 | 496 | 383 | 520 | 867 | 761 | 931 | 981 | 868 | 666 |
1995 | 810 | 494 | 391 | 518 | 863 | 763 | 931 | 985 | 870 | 658 |
1996 | 807 | 491 | 395 | 514 | 857 | 763 | 921 | 979 | 881 | 633 |
1997 | 811 | 494 | 406 | 518 | 871 | 776 | 934 | 979 | 900 | 634 |
1998 | 833 | 508 | 427 | 540 | 911 | 799 | 951 | 987 | 943 | 645 |
1999 | 855 | 531 | 438 | 565 | 922 | 807 | 952 | 1,016 | 941 | 629 |
2000 | 869 | 544 | 448 | 578 | 919 | 828 | 943 | 1,009 | 935 | 698 |
2001 | 874 | 550 | 447 | 578 | 924 | 845 | 963 | 1,016 | 935 | 716 |
2002 | 877 | 550 | 440 | 576 | 932 | 853 | 964 | 1,019 | 973 | 724 |
2003 | 874 | 546 | 439 | 567 | 934 | 838 | 969 | 1,020 | 999 | 728 |
2004 | 876 | 536 | 424 | 558 | 938 | 830 | 979 | 1,021 | 996 | 769 |
2005 | 865 | 527 | 422 | 546 | 924 | 810 | 971 | 993 | 985 | 756 |
2006 | 864 | 526 | 417 | 544 | 924 | 799 | 963 | 995 | 985 | 750 |
2007 | 870 | 531 | 422 | 563 | 924 | 805 | 962 | 989 | 1,005 | 757 |
2008 | 870 | 534 | 420 | 563 | 917 | 802 | 969 | 990 | 994 | 776 |
2009 | 894 | 534 | 416 | 561 | 936 | 820 | 988 | 1,013 | 1,017 | 827 |
2010 | 888 | 514 | 413 | 540 | 930 | 811 | 980 | 1,004 | 1,023 | 813 |
2011 | 872 | 507 | 406 | 527 | 919 | 799 | 965 | 999 | 1,016 | 856 |
2012 | 868 | 502 | 402 | 524 | 921 | 799 | 969 | 992 | 1,014 | 855 |
2013 | 864 | 506 | 415 | 526 | 921 | 788 | 973 | 983 | 1,007 | 892 |
2014 | 865 | 522 | 414 | 537 | 918 | 794 | 964 | 984 | 997 | 902 |
2015 | 884 | 532 | 425 | 548 | 940 | 803 | 984 | 1,009 | 1,013 | 954 |
2016 | 898 | 540 | 437 | 553 | 955 | 810 | 1,008 | 1,030 | 1,027 | 934 |
2017 | 908 | 548 | 448 | 570 | 958 | 816 | 1,018 | 1,032 | 1,029 | 960 |
2018 | 913 | 565 | 463 | 594 | 961 | 833 | 1,016 | 1,033 | 1,025 | 973 |
2019 | 928 | 588 | 487 | 605 | 981 | 856 | 1,048 | 1,046 | 1,029 | 947 |
2020 | 984 | 606 | 497 | 624 | 1,029 | 904 | 1,106 | 1,129 | 1,096 | 999 |
Women | ||||||||||
1979 | $607 | $513 | $440 | $537 | $650 | $663 | $653 | $640 | $630 | $567 |
1980 | 604 | 502 | 435 | 526 | 640 | 655 | 643 | 628 | 616 | 526 |
1981 | 600 | 493 | 422 | 523 | 638 | 655 | 652 | 616 | 608 | 518 |
1982 | 618 | 496 | 408 | 519 | 659 | 667 | 667 | 651 | 633 | 545 |
1983 | 625 | 491 | 392 | 514 | 665 | 675 | 675 | 655 | 638 | 526 |
1984 | 631 | 483 | 386 | 507 | 674 | 679 | 695 | 664 | 643 | 521 |
1985 | 637 | 485 | 382 | 508 | 680 | 680 | 706 | 671 | 655 | 556 |
1986 | 658 | 495 | 385 | 523 | 697 | 692 | 722 | 697 | 670 | 579 |
1987 | 662 | 496 | 376 | 528 | 701 | 690 | 736 | 707 | 672 | 570 |
1988 | 665 | 496 | 388 | 530 | 707 | 690 | 747 | 715 | 669 | 591 |
1989 | 663 | 497 | 398 | 525 | 709 | 687 | 747 | 721 | 673 | 590 |
1990 | 667 | 489 | 382 | 518 | 711 | 686 | 751 | 726 | 671 | 578 |
1991 | 680 | 494 | 381 | 520 | 719 | 690 | 757 | 740 | 675 | 593 |
1992 | 690 | 485 | 372 | 508 | 726 | 693 | 759 | 757 | 682 | 595 |
1993 | 696 | 483 | 363 | 512 | 735 | 699 | 770 | 779 | 699 | 593 |
1994 | 692 | 478 | 366 | 503 | 730 | 688 | 776 | 780 | 690 | 582 |
1995 | 687 | 465 | 364 | 492 | 724 | 682 | 766 | 785 | 682 | 597 |
1996 | 689 | 468 | 367 | 491 | 731 | 684 | 763 | 792 | 692 | 550 |
1997 | 695 | 471 | 387 | 494 | 745 | 689 | 777 | 798 | 698 | 561 |
1998 | 726 | 486 | 396 | 508 | 772 | 718 | 793 | 822 | 758 | 557 |
1999 | 737 | 505 | 414 | 534 | 774 | 732 | 783 | 832 | 766 | 576 |
2000 | 744 | 519 | 427 | 552 | 778 | 744 | 786 | 851 | 766 | 591 |
2001 | 751 | 518 | 422 | 550 | 796 | 751 | 802 | 861 | 786 | 572 |
2002 | 763 | 530 | 426 | 556 | 820 | 765 | 824 | 869 | 828 | 620 |
2003 | 779 | 523 | 422 | 546 | 824 | 770 | 832 | 859 | 848 | 614 |
2004 | 787 | 515 | 402 | 537 | 823 | 771 | 835 | 859 | 845 | 657 |
2005 | 777 | 506 | 404 | 526 | 813 | 761 | 825 | 855 | 849 | 653 |
2006 | 772 | 508 | 393 | 532 | 807 | 750 | 830 | 848 | 847 | 656 |
2007 | 768 | 512 | 398 | 533 | 809 | 747 | 836 | 847 | 850 | 668 |
2008 | 769 | 506 | 388 | 536 | 807 | 751 | 822 | 852 | 857 | 678 |
2009 | 794 | 513 | 391 | 538 | 831 | 767 | 857 | 861 | 879 | 728 |
2010 | 795 | 502 | 400 | 522 | 837 | 771 | 869 | 868 | 875 | 715 |
2011 | 789 | 486 | 378 | 505 | 828 | 764 | 847 | 858 | 864 | 766 |
2012 | 781 | 470 | 373 | 485 | 821 | 753 | 844 | 843 | 866 | 754 |
2013 | 786 | 471 | 390 | 492 | 824 | 741 | 854 | 847 | 867 | 769 |
2014 | 787 | 493 | 391 | 512 | 823 | 743 | 854 | 853 | 853 | 810 |
2015 | 793 | 492 | 398 | 511 | 832 | 754 | 879 | 873 | 857 | 809 |
2016 | 808 | 524 | 419 | 539 | 846 | 761 | 905 | 902 | 876 | 808 |
2017 | 813 | 527 | 424 | 543 | 855 | 765 | 908 | 903 | 904 | 826 |
2018 | 813 | 538 | 434 | 563 | 856 | 773 | 903 | 903 | 879 | 836 |
2019 | 831 | 547 | 432 | 570 | 876 | 798 | 931 | 915 | 891 | 825 |
2020 | 891 | 589 | 464 | 606 | 929 | 852 | 978 | 977 | 955 | 897 |
Men | ||||||||||
1979 | $973 | $653 | $517 | $703 | $1,047 | $983 | $1,120 | $1,127 | $1,040 | $730 |
1980 | 940 | 625 | 486 | 673 | 1,018 | 943 | 1,102 | 1,102 | 1,036 | 688 |
1981 | 932 | 597 | 460 | 649 | 1,019 | 932 | 1,088 | 1,085 | 1,033 | 729 |
1982 | 941 | 581 | 439 | 630 | 1,016 | 925 | 1,090 | 1,083 | 1,031 | 775 |
1983 | 940 | 553 | 417 | 600 | 1,010 | 921 | 1,097 | 1,102 | 1,032 | 764 |
1984 | 933 | 550 | 414 | 595 | 1,005 | 910 | 1,121 | 1,119 | 1,045 | 781 |
1985 | 936 | 554 | 421 | 593 | 1,018 | 906 | 1,120 | 1,124 | 1,074 | 844 |
1986 | 948 | 557 | 421 | 597 | 1,048 | 910 | 1,129 | 1,145 | 1,095 | 810 |
1987 | 948 | 561 | 428 | 600 | 1,041 | 900 | 1,114 | 1,135 | 1,081 | 830 |
1988 | 947 | 553 | 432 | 589 | 1,027 | 888 | 1,091 | 1,158 | 1,074 | 833 |
1989 | 945 | 547 | 422 | 586 | 1,010 | 877 | 1,095 | 1,149 | 1,053 | 794 |
1990 | 927 | 543 | 420 | 574 | 987 | 865 | 1,079 | 1,139 | 1,052 | 776 |
1991 | 916 | 530 | 407 | 558 | 972 | 851 | 1,071 | 1,138 | 1,046 | 868 |
1992 | 909 | 515 | 396 | 539 | 973 | 846 | 1,054 | 1,151 | 1,051 | 764 |
1993 | 903 | 510 | 391 | 536 | 982 | 842 | 1,055 | 1,156 | 1,037 | 798 |
1994 | 905 | 510 | 395 | 532 | 998 | 830 | 1,069 | 1,163 | 1,045 | 764 |
1995 | 910 | 513 | 413 | 533 | 995 | 829 | 1,056 | 1,159 | 1,054 | 746 |
1996 | 918 | 506 | 414 | 529 | 987 | 822 | 1,041 | 1,150 | 1,059 | 786 |
1997 | 934 | 511 | 423 | 545 | 992 | 831 | 1,050 | 1,150 | 1,079 | 729 |
1998 | 952 | 532 | 447 | 568 | 1,018 | 866 | 1,078 | 1,166 | 1,113 | 768 |
1999 | 963 | 555 | 453 | 590 | 1,040 | 899 | 1,093 | 1,188 | 1,129 | 732 |
2000 | 967 | 566 | 462 | 596 | 1,045 | 902 | 1,098 | 1,163 | 1,109 | 787 |
2001 | 982 | 573 | 468 | 598 | 1,056 | 905 | 1,106 | 1,172 | 1,114 | 828 |
2002 | 980 | 564 | 450 | 592 | 1,056 | 905 | 1,095 | 1,165 | 1,157 | 841 |
2003 | 980 | 561 | 453 | 581 | 1,049 | 886 | 1,093 | 1,176 | 1,166 | 863 |
2004 | 979 | 549 | 437 | 573 | 1,047 | 878 | 1,104 | 1,177 | 1,158 | 880 |
2005 | 959 | 543 | 438 | 560 | 1,024 | 855 | 1,092 | 1,133 | 1,135 | 855 |
2006 | 956 | 538 | 448 | 560 | 1,026 | 851 | 1,076 | 1,154 | 1,161 | 847 |
2007 | 959 | 554 | 447 | 591 | 1,030 | 860 | 1,093 | 1,138 | 1,168 | 859 |
2008 | 961 | 555 | 445 | 580 | 1,033 | 848 | 1,102 | 1,137 | 1,136 | 907 |
2009 | 990 | 554 | 430 | 579 | 1,056 | 865 | 1,108 | 1,169 | 1,167 | 956 |
2010 | 980 | 527 | 422 | 556 | 1,039 | 849 | 1,088 | 1,134 | 1,164 | 944 |
2011 | 960 | 525 | 427 | 542 | 1,022 | 827 | 1,078 | 1,129 | 1,150 | 947 |
2012 | 965 | 529 | 421 | 545 | 1,028 | 834 | 1,081 | 1,123 | 1,136 | 972 |
2013 | 958 | 533 | 434 | 548 | 1,016 | 829 | 1,065 | 1,107 | 1,126 | 1,043 |
2014 | 953 | 539 | 429 | 555 | 1,009 | 826 | 1,055 | 1,106 | 1,117 | 1,031 |
2015 | 978 | 557 | 445 | 570 | 1,035 | 842 | 1,074 | 1,137 | 1,163 | 1,096 |
2016 | 987 | 552 | 452 | 564 | 1,045 | 857 | 1,086 | 1,160 | 1,189 | 1,070 |
2017 | 994 | 578 | 485 | 602 | 1,052 | 867 | 1,121 | 1,165 | 1,159 | 1,073 |
2018 | 1,003 | 593 | 486 | 610 | 1,058 | 889 | 1,135 | 1,172 | 1,172 | 1,082 |
2019 | 1,019 | 614 | 512 | 631 | 1,083 | 908 | 1,163 | 1,183 | 1,180 | 1,079 |
2020 | 1,082 | 622 | 513 | 648 | 1,144 | 952 | 1,205 | 1,260 | 1,228 | 1,115 |
Note: The comparability of historical labor force data has been affected at various times by methodological and other changes in the Current Population Survey (CPS). Information about historical comparability is online at https://www.bls.gov/cps/documentation.htm#comp. The Consumer Price Index research series using current methods (CPI-U-RS) is used to convert current dollars to constant (inflation-adjusted) dollars. See the technical notes section. | ||||||||||
Note: The comparability of historical labor force data has been affected at various times by methodological and other changes in the Current Population Survey (CPS). Information about historical comparability is online at https://www.bls.gov/cps/documentation.htm#comp. The Consumer Price Index research series using current methods (CPI-U-RS) is used to convert current dollars to constant (inflation-adjusted) dollars. See the technical notes section.
Source: U.S. Bureau of Labor Statistics.
| Table 18. Inflation-adjusted median usual weekly earnings, by race and Hispanic or Latino ethnicity, for full-time wage and salary workers, 1979-2020 annual averages [In constant 2020 dollars] | |||||
|---|---|---|---|---|---|
| Year | Total, 16 years and older | White | Black or African American | Asian | Hispanic or Latino ethnicity |
Total | |||||
1979 | $803 | $827 | $663 | - | $647 |
1980 | 787 | 808 | 637 | - | 628 |
1981 | 778 | 797 | 644 | - | 611 |
1982 | 780 | 801 | 633 | - | 620 |
1983 | 777 | 794 | 648 | - | 620 |
1984 | 776 | 800 | 640 | - | 617 |
1985 | 791 | 818 | 637 | - | 621 |
1986 | 812 | 839 | 658 | - | 627 |
1987 | 817 | 838 | 657 | - | 622 |
1988 | 812 | 833 | 662 | - | 612 |
1989 | 806 | 826 | 644 | - | 602 |
1990 | 794 | 817 | 634 | - | 586 |
1991 | 792 | 822 | 647 | - | 580 |
1992 | 799 | 831 | 648 | - | 583 |
1993 | 812 | 841 | 653 | - | 586 |
1994 | 809 | 839 | 643 | - | 562 |
1995 | 810 | 836 | 648 | - | 557 |
1996 | 807 | 834 | 638 | - | 558 |
1997 | 811 | 837 | 645 | - | 566 |
1998 | 833 | 868 | 678 | - | 589 |
1999 | 855 | 893 | 693 | - | 600 |
2000 | 869 | 890 | 715 | $928 | 602 |
2001 | 874 | 894 | 720 | 937 | 611 |
2002 | 877 | 899 | 719 | 949 | 612 |
2003 | 874 | 897 | 725 | 977 | 621 |
2004 | 876 | 902 | 721 | 973 | 626 |
2005 | 865 | 892 | 691 | 1,000 | 625 |
2006 | 864 | 888 | 713 | 1,009 | 625 |
2007 | 870 | 896 | 712 | 1,039 | 630 |
2008 | 870 | 894 | 710 | 1,037 | 637 |
2009 | 894 | 915 | 727 | 1,064 | 654 |
2010 | 888 | 910 | 727 | 1,017 | 636 |
2011 | 872 | 894 | 709 | 999 | 633 |
2012 | 868 | 895 | 702 | 1,040 | 642 |
2013 | 864 | 893 | 700 | 1,049 | 644 |
2014 | 865 | 893 | 699 | 1,043 | 650 |
2015 | 884 | 913 | 701 | 1,085 | 660 |
2016 | 898 | 930 | 731 | 1,101 | 673 |
2017 | 908 | 940 | 720 | 1,101 | 692 |
2018 | 913 | 944 | 715 | 1,129 | 701 |
2019 | 928 | 956 | 744 | 1,188 | 715 |
2020 | 984 | 1,003 | 794 | 1,310 | 758 |
Women | |||||
1979 | $607 | $613 | $563 | - | $523 |
1980 | 604 | 610 | 556 | - | 517 |
1981 | 600 | 605 | 564 | - | 521 |
1982 | 618 | 625 | 561 | - | 525 |
1983 | 625 | 630 | 576 | - | 533 |
1984 | 631 | 638 | 574 | - | 531 |
1985 | 637 | 646 | 579 | - | 529 |
1986 | 658 | 665 | 597 | - | 545 |
1987 | 662 | 670 | 603 | - | 548 |
1988 | 665 | 671 | 608 | - | 549 |
1989 | 663 | 675 | 608 | - | 543 |
1990 | 667 | 680 | 593 | - | 536 |
1991 | 680 | 693 | 600 | - | 543 |
1992 | 690 | 702 | 608 | - | 548 |
1993 | 696 | 710 | 616 | - | 554 |
1994 | 692 | 707 | 600 | - | 529 |
1995 | 687 | 702 | 601 | - | 516 |
1996 | 689 | 705 | 596 | - | 521 |
1997 | 695 | 716 | 605 | - | 513 |
1998 | 726 | 745 | 637 | - | 537 |
1999 | 737 | 752 | 637 | - | 542 |
2000 | 744 | 757 | 647 | $825 | 552 |
2001 | 751 | 765 | 666 | 826 | 569 |
2002 | 763 | 789 | 683 | 817 | 573 |
2003 | 779 | 800 | 693 | 843 | 578 |
2004 | 787 | 802 | 694 | 842 | 576 |
2005 | 777 | 792 | 663 | 883 | 570 |
2006 | 772 | 784 | 668 | 900 | 566 |
2007 | 768 | 783 | 667 | 915 | 592 |
2008 | 769 | 788 | 667 | 907 | 604 |
2009 | 794 | 809 | 704 | 942 | 615 |
2010 | 795 | 813 | 704 | 919 | 604 |
2011 | 789 | 811 | 686 | 866 | 597 |
2012 | 781 | 802 | 677 | 870 | 589 |
2013 | 786 | 804 | 675 | 912 | 602 |
2014 | 787 | 803 | 668 | 920 | 600 |
2015 | 793 | 812 | 672 | 958 | 619 |
2016 | 808 | 826 | 691 | 973 | 632 |
2017 | 813 | 839 | 694 | 954 | 637 |
2018 | 813 | 842 | 674 | 966 | 636 |
2019 | 831 | 850 | 713 | 1,037 | 650 |
2020 | 891 | 905 | 764 | 1,143 | 705 |
Men | |||||
1979 | $973 | $993 | $757 | - | $730 |
1980 | 940 | 961 | 733 | - | 703 |
1981 | 932 | 959 | 734 | - | 688 |
1982 | 941 | 969 | 718 | - | 695 |
1983 | 940 | 960 | 730 | - | 680 |
1984 | 933 | 955 | 721 | - | 683 |
1985 | 936 | 961 | 701 | - | 680 |
1986 | 948 | 980 | 722 | - | 676 |
1987 | 948 | 983 | 714 | - | 668 |
1988 | 947 | 981 | 734 | - | 650 |
1989 | 945 | 974 | 703 | - | 636 |
1990 | 927 | 952 | 696 | - | 613 |
1991 | 916 | 941 | 697 | - | 600 |
1992 | 909 | 933 | 690 | - | 615 |
1993 | 903 | 927 | 694 | - | 612 |
1994 | 905 | 948 | 693 | - | 594 |
1995 | 910 | 958 | 695 | - | 592 |
1996 | 918 | 956 | 679 | - | 586 |
1997 | 934 | 960 | 697 | - | 598 |
1998 | 952 | 979 | 745 | - | 621 |
1999 | 963 | 994 | 760 | - | 632 |
2000 | 967 | 998 | 769 | $1,033 | 629 |
2001 | 982 | 1,010 | 776 | 1,073 | 645 |
2002 | 980 | 1,013 | 756 | 1,091 | 651 |
2003 | 980 | 1,008 | 783 | 1,089 | 654 |
2004 | 979 | 1,005 | 782 | 1,102 | 659 |
2005 | 959 | 987 | 742 | 1,096 | 649 |
2006 | 956 | 979 | 761 | 1,135 | 650 |
2007 | 959 | 986 | 751 | 1,171 | 651 |
2008 | 961 | 994 | 747 | 1,164 | 673 |
2009 | 990 | 1,022 | 751 | 1,151 | 688 |
2010 | 980 | 1,011 | 753 | 1,113 | 666 |
2011 | 960 | 987 | 753 | 1,119 | 659 |
2012 | 965 | 993 | 751 | 1,192 | 669 |
2013 | 958 | 984 | 739 | 1,179 | 661 |
2014 | 953 | 981 | 744 | 1,182 | 674 |
2015 | 978 | 1,005 | 743 | 1,234 | 690 |
2016 | 987 | 1,016 | 775 | 1,242 | 715 |
2017 | 994 | 1,025 | 750 | 1,275 | 729 |
2018 | 1,003 | 1,033 | 758 | 1,279 | 742 |
2019 | 1,019 | 1,049 | 778 | 1,352 | 756 |
2020 | 1,082 | 1,110 | 830 | 1,447 | 797 |
Note: The comparability of historical labor force data has been affected at various times by methodological and other changes in the Current Population Survey (CPS). Information about historical comparability is online at https://www.bls.gov/cps/documentation.htm#comp. As of 2003, estimates for the race groups shown (White, Black or African American, and Asian) include people who selected that race group only; people who selected more than one race group are not included. Prior to 2003, people who reported more than one race were included in the group they identified as the main race. Asian data for 2000-2002 are for Asians and Pacific Islanders. As of 2003, Asians constitute a separate category. Data for Asians were not tabulated prior to 2000. People of Hispanic or Latino ethnicity may be of any race; estimates for the race groups include Hispanics. The Consumer Price Index research series using current methods (CPI-U-RS) is used to convert current dollars to constant (inflation-adjusted) dollars. See the technical notes section. Dash indicates data not available. | |||||
Note: The comparability of historical labor force data has been affected at various times by methodological and other changes in the Current Population Survey (CPS). Information about historical comparability is online at https://www.bls.gov/cps/documentation.htm#comp. As of 2003, estimates for the race groups shown (White, Black or African American, and Asian) include people who selected that race group only; people who selected more than one race group are not included. Prior to 2003, people who reported more than one race were included in the group they identified as the main race. Asian data for 2000-2002 are for Asians and Pacific Islanders. As of 2003, Asians constitute a separate category. Data for Asians were not tabulated prior to 2000. People of Hispanic or Latino ethnicity may be of any race; estimates for the race groups include Hispanics. The Consumer Price Index research series using current methods (CPI-U-RS) is used to convert current dollars to constant (inflation-adjusted) dollars. See the technical notes section. Dash indicates data not available.
Source: U.S. Bureau of Labor Statistics.
| Table 19. Inflation-adjusted median usual weekly earnings, by educational attainment, for full-time wage and salary workers 25 years and older, 1979-2020 annual averages [In constant 2020 dollars] | |||||
|---|---|---|---|---|---|
| Year | Total, 25 years and older | Less than a high school diploma | High school graduates, no college | Some college or associate degree | Bachelor's degree and higher |
Total | |||||
1979 | $883 | $700 | $830 | $940 | $1,147 |
1980 | 859 | 667 | 799 | 913 | 1,129 |
1981 | 844 | 658 | 784 | 888 | 1,115 |
1982 | 845 | 641 | 780 | 907 | 1,132 |
1983 | 851 | 635 | 772 | 901 | 1,144 |
1984 | 862 | 626 | 769 | 910 | 1,157 |
1985 | 871 | 621 | 766 | 917 | 1,163 |
1986 | 885 | 629 | 778 | 925 | 1,188 |
1987 | 880 | 620 | 777 | 919 | 1,231 |
1988 | 873 | 608 | 776 | 907 | 1,234 |
1989 | 863 | 600 | 758 | 913 | 1,230 |
1990 | 865 | 584 | 744 | 917 | 1,229 |
1991 | 868 | 571 | 738 | 909 | 1,238 |
1992 | 869 | 564 | 731 | 878 | 1,263 |
1993 | 869 | 556 | 735 | 874 | 1,265 |
1994 | 867 | 532 | 730 | 865 | 1,270 |
1995 | 863 | 523 | 731 | 860 | 1,264 |
1996 | 857 | 522 | 730 | 853 | 1,249 |
1997 | 871 | 518 | 744 | 863 | 1,256 |
1998 | 911 | 537 | 763 | 889 | 1,307 |
1999 | 922 | 539 | 763 | 903 | 1,340 |
2000 | 919 | 546 | 762 | 899 | 1,344 |
2001 | 924 | 560 | 762 | 905 | 1,350 |
2002 | 932 | 560 | 772 | 908 | 1,358 |
2003 | 934 | 559 | 781 | 901 | 1,360 |
2004 | 938 | 551 | 788 | 908 | 1,354 |
2005 | 924 | 543 | 774 | 890 | 1,345 |
2006 | 924 | 539 | 766 | 891 | 1,337 |
2007 | 924 | 536 | 756 | 881 | 1,342 |
2008 | 917 | 546 | 745 | 870 | 1,343 |
2009 | 936 | 549 | 757 | 878 | 1,375 |
2010 | 930 | 528 | 744 | 873 | 1,360 |
2011 | 919 | 520 | 736 | 852 | 1,326 |
2012 | 921 | 532 | 737 | 846 | 1,316 |
2013 | 921 | 526 | 725 | 833 | 1,330 |
2014 | 918 | 534 | 731 | 833 | 1,305 |
2015 | 940 | 539 | 741 | 833 | 1,344 |
2016 | 955 | 544 | 746 | 840 | 1,358 |
2017 | 958 | 549 | 752 | 843 | 1,351 |
2018 | 961 | 570 | 753 | 852 | 1,365 |
2019 | 981 | 599 | 755 | 866 | 1,384 |
2020 | 1,029 | 619 | 781 | 903 | 1,421 |
Women | |||||
1979 | $650 | $507 | $617 | $703 | $880 |
1980 | 640 | 492 | 604 | 694 | 871 |
1981 | 638 | 479 | 595 | 699 | 871 |
1982 | 659 | 475 | 610 | 708 | 894 |
1983 | 665 | 484 | 610 | 715 | 916 |
1984 | 674 | 476 | 617 | 726 | 929 |
1985 | 680 | 464 | 616 | 729 | 952 |
1986 | 697 | 471 | 627 | 747 | 986 |
1987 | 701 | 467 | 629 | 758 | 1,017 |
1988 | 707 | 466 | 629 | 759 | 1,023 |
1989 | 709 | 467 | 614 | 766 | 1,024 |
1990 | 711 | 462 | 607 | 761 | 1,031 |
1991 | 719 | 465 | 610 | 760 | 1,045 |
1992 | 726 | 465 | 612 | 739 | 1,078 |
1993 | 735 | 465 | 614 | 747 | 1,081 |
1994 | 730 | 445 | 608 | 733 | 1,099 |
1995 | 724 | 443 | 602 | 723 | 1,090 |
1996 | 731 | 442 | 601 | 728 | 1,082 |
1997 | 745 | 444 | 610 | 740 | 1,084 |
1998 | 772 | 451 | 631 | 758 | 1,126 |
1999 | 774 | 452 | 631 | 760 | 1,153 |
2000 | 778 | 459 | 633 | 762 | 1,140 |
2001 | 796 | 463 | 650 | 762 | 1,152 |
2002 | 820 | 469 | 661 | 784 | 1,167 |
2003 | 824 | 464 | 669 | 790 | 1,173 |
2004 | 823 | 459 | 670 | 793 | 1,181 |
2005 | 813 | 453 | 655 | 780 | 1,173 |
2006 | 807 | 461 | 644 | 775 | 1,165 |
2007 | 809 | 462 | 641 | 762 | 1,166 |
2008 | 807 | 455 | 627 | 757 | 1,151 |
2009 | 831 | 462 | 655 | 762 | 1,173 |
2010 | 837 | 461 | 646 | 759 | 1,172 |
2011 | 828 | 456 | 639 | 744 | 1,151 |
2012 | 821 | 436 | 634 | 745 | 1,131 |
2013 | 824 | 445 | 638 | 732 | 1,161 |
2014 | 823 | 447 | 632 | 723 | 1,148 |
2015 | 832 | 457 | 640 | 726 | 1,163 |
2016 | 846 | 456 | 646 | 742 | 1,188 |
2017 | 855 | 472 | 644 | 739 | 1,194 |
2018 | 856 | 484 | 635 | 739 | 1,180 |
2019 | 876 | 500 | 641 | 746 | 1,210 |
2020 | 929 | 525 | 671 | 779 | 1,239 |
Men | |||||
1979 | $1,047 | $840 | $1,027 | $1,097 | $1,320 |
1980 | 1,018 | 802 | 982 | 1,075 | 1,282 |
1981 | 1,019 | 784 | 975 | 1,066 | 1,301 |
1982 | 1,016 | 757 | 966 | 1,062 | 1,300 |
1983 | 1,010 | 747 | 963 | 1,047 | 1,285 |
1984 | 1,005 | 733 | 950 | 1,062 | 1,338 |
1985 | 1,018 | 722 | 936 | 1,085 | 1,356 |
1986 | 1,048 | 726 | 941 | 1,097 | 1,398 |
1987 | 1,041 | 707 | 924 | 1,085 | 1,426 |
1988 | 1,027 | 700 | 922 | 1,061 | 1,432 |
1989 | 1,010 | 699 | 909 | 1,044 | 1,424 |
1990 | 987 | 672 | 884 | 1,044 | 1,428 |
1991 | 972 | 649 | 874 | 1,046 | 1,420 |
1992 | 973 | 637 | 869 | 1,007 | 1,436 |
1993 | 982 | 630 | 862 | 1,012 | 1,427 |
1994 | 998 | 593 | 860 | 1,017 | 1,432 |
1995 | 995 | 587 | 858 | 1,008 | 1,430 |
1996 | 987 | 588 | 850 | 995 | 1,440 |
1997 | 992 | 589 | 863 | 1,002 | 1,445 |
1998 | 1,018 | 610 | 890 | 1,024 | 1,495 |
1999 | 1,040 | 615 | 903 | 1,036 | 1,522 |
2000 | 1,045 | 612 | 891 | 1,042 | 1,538 |
2001 | 1,056 | 614 | 893 | 1,060 | 1,565 |
2002 | 1,056 | 608 | 890 | 1,055 | 1,573 |
2003 | 1,049 | 605 | 886 | 1,044 | 1,595 |
2004 | 1,047 | 613 | 886 | 1,045 | 1,570 |
2005 | 1,024 | 604 | 866 | 1,017 | 1,550 |
2006 | 1,026 | 604 | 873 | 1,024 | 1,551 |
2007 | 1,030 | 602 | 862 | 1,014 | 1,556 |
2008 | 1,033 | 599 | 854 | 1,000 | 1,548 |
2009 | 1,056 | 605 | 866 | 1,010 | 1,605 |
2010 | 1,039 | 578 | 844 | 1,005 | 1,581 |
2011 | 1,022 | 563 | 830 | 969 | 1,536 |
2012 | 1,028 | 574 | 831 | 968 | 1,549 |
2013 | 1,016 | 557 | 815 | 955 | 1,553 |
2014 | 1,009 | 566 | 822 | 954 | 1,515 |
2015 | 1,035 | 568 | 830 | 965 | 1,552 |
2016 | 1,045 | 594 | 830 | 967 | 1,579 |
2017 | 1,052 | 617 | 842 | 968 | 1,564 |
2018 | 1,058 | 626 | 844 | 980 | 1,571 |
2019 | 1,083 | 652 | 854 | 1,003 | 1,592 |
2020 | 1,144 | 674 | 881 | 1,027 | 1,644 |
Note: The comparability of historical labor force data has been affected at various times by methodological and other changes in the Current Population Survey (CPS). Information about historical comparability is online at https://www.bls.gov/cps/documentation.htm#comp. The Consumer Price Index research series using current methods (CPI-U-RS) is used to convert current dollars to constant (inflation-adjusted) dollars. See the technical notes section. | |||||
Note: The comparability of historical labor force data has been affected at various times by methodological and other changes in the Current Population Survey (CPS). Information about historical comparability is online at https://www.bls.gov/cps/documentation.htm#comp. The Consumer Price Index research series using current methods (CPI-U-RS) is used to convert current dollars to constant (inflation-adjusted) dollars. See the technical notes section.
Source: U.S. Bureau of Labor Statistics.
| Table 20. Inflation-adjusted median hourly earnings, by age, for wage and salary workers paid hourly rates, 1979-2020 annual averages [In constant 2020 dollars] | ||||||||||
|---|---|---|---|---|---|---|---|---|---|---|
| Year | Total, 16 years and older | 16 to 24 years | 25 years and older | |||||||
| Total | 16 to 19 years | 20 to 24 years | Total | 25 to 34 years | 35 to 44 years | 45 to 54 years | 55 to 64 years | 65 years and older | ||
Total | ||||||||||
1979 | $14.80 | $11.63 | $10.33 | $13.40 | $17.03 | $17.33 | $17.63 | $17.20 | $16.57 | $10.77 |
1980 | 14.47 | 11.14 | 9.67 | 12.88 | 16.67 | 17.00 | 17.30 | 16.97 | 16.19 | 10.69 |
1981 | 14.11 | 10.88 | 9.81 | 12.63 | 16.41 | 16.68 | 16.99 | 16.47 | 15.92 | 10.74 |
1982 | 13.95 | 10.47 | 9.30 | 12.04 | 16.23 | 16.41 | 17.08 | 16.59 | 15.79 | 10.65 |
1983 | 13.87 | 10.12 | 8.96 | 11.64 | 16.25 | 16.13 | 17.15 | 16.70 | 15.91 | 10.92 |
1984 | 13.88 | 9.95 | 8.69 | 11.48 | 16.29 | 16.12 | 17.07 | 16.86 | 15.76 | 11.02 |
1985 | 13.86 | 9.79 | 8.44 | 11.36 | 16.21 | 15.91 | 17.22 | 16.94 | 15.89 | 10.90 |
1986 | 14.03 | 9.98 | 8.39 | 11.45 | 16.36 | 15.86 | 17.62 | 17.49 | 16.22 | 11.24 |
1987 | 14.13 | 10.02 | 8.32 | 11.38 | 16.29 | 15.70 | 17.34 | 17.16 | 16.20 | 11.09 |
1988 | 14.20 | 10.11 | 8.50 | 11.35 | 16.33 | 15.68 | 17.24 | 17.22 | 15.78 | 11.03 |
1989 | 14.12 | 10.00 | 8.53 | 11.41 | 16.04 | 15.43 | 17.29 | 17.01 | 15.80 | 10.95 |
1990 | 13.93 | 9.94 | 8.65 | 11.39 | 15.72 | 15.22 | 16.99 | 16.94 | 15.45 | 11.08 |
1991 | 13.94 | 9.78 | 8.72 | 11.15 | 15.76 | 14.94 | 17.04 | 16.93 | 15.22 | 11.04 |
1992 | 14.01 | 9.75 | 8.58 | 10.94 | 15.84 | 14.83 | 17.02 | 17.28 | 15.39 | 11.14 |
1993 | 13.93 | 9.75 | 8.50 | 10.88 | 15.84 | 14.64 | 17.01 | 17.45 | 15.75 | 11.31 |
1994 | 13.88 | 9.74 | 8.51 | 10.78 | 15.81 | 14.52 | 17.19 | 17.37 | 15.63 | 11.07 |
1995 | 13.82 | 9.81 | 8.53 | 10.86 | 15.84 | 14.74 | 16.95 | 17.14 | 15.57 | 11.25 |
1996 | 13.84 | 9.79 | 8.52 | 11.02 | 15.85 | 14.53 | 16.71 | 16.87 | 15.47 | 11.15 |
1997 | 14.11 | 9.92 | 8.89 | 11.15 | 15.92 | 14.58 | 16.71 | 17.10 | 15.69 | 11.11 |
1998 | 14.49 | 10.48 | 9.36 | 11.53 | 16.13 | 15.37 | 17.29 | 17.45 | 16.05 | 11.78 |
1999 | 14.84 | 10.70 | 9.47 | 12.06 | 16.31 | 15.55 | 17.17 | 17.65 | 16.17 | 11.99 |
2000 | 14.95 | 10.92 | 9.67 | 12.17 | 16.41 | 15.35 | 17.12 | 17.83 | 16.32 | 12.14 |
2001 | 14.94 | 11.28 | 9.91 | 12.29 | 16.72 | 15.65 | 17.55 | 17.84 | 16.67 | 12.51 |
2002 | 15.11 | 11.27 | 9.97 | 12.22 | 17.07 | 15.84 | 17.58 | 17.98 | 17.10 | 13.09 |
2003 | 15.30 | 11.14 | 9.77 | 12.21 | 17.00 | 15.87 | 17.57 | 18.29 | 17.19 | 12.96 |
2004 | 15.11 | 10.96 | 9.62 | 12.06 | 16.80 | 15.62 | 17.71 | 18.17 | 17.28 | 13.21 |
2005 | 14.86 | 10.72 | 9.36 | 11.83 | 16.57 | 15.62 | 17.41 | 17.90 | 17.20 | 13.19 |
2006 | 15.14 | 10.60 | 9.31 | 11.79 | 16.65 | 15.38 | 17.36 | 18.06 | 17.16 | 13.06 |
2007 | 14.96 | 10.83 | 9.47 | 12.09 | 16.47 | 15.08 | 17.43 | 18.01 | 17.16 | 12.98 |
2008 | 14.73 | 10.69 | 9.45 | 11.76 | 16.64 | 15.06 | 17.33 | 17.92 | 17.11 | 13.12 |
2009 | 15.04 | 10.76 | 9.58 | 11.81 | 16.82 | 15.24 | 17.64 | 17.96 | 17.78 | 13.89 |
2010 | 14.86 | 10.58 | 9.51 | 11.33 | 16.62 | 14.90 | 17.37 | 17.81 | 17.71 | 13.73 |
2011 | 14.66 | 10.35 | 9.30 | 11.08 | 16.29 | 14.66 | 17.10 | 17.30 | 17.38 | 14.06 |
2012 | 14.46 | 10.23 | 9.15 | 10.96 | 16.10 | 14.49 | 16.79 | 17.03 | 17.39 | 13.80 |
2013 | 14.40 | 10.20 | 9.12 | 10.95 | 16.15 | 14.34 | 16.68 | 16.89 | 17.39 | 13.89 |
2014 | 14.38 | 10.45 | 9.22 | 10.92 | 16.19 | 14.37 | 16.53 | 16.84 | 16.81 | 14.25 |
2015 | 14.69 | 10.77 | 9.67 | 11.08 | 16.30 | 14.86 | 16.57 | 17.31 | 17.39 | 14.30 |
2016 | 15.10 | 10.92 | 9.92 | 11.64 | 16.32 | 15.10 | 17.01 | 17.57 | 17.48 | 14.85 |
2017 | 15.45 | 11.28 | 10.34 | 11.99 | 16.53 | 15.66 | 17.00 | 17.66 | 17.76 | 15.12 |
2018 | 15.45 | 11.51 | 10.34 | 12.33 | 16.61 | 15.57 | 17.46 | 17.55 | 17.79 | 14.79 |
2019 | 15.54 | 12.09 | 10.33 | 12.69 | 17.07 | 16.09 | 17.73 | 17.73 | 18.07 | 15.21 |
2020 | 16.36 | 12.69 | 11.07 | 13.50 | 17.86 | 16.85 | 18.52 | 18.90 | 18.60 | 15.84 |
Women | ||||||||||
1979 | $12.07 | $10.63 | $10.10 | $11.73 | $13.00 | $13.47 | $13.23 | $12.80 | $12.50 | $10.40 |
1980 | 11.86 | 10.36 | 9.43 | 11.38 | 12.73 | 13.33 | 12.88 | 12.70 | 12.25 | 10.15 |
1981 | 11.73 | 10.16 | 9.64 | 11.21 | 12.85 | 13.40 | 13.07 | 12.58 | 12.14 | 10.16 |
1982 | 11.91 | 9.77 | 9.17 | 10.83 | 12.97 | 13.41 | 13.13 | 12.79 | 12.40 | 10.16 |
1983 | 11.91 | 9.48 | 8.81 | 10.57 | 12.98 | 13.50 | 13.18 | 12.88 | 12.58 | 10.32 |
1984 | 11.83 | 9.36 | 8.55 | 10.38 | 13.05 | 13.33 | 13.36 | 13.12 | 12.55 | 10.40 |
1985 | 11.79 | 9.22 | 8.30 | 10.48 | 13.17 | 13.31 | 13.59 | 13.24 | 12.55 | 10.18 |
1986 | 12.06 | 9.30 | 8.26 | 10.66 | 13.46 | 13.46 | 13.87 | 13.55 | 13.01 | 10.70 |
1987 | 12.23 | 9.21 | 8.10 | 10.68 | 13.45 | 13.41 | 13.86 | 13.71 | 13.17 | 10.59 |
1988 | 12.32 | 9.45 | 8.25 | 10.65 | 13.59 | 13.42 | 14.26 | 13.90 | 12.83 | 10.80 |
1989 | 12.34 | 9.47 | 8.28 | 10.57 | 13.70 | 13.49 | 14.34 | 13.94 | 12.89 | 10.38 |
1990 | 12.41 | 9.54 | 8.38 | 10.73 | 13.62 | 13.51 | 14.20 | 13.80 | 12.97 | 10.50 |
1991 | 12.55 | 9.44 | 8.62 | 10.61 | 13.64 | 13.36 | 14.37 | 14.14 | 12.92 | 10.71 |
1992 | 12.63 | 9.36 | 8.51 | 10.47 | 13.88 | 13.52 | 14.50 | 14.41 | 13.07 | 10.83 |
1993 | 12.60 | 9.33 | 8.37 | 10.55 | 13.93 | 13.47 | 14.44 | 14.48 | 13.38 | 10.94 |
1994 | 12.56 | 9.22 | 8.37 | 10.36 | 13.95 | 13.48 | 14.63 | 14.66 | 13.55 | 10.81 |
1995 | 12.62 | 9.29 | 8.36 | 10.30 | 13.82 | 13.40 | 14.60 | 14.75 | 13.42 | 10.91 |
1996 | 12.73 | 9.36 | 8.39 | 10.31 | 13.89 | 13.28 | 14.65 | 14.73 | 13.29 | 10.63 |
1997 | 12.81 | 9.60 | 8.74 | 10.56 | 14.11 | 13.23 | 14.74 | 14.94 | 13.40 | 11.02 |
1998 | 13.11 | 9.94 | 9.20 | 11.04 | 14.54 | 14.01 | 15.38 | 15.57 | 14.09 | 11.48 |
1999 | 13.46 | 10.28 | 9.31 | 11.25 | 14.84 | 14.17 | 15.31 | 15.50 | 14.53 | 11.68 |
2000 | 13.67 | 10.56 | 9.40 | 11.76 | 14.92 | 14.62 | 15.13 | 15.35 | 14.84 | 11.87 |
2001 | 14.13 | 10.63 | 9.69 | 11.73 | 14.96 | 14.57 | 15.31 | 15.91 | 15.23 | 11.94 |
2002 | 14.27 | 10.75 | 9.81 | 11.70 | 15.45 | 14.60 | 15.84 | 16.13 | 15.60 | 12.60 |
2003 | 14.22 | 10.71 | 9.66 | 11.55 | 15.53 | 14.82 | 15.75 | 16.63 | 15.59 | 12.47 |
2004 | 13.97 | 10.59 | 9.42 | 11.43 | 15.43 | 14.59 | 15.73 | 16.41 | 15.89 | 12.58 |
2005 | 13.69 | 10.36 | 9.19 | 11.29 | 15.38 | 14.42 | 15.72 | 16.11 | 15.75 | 13.04 |
2006 | 13.71 | 10.28 | 9.15 | 11.35 | 15.28 | 14.25 | 15.51 | 15.78 | 15.60 | 12.83 |
2007 | 13.74 | 10.20 | 9.27 | 11.26 | 15.08 | 14.03 | 15.47 | 16.08 | 15.31 | 12.70 |
2008 | 13.84 | 10.16 | 9.29 | 11.04 | 15.04 | 14.12 | 15.53 | 15.86 | 15.66 | 12.69 |
2009 | 14.22 | 10.37 | 9.46 | 11.11 | 15.43 | 14.46 | 15.72 | 15.83 | 16.43 | 13.43 |
2010 | 14.07 | 10.25 | 9.41 | 10.80 | 15.32 | 14.32 | 15.60 | 16.05 | 16.27 | 13.29 |
2011 | 13.82 | 10.07 | 9.18 | 10.57 | 15.11 | 13.98 | 15.50 | 15.87 | 16.18 | 13.56 |
2012 | 13.55 | 9.92 | 9.06 | 10.36 | 14.88 | 13.73 | 15.21 | 15.59 | 16.23 | 13.38 |
2013 | 13.50 | 9.94 | 9.01 | 10.47 | 14.88 | 13.62 | 15.33 | 15.52 | 16.18 | 13.61 |
2014 | 13.33 | 10.00 | 9.07 | 10.69 | 14.77 | 13.40 | 15.32 | 15.47 | 15.53 | 13.64 |
2015 | 13.73 | 10.43 | 9.56 | 10.87 | 15.21 | 14.09 | 15.44 | 16.17 | 16.14 | 13.84 |
2016 | 14.03 | 10.79 | 9.78 | 11.06 | 15.35 | 14.11 | 15.91 | 16.15 | 16.29 | 14.05 |
2017 | 14.32 | 10.86 | 10.13 | 11.62 | 15.66 | 14.78 | 15.76 | 16.01 | 16.06 | 14.66 |
2018 | 14.49 | 11.27 | 10.22 | 12.04 | 15.51 | 15.09 | 15.69 | 15.67 | 16.10 | 14.20 |
2019 | 15.03 | 11.73 | 10.21 | 12.22 | 15.77 | 15.28 | 16.09 | 16.16 | 16.38 | 14.96 |
2020 | 15.22 | 12.12 | 10.81 | 12.98 | 16.50 | 15.93 | 16.95 | 17.07 | 17.04 | 15.03 |
Men | ||||||||||
1979 | $18.83 | $13.00 | $10.63 | $15.47 | $22.30 | $21.27 | $23.73 | $23.67 | $21.97 | $11.87 |
1980 | 18.32 | 12.31 | 10.12 | 14.77 | 21.68 | 20.81 | 23.45 | 23.36 | 21.74 | 11.38 |
1981 | 18.00 | 11.81 | 9.97 | 14.00 | 21.32 | 20.08 | 22.74 | 23.26 | 21.59 | 11.53 |
1982 | 17.70 | 11.32 | 9.46 | 13.23 | 20.88 | 19.82 | 22.97 | 22.95 | 21.03 | 11.52 |
1983 | 17.17 | 10.87 | 9.11 | 12.53 | 20.62 | 19.21 | 22.88 | 22.73 | 21.69 | 11.79 |
1984 | 16.95 | 10.88 | 8.86 | 12.29 | 20.48 | 18.76 | 22.64 | 23.07 | 21.10 | 11.69 |
1985 | 16.85 | 10.76 | 8.62 | 12.02 | 20.34 | 18.39 | 22.53 | 22.92 | 20.78 | 11.47 |
1986 | 17.17 | 10.84 | 8.64 | 12.29 | 20.41 | 18.17 | 22.60 | 22.96 | 21.58 | 11.72 |
1987 | 16.97 | 10.72 | 8.62 | 12.40 | 20.00 | 18.03 | 22.05 | 22.36 | 21.22 | 11.62 |
1988 | 16.69 | 10.61 | 8.73 | 12.22 | 19.79 | 17.74 | 21.56 | 22.55 | 20.55 | 11.65 |
1989 | 16.36 | 10.44 | 8.87 | 12.16 | 19.62 | 17.29 | 21.39 | 21.98 | 20.20 | 11.92 |
1990 | 15.93 | 10.48 | 8.94 | 11.91 | 18.96 | 17.01 | 20.67 | 21.45 | 19.60 | 11.71 |
1991 | 15.97 | 10.37 | 8.81 | 11.58 | 18.55 | 16.62 | 20.41 | 21.77 | 18.74 | 11.56 |
1992 | 15.74 | 10.25 | 8.71 | 11.32 | 18.26 | 16.37 | 19.84 | 21.81 | 18.86 | 11.71 |
1993 | 15.68 | 10.18 | 8.62 | 11.20 | 18.02 | 16.11 | 19.75 | 21.50 | 19.40 | 11.88 |
1994 | 15.60 | 10.19 | 8.63 | 11.37 | 17.83 | 15.77 | 19.93 | 20.97 | 19.17 | 11.51 |
1995 | 15.62 | 10.22 | 8.70 | 11.54 | 18.16 | 16.01 | 20.12 | 20.85 | 18.80 | 11.59 |
1996 | 15.68 | 10.16 | 8.65 | 11.52 | 17.76 | 15.98 | 19.62 | 20.43 | 18.37 | 11.60 |
1997 | 15.85 | 10.40 | 9.05 | 11.58 | 17.90 | 16.00 | 19.47 | 20.65 | 19.02 | 11.23 |
1998 | 16.02 | 11.00 | 9.52 | 12.39 | 18.66 | 16.27 | 19.87 | 20.76 | 19.46 | 12.32 |
1999 | 16.06 | 11.09 | 9.63 | 12.51 | 18.69 | 16.88 | 19.91 | 21.31 | 19.02 | 12.24 |
2000 | 16.30 | 11.51 | 10.02 | 12.65 | 18.46 | 16.55 | 19.82 | 20.97 | 19.32 | 12.53 |
2001 | 16.60 | 11.74 | 10.12 | 13.08 | 18.89 | 16.98 | 20.41 | 20.89 | 18.99 | 13.20 |
2002 | 16.80 | 11.62 | 10.13 | 12.81 | 18.83 | 17.16 | 20.14 | 20.78 | 19.31 | 14.11 |
2003 | 16.77 | 11.48 | 9.90 | 12.69 | 18.69 | 16.94 | 19.93 | 21.06 | 19.87 | 13.81 |
2004 | 16.51 | 11.28 | 9.82 | 12.46 | 18.87 | 16.52 | 20.05 | 20.76 | 19.97 | 13.60 |
2005 | 16.15 | 11.18 | 9.58 | 12.22 | 18.47 | 16.16 | 19.76 | 20.09 | 19.64 | 13.33 |
2006 | 16.32 | 11.31 | 9.56 | 12.55 | 18.37 | 16.25 | 19.38 | 20.64 | 19.36 | 13.80 |
2007 | 16.21 | 11.43 | 9.72 | 12.47 | 18.46 | 16.06 | 18.99 | 20.21 | 19.34 | 13.78 |
2008 | 16.22 | 11.13 | 9.61 | 12.05 | 18.11 | 16.23 | 19.30 | 20.27 | 19.16 | 13.86 |
2009 | 16.64 | 11.15 | 9.73 | 12.08 | 18.22 | 15.96 | 19.47 | 20.54 | 19.46 | 14.51 |
2010 | 16.36 | 10.95 | 9.62 | 11.77 | 17.88 | 15.58 | 18.82 | 20.08 | 19.56 | 14.17 |
2011 | 15.92 | 10.65 | 9.41 | 11.42 | 17.43 | 15.20 | 18.49 | 19.47 | 19.69 | 14.82 |
2012 | 15.68 | 10.67 | 9.25 | 11.27 | 17.14 | 15.01 | 18.14 | 19.20 | 19.53 | 14.72 |
2013 | 15.59 | 10.77 | 9.32 | 11.14 | 17.00 | 14.94 | 18.05 | 19.12 | 19.24 | 14.34 |
2014 | 15.74 | 10.82 | 9.44 | 11.11 | 17.24 | 15.40 | 18.11 | 19.05 | 19.10 | 15.30 |
2015 | 16.03 | 10.96 | 9.80 | 11.63 | 17.33 | 15.49 | 18.01 | 19.18 | 19.66 | 15.46 |
2016 | 16.14 | 11.05 | 10.23 | 12.03 | 17.53 | 16.00 | 18.55 | 19.45 | 19.47 | 15.94 |
2017 | 16.05 | 11.61 | 10.43 | 12.54 | 17.95 | 16.00 | 18.89 | 19.79 | 19.64 | 15.77 |
2018 | 16.51 | 12.10 | 10.46 | 12.56 | 18.31 | 16.36 | 19.01 | 19.58 | 20.16 | 15.36 |
2019 | 16.96 | 12.35 | 10.69 | 13.28 | 18.27 | 16.83 | 19.39 | 19.47 | 20.04 | 16.00 |
2020 | 17.75 | 13.08 | 11.60 | 14.08 | 19.18 | 17.56 | 20.10 | 21.05 | 20.15 | 16.75 |
Note: The comparability of historical labor force data has been affected at various times by methodological and other changes in the Current Population Survey (CPS). Information about historical comparability is online at https://www.bls.gov/cps/documentation.htm#comp. The Consumer Price Index research series using current methods (CPI-U-RS) is used to convert current dollars to constant (inflation-adjusted) dollars. See the technical notes section. | ||||||||||
Note: The comparability of historical labor force data has been affected at various times by methodological and other changes in the Current Population Survey (CPS). Information about historical comparability is online at https://www.bls.gov/cps/documentation.htm#comp. The Consumer Price Index research series using current methods (CPI-U-RS) is used to convert current dollars to constant (inflation-adjusted) dollars. See the technical notes section.
Source: U.S. Bureau of Labor Statistics.
| Table 21. Inflation-adjusted median hourly earnings, by race and Hispanic or Latino ethnicity, for wage and salary workers paid hourly rates, 1979-2020 annual averages [In constant 2020 dollars] | |||||
|---|---|---|---|---|---|
| Year | Total, 16 years and older | White | Black or African American | Asian | Hispanic or Latino ethnicity |
Total | |||||
1979 | $14.80 | $15.03 | $13.70 | - | $13.60 |
1980 | 14.47 | 14.65 | 13.33 | - | 13.33 |
1981 | 14.11 | 14.19 | 13.42 | - | 13.18 |
1982 | 13.95 | 14.13 | 13.07 | - | 12.95 |
1983 | 13.87 | 14.04 | 12.78 | - | 12.63 |
1984 | 13.88 | 14.05 | 12.76 | - | 12.55 |
1985 | 13.86 | 14.02 | 12.64 | - | 12.57 |
1986 | 14.03 | 14.21 | 13.12 | - | 12.78 |
1987 | 14.13 | 14.32 | 13.08 | - | 12.71 |
1988 | 14.20 | 14.37 | 12.97 | - | 12.55 |
1989 | 14.12 | 14.30 | 12.99 | - | 12.26 |
1990 | 13.93 | 14.12 | 13.12 | - | 12.10 |
1991 | 13.94 | 14.14 | 13.01 | - | 12.01 |
1992 | 14.01 | 14.19 | 12.81 | - | 12.07 |
1993 | 13.93 | 14.11 | 12.71 | - | 12.09 |
1994 | 13.88 | 14.06 | 12.63 | - | 12.01 |
1995 | 13.82 | 14.08 | 12.96 | - | 11.84 |
1996 | 13.84 | 14.12 | 12.78 | - | 11.81 |
1997 | 14.11 | 14.32 | 12.92 | - | 11.92 |
1998 | 14.49 | 14.68 | 13.36 | - | 12.61 |
1999 | 14.84 | 15.17 | 13.79 | - | 12.57 |
2000 | 14.95 | 15.02 | 14.09 | $15.19 | 12.88 |
2001 | 14.94 | 15.04 | 14.34 | 15.76 | 13.28 |
2002 | 15.11 | 15.45 | 14.33 | 14.95 | 13.30 |
2003 | 15.30 | 15.47 | 14.32 | 15.68 | 13.77 |
2004 | 15.11 | 15.29 | 14.00 | 15.25 | 13.48 |
2005 | 14.86 | 15.25 | 13.51 | 15.95 | 13.21 |
2006 | 15.14 | 15.26 | 13.72 | 16.13 | 13.02 |
2007 | 14.96 | 15.12 | 13.63 | 15.29 | 12.82 |
2008 | 14.73 | 15.11 | 13.49 | 15.67 | 13.22 |
2009 | 15.04 | 15.31 | 14.07 | 15.91 | 13.35 |
2010 | 14.86 | 15.15 | 14.00 | 15.72 | 12.94 |
2011 | 14.66 | 14.89 | 13.60 | 15.40 | 12.75 |
2012 | 14.46 | 14.73 | 13.38 | 14.95 | 12.56 |
2013 | 14.40 | 14.64 | 13.25 | 15.17 | 12.53 |
2014 | 14.38 | 14.85 | 13.00 | 15.32 | 12.94 |
2015 | 14.69 | 15.16 | 13.18 | 15.51 | 13.16 |
2016 | 15.10 | 15.36 | 13.47 | 15.95 | 13.69 |
2017 | 15.45 | 15.72 | 13.62 | 15.90 | 13.90 |
2018 | 15.45 | 15.63 | 14.06 | 15.71 | 14.42 |
2019 | 15.54 | 16.04 | 14.84 | 16.33 | 15.04 |
2020 | 16.36 | 16.78 | 15.17 | 17.25 | 15.20 |
Women | |||||
1979 | $12.07 | $12.07 | $11.83 | - | $11.47 |
1980 | 11.86 | 11.89 | 11.65 | - | 11.35 |
1981 | 11.73 | 11.73 | 11.48 | - | 11.23 |
1982 | 11.91 | 11.91 | 11.60 | - | 11.19 |
1983 | 11.91 | 11.94 | 11.71 | - | 10.97 |
1984 | 11.83 | 11.86 | 11.60 | - | 11.07 |
1985 | 11.79 | 11.82 | 11.59 | - | 11.08 |
1986 | 12.06 | 12.10 | 11.70 | - | 11.31 |
1987 | 12.23 | 12.27 | 11.79 | - | 11.16 |
1988 | 12.32 | 12.36 | 11.84 | - | 11.14 |
1989 | 12.34 | 12.38 | 11.88 | - | 11.17 |
1990 | 12.41 | 12.45 | 12.00 | - | 11.18 |
1991 | 12.55 | 12.57 | 12.17 | - | 11.12 |
1992 | 12.63 | 12.69 | 12.05 | - | 11.20 |
1993 | 12.60 | 12.67 | 12.16 | - | 11.17 |
1994 | 12.56 | 12.72 | 12.01 | - | 11.09 |
1995 | 12.62 | 12.76 | 12.05 | - | 11.17 |
1996 | 12.73 | 12.83 | 11.86 | - | 11.15 |
1997 | 12.81 | 12.90 | 12.24 | - | 11.00 |
1998 | 13.11 | 13.26 | 12.58 | - | 11.50 |
1999 | 13.46 | 13.60 | 12.66 | - | 11.62 |
2000 | 13.67 | 13.71 | 13.36 | $14.74 | 11.90 |
2001 | 14.13 | 14.27 | 13.42 | 14.77 | 12.14 |
2002 | 14.27 | 14.34 | 13.64 | 14.57 | 12.32 |
2003 | 14.22 | 14.26 | 13.98 | 15.06 | 12.52 |
2004 | 13.97 | 14.02 | 13.64 | 14.52 | 12.42 |
2005 | 13.69 | 13.94 | 13.19 | 15.46 | 12.19 |
2006 | 13.71 | 13.86 | 13.01 | 15.38 | 12.23 |
2007 | 13.74 | 13.84 | 13.08 | 14.81 | 12.27 |
2008 | 13.84 | 14.10 | 12.99 | 14.76 | 12.13 |
2009 | 14.22 | 14.30 | 13.31 | 15.32 | 12.20 |
2010 | 14.07 | 14.13 | 13.32 | 14.76 | 12.02 |
2011 | 13.82 | 13.90 | 13.01 | 14.76 | 11.82 |
2012 | 13.55 | 13.65 | 12.69 | 14.41 | 11.54 |
2013 | 13.50 | 13.60 | 12.85 | 14.52 | 11.68 |
2014 | 13.33 | 13.54 | 12.66 | 14.47 | 11.73 |
2015 | 13.73 | 14.01 | 12.79 | 15.08 | 12.11 |
2016 | 14.03 | 14.24 | 13.04 | 15.18 | 12.72 |
2017 | 14.32 | 14.65 | 13.25 | 15.03 | 12.77 |
2018 | 14.49 | 14.71 | 13.42 | 15.41 | 13.20 |
2019 | 15.03 | 15.11 | 14.17 | 15.48 | 13.91 |
2020 | 15.22 | 15.31 | 14.95 | 16.56 | 14.68 |
Men | |||||
1979 | $18.83 | $19.30 | $16.30 | - | $15.97 |
1980 | 18.32 | 18.71 | 15.56 | - | 15.11 |
1981 | 18.00 | 18.38 | 15.92 | - | 14.71 |
1982 | 17.70 | 18.04 | 15.43 | - | 14.81 |
1983 | 17.17 | 17.54 | 14.79 | - | 14.42 |
1984 | 16.95 | 17.29 | 14.67 | - | 14.38 |
1985 | 16.85 | 17.43 | 14.14 | - | 13.95 |
1986 | 17.17 | 17.60 | 14.86 | - | 14.00 |
1987 | 16.97 | 17.31 | 14.72 | - | 13.91 |
1988 | 16.69 | 17.00 | 14.64 | - | 13.73 |
1989 | 16.36 | 16.73 | 14.28 | - | 13.45 |
1990 | 15.93 | 16.47 | 14.20 | - | 12.99 |
1991 | 15.97 | 16.39 | 14.07 | - | 12.79 |
1992 | 15.74 | 16.13 | 13.83 | - | 12.69 |
1993 | 15.68 | 16.05 | 13.58 | - | 12.60 |
1994 | 15.60 | 15.96 | 13.73 | - | 12.43 |
1995 | 15.62 | 16.28 | 13.81 | - | 12.28 |
1996 | 15.68 | 16.13 | 13.48 | - | 12.55 |
1997 | 15.85 | 16.06 | 13.98 | - | 12.74 |
1998 | 16.02 | 16.21 | 14.47 | - | 13.12 |
1999 | 16.06 | 16.53 | 15.22 | - | 13.41 |
2000 | 16.30 | 16.52 | 15.05 | $16.27 | 13.63 |
2001 | 16.60 | 17.02 | 14.93 | 17.36 | 14.18 |
2002 | 16.80 | 17.11 | 14.78 | 15.90 | 14.31 |
2003 | 16.77 | 16.97 | 15.25 | 16.77 | 14.15 |
2004 | 16.51 | 16.70 | 14.95 | 16.35 | 13.76 |
2005 | 16.15 | 16.56 | 14.48 | 16.93 | 13.53 |
2006 | 16.32 | 16.58 | 14.70 | 16.96 | 13.95 |
2007 | 16.21 | 16.55 | 14.48 | 16.55 | 13.85 |
2008 | 16.22 | 16.69 | 14.45 | 16.90 | 14.25 |
2009 | 16.64 | 16.87 | 14.84 | 16.94 | 14.41 |
2010 | 16.36 | 16.61 | 14.46 | 16.78 | 13.95 |
2011 | 15.92 | 16.17 | 13.91 | 16.44 | 13.62 |
2012 | 15.68 | 16.01 | 13.79 | 15.99 | 13.51 |
2013 | 15.59 | 15.86 | 13.54 | 15.86 | 13.35 |
2014 | 15.74 | 16.26 | 13.36 | 16.04 | 13.54 |
2015 | 16.03 | 16.32 | 13.84 | 16.25 | 14.12 |
2016 | 16.14 | 16.32 | 14.09 | 16.22 | 14.92 |
2017 | 16.05 | 16.67 | 14.09 | 17.58 | 15.17 |
2018 | 16.51 | 17.04 | 14.66 | 17.21 | 15.47 |
2019 | 16.96 | 17.31 | 15.16 | 17.43 | 15.44 |
2020 | 17.75 | 17.98 | 15.88 | 18.04 | 16.24 |
Note: The comparability of historical labor force data has been affected at various times by methodological and other changes in the Current Population Survey (CPS). Information about historical comparability is online at https://www.bls.gov/cps/documentation.htm#comp. As of 2003, estimates for the race groups shown (White, Black or African American, and Asian) include people who selected that race group only; people who selected more than one race group are not included. Prior to 2003, people who reported more than one race were included in the group they identified as the main race. Asian data for 2000-2002 are for Asians and Pacific Islanders. As of 2003, Asians constitute a separate category. Data for Asians were not tabulated prior to 2000. People of Hispanic or Latino ethnicity may be of any race; estimates for the race groups include Hispanics. The Consumer Price Index research series using current methods (CPI-U-RS) is used to convert current dollars to constant (inflation-adjusted) dollars. See the technical notes section. Dash indicates data not available. | |||||
Note: The comparability of historical labor force data has been affected at various times by methodological and other changes in the Current Population Survey (CPS). Information about historical comparability is online at https://www.bls.gov/cps/documentation.htm#comp. As of 2003, estimates for the race groups shown (White, Black or African American, and Asian) include people who selected that race group only; people who selected more than one race group are not included. Prior to 2003, people who reported more than one race were included in the group they identified as the main race. Asian data for 2000-2002 are for Asians and Pacific Islanders. As of 2003, Asians constitute a separate category. Data for Asians were not tabulated prior to 2000. People of Hispanic or Latino ethnicity may be of any race; estimates for the race groups include Hispanics. The Consumer Price Index research series using current methods (CPI-U-RS) is used to convert current dollars to constant (inflation-adjusted) dollars. See the technical notes section. Dash indicates data not available.
Source: U.S. Bureau of Labor Statistics.
| Table 22. Median usual weekly earnings of full-time wage and salary workers, by age, 1979-2020 annual averages [In current dollars] | ||||||||||
|---|---|---|---|---|---|---|---|---|---|---|
| Year | Total, 16 years and older | 16 to 24 years | 25 years and older | |||||||
| Total | 16 to 19 years | 20 to 24 years | Total | 25 to 34 years | 35 to 44 years | 45 to 54 years | 55 to 64 years | 65 years and older | ||
Total | ||||||||||
1979 | $241 | $172 | $144 | $186 | $265 | $255 | $280 | $276 | $262 | $198 |
1980 | 262 | 187 | 154 | 200 | 286 | 276 | 302 | 298 | 285 | 203 |
1981 | 284 | 200 | 161 | 213 | 308 | 296 | 326 | 320 | 309 | 222 |
1982 | 302 | 208 | 164 | 220 | 327 | 311 | 354 | 345 | 325 | 253 |
1983 | 313 | 211 | 164 | 223 | 343 | 321 | 370 | 367 | 346 | 261 |
1984 | 326 | 217 | 169 | 231 | 362 | 335 | 389 | 385 | 366 | 272 |
1985 | 344 | 224 | 174 | 240 | 379 | 349 | 406 | 400 | 381 | 297 |
1986 | 359 | 232 | 178 | 248 | 391 | 360 | 419 | 416 | 397 | 298 |
1987 | 374 | 243 | 186 | 259 | 403 | 373 | 435 | 429 | 405 | 310 |
1988 | 385 | 249 | 196 | 266 | 414 | 383 | 450 | 453 | 419 | 323 |
1989 | 399 | 259 | 204 | 276 | 427 | 394 | 472 | 472 | 431 | 334 |
1990 | 412 | 269 | 209 | 285 | 449 | 407 | 486 | 489 | 457 | 343 |
1991 | 426 | 277 | 213 | 291 | 467 | 415 | 498 | 507 | 469 | 381 |
1992 | 440 | 276 | 212 | 290 | 479 | 422 | 503 | 522 | 483 | 378 |
1993 | 459 | 282 | 214 | 297 | 491 | 436 | 517 | 542 | 492 | 393 |
1994 | 467 | 286 | 221 | 300 | 500 | 439 | 537 | 566 | 501 | 384 |
1995 | 479 | 292 | 231 | 306 | 510 | 451 | 550 | 582 | 514 | 389 |
1996 | 490 | 298 | 240 | 312 | 520 | 463 | 559 | 594 | 535 | 384 |
1997 | 503 | 306 | 252 | 321 | 540 | 481 | 579 | 607 | 558 | 393 |
1998 | 523 | 319 | 268 | 339 | 572 | 502 | 597 | 620 | 592 | 405 |
1999 | 549 | 341 | 281 | 363 | 592 | 518 | 611 | 652 | 604 | 404 |
2000 | 576 | 361 | 297 | 383 | 609 | 549 | 625 | 669 | 620 | 463 |
2001 | 596 | 375 | 305 | 394 | 630 | 576 | 657 | 693 | 638 | 488 |
2002 | 608 | 381 | 305 | 399 | 646 | 591 | 668 | 706 | 674 | 502 |
2003 | 620 | 387 | 311 | 402 | 662 | 594 | 687 | 723 | 708 | 516 |
2004 | 638 | 390 | 309 | 406 | 683 | 604 | 713 | 743 | 725 | 560 |
2005 | 651 | 397 | 318 | 411 | 696 | 610 | 731 | 748 | 742 | 569 |
2006 | 671 | 409 | 324 | 423 | 718 | 621 | 748 | 773 | 765 | 583 |
2007 | 695 | 424 | 337 | 450 | 738 | 643 | 769 | 790 | 803 | 605 |
2008 | 722 | 443 | 349 | 467 | 761 | 666 | 804 | 822 | 825 | 644 |
2009 | 739 | 442 | 344 | 464 | 774 | 678 | 817 | 838 | 841 | 684 |
2010 | 747 | 432 | 347 | 454 | 782 | 682 | 824 | 844 | 860 | 684 |
2011 | 756 | 440 | 352 | 457 | 797 | 693 | 837 | 866 | 881 | 742 |
2012 | 768 | 444 | 356 | 464 | 815 | 707 | 858 | 878 | 897 | 757 |
2013 | 776 | 454 | 373 | 472 | 827 | 708 | 874 | 883 | 904 | 801 |
2014 | 791 | 477 | 378 | 491 | 839 | 726 | 881 | 899 | 911 | 824 |
2015 | 809 | 487 | 389 | 501 | 860 | 735 | 900 | 923 | 927 | 873 |
2016 | 832 | 501 | 405 | 513 | 885 | 751 | 934 | 955 | 952 | 866 |
2017 | 860 | 519 | 424 | 540 | 907 | 773 | 964 | 977 | 974 | 909 |
2018 | 886 | 548 | 449 | 576 | 932 | 808 | 986 | 1,002 | 994 | 944 |
2019 | 917 | 581 | 481 | 598 | 969 | 846 | 1,035 | 1,033 | 1,017 | 936 |
2020 | 984 | 606 | 497 | 624 | 1,029 | 904 | 1,106 | 1,129 | 1,096 | 999 |
Women | ||||||||||
1979 | $182 | $154 | $132 | $161 | $195 | $199 | $196 | $192 | $189 | $170 |
1980 | 201 | 167 | 145 | 175 | 213 | 218 | 214 | 209 | 205 | 175 |
1981 | 219 | 180 | 154 | 191 | 233 | 239 | 238 | 225 | 222 | 189 |
1982 | 239 | 192 | 158 | 201 | 255 | 258 | 258 | 252 | 245 | 211 |
1983 | 252 | 198 | 158 | 207 | 268 | 272 | 272 | 264 | 257 | 212 |
1984 | 265 | 203 | 162 | 213 | 283 | 285 | 292 | 279 | 270 | 219 |
1985 | 277 | 211 | 166 | 221 | 296 | 296 | 307 | 292 | 285 | 242 |
1986 | 291 | 219 | 170 | 231 | 308 | 306 | 319 | 308 | 296 | 256 |
1987 | 303 | 227 | 172 | 242 | 321 | 316 | 337 | 324 | 308 | 261 |
1988 | 315 | 235 | 184 | 251 | 335 | 327 | 354 | 339 | 317 | 280 |
1989 | 328 | 246 | 197 | 260 | 351 | 340 | 370 | 357 | 333 | 292 |
1990 | 346 | 254 | 198 | 269 | 369 | 356 | 390 | 377 | 348 | 300 |
1991 | 366 | 266 | 205 | 280 | 387 | 371 | 407 | 398 | 363 | 319 |
1992 | 380 | 267 | 205 | 280 | 400 | 382 | 418 | 417 | 376 | 328 |
1993 | 393 | 273 | 205 | 289 | 415 | 395 | 435 | 440 | 395 | 335 |
1994 | 399 | 276 | 211 | 290 | 421 | 397 | 448 | 450 | 398 | 336 |
1995 | 406 | 275 | 215 | 291 | 428 | 403 | 453 | 464 | 403 | 353 |
1996 | 418 | 284 | 223 | 298 | 444 | 415 | 463 | 481 | 420 | 334 |
1997 | 431 | 292 | 240 | 306 | 462 | 427 | 482 | 495 | 433 | 348 |
1998 | 456 | 305 | 249 | 319 | 485 | 451 | 498 | 516 | 476 | 350 |
1999 | 473 | 324 | 266 | 343 | 497 | 470 | 503 | 534 | 492 | 370 |
2000 | 493 | 344 | 283 | 366 | 516 | 493 | 521 | 564 | 508 | 392 |
2001 | 512 | 353 | 288 | 375 | 543 | 512 | 547 | 587 | 536 | 390 |
2002 | 529 | 367 | 295 | 385 | 568 | 530 | 571 | 602 | 574 | 430 |
2003 | 552 | 371 | 299 | 387 | 584 | 546 | 590 | 609 | 601 | 435 |
2004 | 573 | 375 | 293 | 391 | 599 | 561 | 608 | 625 | 615 | 478 |
2005 | 585 | 381 | 304 | 396 | 612 | 573 | 621 | 644 | 639 | 492 |
2006 | 600 | 395 | 305 | 413 | 627 | 583 | 645 | 659 | 658 | 510 |
2007 | 614 | 409 | 318 | 426 | 646 | 597 | 668 | 677 | 679 | 534 |
2008 | 638 | 420 | 322 | 445 | 670 | 623 | 682 | 707 | 711 | 563 |
2009 | 657 | 424 | 323 | 445 | 687 | 634 | 709 | 712 | 727 | 602 |
2010 | 669 | 422 | 336 | 439 | 704 | 648 | 731 | 730 | 736 | 601 |
2011 | 684 | 421 | 328 | 438 | 718 | 662 | 734 | 744 | 749 | 664 |
2012 | 691 | 416 | 330 | 429 | 727 | 666 | 747 | 746 | 766 | 667 |
2013 | 706 | 423 | 350 | 442 | 740 | 665 | 767 | 761 | 779 | 691 |
2014 | 719 | 451 | 357 | 468 | 752 | 679 | 781 | 780 | 780 | 740 |
2015 | 726 | 450 | 364 | 468 | 761 | 690 | 804 | 799 | 784 | 740 |
2016 | 749 | 486 | 388 | 500 | 784 | 705 | 839 | 836 | 812 | 749 |
2017 | 770 | 499 | 402 | 514 | 810 | 724 | 860 | 855 | 856 | 782 |
2018 | 789 | 522 | 421 | 546 | 830 | 750 | 876 | 876 | 853 | 811 |
2019 | 821 | 540 | 427 | 563 | 865 | 788 | 920 | 904 | 880 | 815 |
2020 | 891 | 589 | 464 | 606 | 929 | 852 | 978 | 977 | 955 | 897 |
Men | ||||||||||
1979 | $292 | $196 | $155 | $211 | $314 | $295 | $336 | $338 | $312 | $219 |
1980 | 313 | 208 | 162 | 224 | 339 | 314 | 367 | 367 | 345 | 229 |
1981 | 340 | 218 | 168 | 237 | 372 | 340 | 397 | 396 | 377 | 266 |
1982 | 364 | 225 | 170 | 244 | 393 | 358 | 422 | 419 | 399 | 300 |
1983 | 379 | 223 | 168 | 242 | 407 | 371 | 442 | 444 | 416 | 308 |
1984 | 392 | 231 | 174 | 250 | 422 | 382 | 471 | 470 | 439 | 328 |
1985 | 407 | 241 | 183 | 258 | 443 | 394 | 487 | 489 | 467 | 367 |
1986 | 419 | 246 | 186 | 264 | 463 | 402 | 499 | 506 | 484 | 358 |
1987 | 434 | 257 | 196 | 275 | 477 | 412 | 510 | 520 | 495 | 380 |
1988 | 449 | 262 | 205 | 279 | 487 | 421 | 517 | 549 | 509 | 395 |
1989 | 468 | 271 | 209 | 290 | 500 | 434 | 542 | 569 | 521 | 393 |
1990 | 481 | 282 | 218 | 298 | 512 | 449 | 560 | 591 | 546 | 403 |
1991 | 493 | 285 | 219 | 300 | 523 | 458 | 576 | 612 | 563 | 467 |
1992 | 501 | 284 | 218 | 297 | 536 | 466 | 581 | 634 | 579 | 421 |
1993 | 510 | 288 | 221 | 303 | 555 | 476 | 596 | 653 | 586 | 451 |
1994 | 522 | 294 | 228 | 307 | 576 | 479 | 617 | 671 | 603 | 441 |
1995 | 538 | 303 | 244 | 315 | 588 | 490 | 624 | 685 | 623 | 441 |
1996 | 557 | 307 | 251 | 321 | 599 | 499 | 632 | 698 | 643 | 477 |
1997 | 579 | 317 | 262 | 338 | 615 | 515 | 651 | 713 | 669 | 452 |
1998 | 598 | 334 | 281 | 357 | 639 | 544 | 677 | 732 | 699 | 482 |
1999 | 618 | 356 | 291 | 379 | 668 | 577 | 702 | 763 | 725 | 470 |
2000 | 641 | 375 | 306 | 395 | 693 | 598 | 728 | 771 | 735 | 522 |
2001 | 670 | 391 | 319 | 408 | 720 | 617 | 754 | 799 | 760 | 565 |
2002 | 679 | 391 | 312 | 410 | 732 | 627 | 759 | 807 | 802 | 583 |
2003 | 695 | 398 | 321 | 412 | 744 | 628 | 775 | 834 | 827 | 612 |
2004 | 713 | 400 | 318 | 417 | 762 | 639 | 804 | 857 | 843 | 641 |
2005 | 722 | 409 | 330 | 422 | 771 | 644 | 822 | 853 | 855 | 644 |
2006 | 743 | 418 | 348 | 435 | 797 | 661 | 836 | 897 | 902 | 658 |
2007 | 766 | 443 | 357 | 472 | 823 | 687 | 873 | 909 | 933 | 686 |
2008 | 798 | 461 | 369 | 481 | 857 | 704 | 915 | 944 | 943 | 753 |
2009 | 819 | 458 | 356 | 479 | 873 | 715 | 916 | 967 | 965 | 791 |
2010 | 824 | 443 | 355 | 468 | 874 | 714 | 915 | 954 | 979 | 794 |
2011 | 832 | 455 | 370 | 470 | 886 | 717 | 935 | 979 | 997 | 821 |
2012 | 854 | 468 | 373 | 482 | 910 | 738 | 957 | 994 | 1,005 | 860 |
2013 | 860 | 479 | 390 | 492 | 912 | 744 | 956 | 994 | 1,011 | 937 |
2014 | 871 | 493 | 392 | 507 | 922 | 755 | 964 | 1,011 | 1,021 | 942 |
2015 | 895 | 510 | 407 | 522 | 947 | 770 | 983 | 1,040 | 1,064 | 1,003 |
2016 | 915 | 512 | 419 | 523 | 969 | 794 | 1,007 | 1,075 | 1,102 | 992 |
2017 | 941 | 547 | 459 | 570 | 996 | 821 | 1,062 | 1,103 | 1,098 | 1,016 |
2018 | 973 | 575 | 471 | 592 | 1,026 | 862 | 1,101 | 1,137 | 1,137 | 1,050 |
2019 | 1,007 | 607 | 506 | 623 | 1,070 | 897 | 1,149 | 1,169 | 1,166 | 1,066 |
2020 | 1,082 | 622 | 513 | 648 | 1,144 | 952 | 1,205 | 1,260 | 1,228 | 1,115 |
Note: The comparability of historical labor force data has been affected at various times by methodological and other changes in the Current Population Survey (CPS). Information about historical comparability is online at https://www.bls.gov/cps/documentation.htm#comp. | ||||||||||
Note: The comparability of historical labor force data has been affected at various times by methodological and other changes in the Current Population Survey (CPS). Information about historical comparability is online at https://www.bls.gov/cps/documentation.htm#comp.
Source: U.S. Bureau of Labor Statistics.
| Table 23. Median usual weekly earnings of full-time wage and salary workers, by race and Hispanic or Latino ethnicity, 1979-2020 annual averages [In current dollars] | |||||
|---|---|---|---|---|---|
| Year | Total, 16 years and older | White | Black or African American | Asian | Hispanic or Latino ethnicity |
Total | |||||
1979 | $241 | $248 | $199 | - | $194 |
1980 | 262 | 269 | 212 | - | 209 |
1981 | 284 | 291 | 235 | - | 223 |
1982 | 302 | 310 | 245 | - | 240 |
1983 | 313 | 320 | 261 | - | 250 |
1984 | 326 | 336 | 269 | - | 259 |
1985 | 344 | 356 | 277 | - | 270 |
1986 | 359 | 371 | 291 | - | 277 |
1987 | 374 | 384 | 301 | - | 285 |
1988 | 385 | 395 | 314 | - | 290 |
1989 | 399 | 409 | 319 | - | 298 |
1990 | 412 | 424 | 329 | - | 304 |
1991 | 426 | 442 | 348 | - | 312 |
1992 | 440 | 458 | 357 | - | 321 |
1993 | 459 | 475 | 369 | - | 331 |
1994 | 467 | 484 | 371 | - | 324 |
1995 | 479 | 494 | 383 | - | 329 |
1996 | 490 | 506 | 387 | - | 339 |
1997 | 503 | 519 | 400 | - | 351 |
1998 | 523 | 545 | 426 | - | 370 |
1999 | 549 | 573 | 445 | - | 385 |
2000 | 576 | 590 | 474 | $615 | 399 |
2001 | 596 | 610 | 491 | 639 | 417 |
2002 | 608 | 623 | 498 | 658 | 424 |
2003 | 620 | 636 | 514 | 693 | 440 |
2004 | 638 | 657 | 525 | 708 | 456 |
2005 | 651 | 672 | 520 | 753 | 471 |
2006 | 671 | 690 | 554 | 784 | 486 |
2007 | 695 | 716 | 569 | 830 | 503 |
2008 | 722 | 742 | 589 | 861 | 529 |
2009 | 739 | 757 | 601 | 880 | 541 |
2010 | 747 | 765 | 611 | 855 | 535 |
2011 | 756 | 775 | 615 | 866 | 549 |
2012 | 768 | 792 | 621 | 920 | 568 |
2013 | 776 | 802 | 629 | 942 | 578 |
2014 | 791 | 816 | 639 | 953 | 594 |
2015 | 809 | 835 | 641 | 993 | 604 |
2016 | 832 | 862 | 678 | 1,021 | 624 |
2017 | 860 | 890 | 682 | 1,043 | 655 |
2018 | 886 | 916 | 694 | 1,095 | 680 |
2019 | 917 | 945 | 735 | 1,174 | 706 |
2020 | 984 | 1,003 | 794 | 1,310 | 758 |
Women | |||||
1979 | $182 | $184 | $169 | - | $157 |
1980 | 201 | 203 | 185 | - | 172 |
1981 | 219 | 221 | 206 | - | 190 |
1982 | 239 | 242 | 217 | - | 203 |
1983 | 252 | 254 | 232 | - | 215 |
1984 | 265 | 268 | 241 | - | 223 |
1985 | 277 | 281 | 252 | - | 230 |
1986 | 291 | 294 | 264 | - | 241 |
1987 | 303 | 307 | 276 | - | 251 |
1988 | 315 | 318 | 288 | - | 260 |
1989 | 328 | 334 | 301 | - | 269 |
1990 | 346 | 353 | 308 | - | 278 |
1991 | 366 | 373 | 323 | - | 292 |
1992 | 380 | 387 | 335 | - | 302 |
1993 | 393 | 401 | 348 | - | 313 |
1994 | 399 | 408 | 346 | - | 305 |
1995 | 406 | 415 | 355 | - | 305 |
1996 | 418 | 428 | 362 | - | 316 |
1997 | 431 | 444 | 375 | - | 318 |
1998 | 456 | 468 | 400 | - | 337 |
1999 | 473 | 483 | 409 | - | 348 |
2000 | 493 | 502 | 429 | $547 | 366 |
2001 | 512 | 522 | 454 | 563 | 388 |
2002 | 529 | 547 | 473 | 566 | 397 |
2003 | 552 | 567 | 491 | 598 | 410 |
2004 | 573 | 584 | 505 | 613 | 419 |
2005 | 585 | 596 | 499 | 665 | 429 |
2006 | 600 | 609 | 519 | 699 | 440 |
2007 | 614 | 626 | 533 | 731 | 473 |
2008 | 638 | 654 | 554 | 753 | 501 |
2009 | 657 | 669 | 582 | 779 | 509 |
2010 | 669 | 684 | 592 | 773 | 508 |
2011 | 684 | 703 | 595 | 751 | 518 |
2012 | 691 | 710 | 599 | 770 | 521 |
2013 | 706 | 722 | 606 | 819 | 541 |
2014 | 719 | 734 | 611 | 841 | 548 |
2015 | 726 | 743 | 615 | 877 | 566 |
2016 | 749 | 766 | 641 | 902 | 586 |
2017 | 770 | 795 | 657 | 903 | 603 |
2018 | 789 | 817 | 654 | 937 | 617 |
2019 | 821 | 840 | 704 | 1,025 | 642 |
2020 | 891 | 905 | 764 | 1,143 | 705 |
Men | |||||
1979 | $292 | $298 | $227 | - | $219 |
1980 | 313 | 320 | 244 | - | 234 |
1981 | 340 | 350 | 268 | - | 251 |
1982 | 364 | 375 | 278 | - | 269 |
1983 | 379 | 387 | 294 | - | 274 |
1984 | 392 | 401 | 303 | - | 287 |
1985 | 407 | 418 | 305 | - | 296 |
1986 | 419 | 433 | 319 | - | 299 |
1987 | 434 | 450 | 327 | - | 306 |
1988 | 449 | 465 | 348 | - | 308 |
1989 | 468 | 482 | 348 | - | 315 |
1990 | 481 | 494 | 361 | - | 318 |
1991 | 493 | 506 | 375 | - | 323 |
1992 | 501 | 514 | 380 | - | 339 |
1993 | 510 | 524 | 392 | - | 346 |
1994 | 522 | 547 | 400 | - | 343 |
1995 | 538 | 566 | 411 | - | 350 |
1996 | 557 | 580 | 412 | - | 356 |
1997 | 579 | 595 | 432 | - | 371 |
1998 | 598 | 615 | 468 | - | 390 |
1999 | 618 | 638 | 488 | - | 406 |
2000 | 641 | 662 | 510 | $685 | 417 |
2001 | 670 | 689 | 529 | 732 | 440 |
2002 | 679 | 702 | 524 | 756 | 451 |
2003 | 695 | 715 | 555 | 772 | 464 |
2004 | 713 | 732 | 569 | 802 | 480 |
2005 | 722 | 743 | 559 | 825 | 489 |
2006 | 743 | 761 | 591 | 882 | 505 |
2007 | 766 | 788 | 600 | 936 | 520 |
2008 | 798 | 825 | 620 | 966 | 559 |
2009 | 819 | 845 | 621 | 952 | 569 |
2010 | 824 | 850 | 633 | 936 | 560 |
2011 | 832 | 856 | 653 | 970 | 571 |
2012 | 854 | 879 | 665 | 1,055 | 592 |
2013 | 860 | 884 | 664 | 1,059 | 594 |
2014 | 871 | 897 | 680 | 1,080 | 616 |
2015 | 895 | 920 | 680 | 1,129 | 631 |
2016 | 915 | 942 | 718 | 1,151 | 663 |
2017 | 941 | 971 | 710 | 1,207 | 690 |
2018 | 973 | 1,002 | 735 | 1,241 | 720 |
2019 | 1,007 | 1,036 | 769 | 1,336 | 747 |
2020 | 1,082 | 1,110 | 830 | 1,447 | 797 |
Note: The comparability of historical labor force data has been affected at various times by methodological and other changes in the Current Population Survey (CPS). Information about historical comparability is online at https://www.bls.gov/cps/documentation.htm#comp. As of 2003, estimates for the race groups shown (White, Black or African American, and Asian) include people who selected that race group only; people who selected more than one race group are not included. Prior to 2003, people who reported more than one race were included in the group they identified as the main race. Asian data for 2000-2002 are for Asians and Pacific Islanders. As of 2003, Asians constitute a separate category. Data for Asians were not tabulated prior to 2000. People of Hispanic or Latino ethnicity may be of any race; estimates for the race groups include Hispanics. Dash indicates data not available. | |||||
Note: The comparability of historical labor force data has been affected at various times by methodological and other changes in the Current Population Survey (CPS). Information about historical comparability is online at https://www.bls.gov/cps/documentation.htm#comp. As of 2003, estimates for the race groups shown (White, Black or African American, and Asian) include people who selected that race group only; people who selected more than one race group are not included. Prior to 2003, people who reported more than one race were included in the group they identified as the main race. Asian data for 2000-2002 are for Asians and Pacific Islanders. As of 2003, Asians constitute a separate category. Data for Asians were not tabulated prior to 2000. People of Hispanic or Latino ethnicity may be of any race; estimates for the race groups include Hispanics. Dash indicates data not available.
Source: U.S. Bureau of Labor Statistics.
| Table 24. Median usual weekly earnings of full-time wage and salary workers 25 years and older, by educational attainment, 1979-2020 annual averages [In current dollars] | |||||
|---|---|---|---|---|---|
| Year | Total, 25 years and older | Less than a high school diploma | High school graduates, no college | Some college or associate degree | Bachelor's degree and higher |
Total | |||||
1979 | $265 | $210 | $249 | $282 | $344 |
1980 | 286 | 222 | 266 | 304 | 376 |
1981 | 308 | 240 | 286 | 324 | 407 |
1982 | 327 | 248 | 302 | 351 | 438 |
1983 | 343 | 256 | 311 | 363 | 461 |
1984 | 362 | 263 | 323 | 382 | 486 |
1985 | 379 | 270 | 333 | 399 | 506 |
1986 | 391 | 278 | 344 | 409 | 525 |
1987 | 403 | 284 | 356 | 421 | 564 |
1988 | 414 | 288 | 368 | 430 | 585 |
1989 | 427 | 297 | 375 | 452 | 609 |
1990 | 449 | 303 | 386 | 476 | 638 |
1991 | 467 | 307 | 397 | 489 | 666 |
1992 | 479 | 311 | 403 | 484 | 696 |
1993 | 491 | 314 | 415 | 494 | 715 |
1994 | 500 | 307 | 421 | 499 | 733 |
1995 | 510 | 309 | 432 | 508 | 747 |
1996 | 520 | 317 | 443 | 518 | 758 |
1997 | 540 | 321 | 461 | 535 | 779 |
1998 | 572 | 337 | 479 | 558 | 821 |
1999 | 592 | 346 | 490 | 580 | 860 |
2000 | 609 | 362 | 505 | 596 | 891 |
2001 | 630 | 382 | 520 | 617 | 921 |
2002 | 646 | 388 | 535 | 629 | 941 |
2003 | 662 | 396 | 554 | 639 | 964 |
2004 | 683 | 401 | 574 | 661 | 986 |
2005 | 696 | 409 | 583 | 670 | 1,013 |
2006 | 718 | 419 | 595 | 692 | 1,039 |
2007 | 738 | 428 | 604 | 704 | 1,072 |
2008 | 761 | 453 | 618 | 722 | 1,115 |
2009 | 774 | 454 | 626 | 726 | 1,137 |
2010 | 782 | 444 | 626 | 734 | 1,144 |
2011 | 797 | 451 | 638 | 739 | 1,150 |
2012 | 815 | 471 | 652 | 749 | 1,165 |
2013 | 827 | 472 | 651 | 748 | 1,194 |
2014 | 839 | 488 | 668 | 761 | 1,193 |
2015 | 860 | 493 | 678 | 762 | 1,230 |
2016 | 885 | 504 | 692 | 779 | 1,259 |
2017 | 907 | 520 | 712 | 798 | 1,279 |
2018 | 932 | 553 | 730 | 826 | 1,324 |
2019 | 969 | 592 | 746 | 856 | 1,367 |
2020 | 1,029 | 619 | 781 | 903 | 1,421 |
Women | |||||
1979 | $195 | $152 | $185 | $211 | $264 |
1980 | 213 | 164 | 201 | 231 | 290 |
1981 | 233 | 175 | 217 | 255 | 318 |
1982 | 255 | 184 | 236 | 274 | 346 |
1983 | 268 | 195 | 246 | 288 | 369 |
1984 | 283 | 200 | 259 | 305 | 390 |
1985 | 296 | 202 | 268 | 317 | 414 |
1986 | 308 | 208 | 277 | 330 | 436 |
1987 | 321 | 214 | 288 | 347 | 466 |
1988 | 335 | 221 | 298 | 360 | 485 |
1989 | 351 | 231 | 304 | 379 | 507 |
1990 | 369 | 240 | 315 | 395 | 535 |
1991 | 387 | 250 | 328 | 409 | 562 |
1992 | 400 | 256 | 337 | 407 | 594 |
1993 | 415 | 263 | 347 | 422 | 611 |
1994 | 421 | 257 | 351 | 423 | 634 |
1995 | 428 | 262 | 356 | 427 | 644 |
1996 | 444 | 268 | 365 | 442 | 657 |
1997 | 462 | 275 | 378 | 459 | 672 |
1998 | 485 | 283 | 396 | 476 | 707 |
1999 | 497 | 290 | 405 | 488 | 740 |
2000 | 516 | 304 | 420 | 505 | 756 |
2001 | 543 | 316 | 443 | 520 | 786 |
2002 | 568 | 325 | 458 | 543 | 809 |
2003 | 584 | 329 | 474 | 560 | 832 |
2004 | 599 | 334 | 488 | 577 | 860 |
2005 | 612 | 341 | 493 | 587 | 883 |
2006 | 627 | 358 | 500 | 602 | 905 |
2007 | 646 | 369 | 512 | 609 | 932 |
2008 | 670 | 378 | 520 | 628 | 955 |
2009 | 687 | 382 | 542 | 630 | 970 |
2010 | 704 | 388 | 543 | 638 | 986 |
2011 | 718 | 395 | 554 | 645 | 998 |
2012 | 727 | 386 | 561 | 659 | 1,001 |
2013 | 740 | 400 | 573 | 657 | 1,043 |
2014 | 752 | 409 | 578 | 661 | 1,049 |
2015 | 761 | 418 | 586 | 664 | 1,064 |
2016 | 784 | 423 | 599 | 688 | 1,101 |
2017 | 810 | 447 | 610 | 700 | 1,131 |
2018 | 830 | 469 | 616 | 717 | 1,145 |
2019 | 865 | 494 | 633 | 737 | 1,195 |
2020 | 929 | 525 | 671 | 779 | 1,239 |
Men | |||||
1979 | $314 | $252 | $308 | $329 | $396 |
1980 | 339 | 267 | 327 | 358 | 427 |
1981 | 372 | 286 | 356 | 389 | 475 |
1982 | 393 | 293 | 374 | 411 | 503 |
1983 | 407 | 301 | 388 | 422 | 518 |
1984 | 422 | 308 | 399 | 446 | 562 |
1985 | 443 | 314 | 407 | 472 | 590 |
1986 | 463 | 321 | 416 | 485 | 618 |
1987 | 477 | 324 | 423 | 497 | 653 |
1988 | 487 | 332 | 437 | 503 | 679 |
1989 | 500 | 346 | 450 | 517 | 705 |
1990 | 512 | 349 | 459 | 542 | 741 |
1991 | 523 | 349 | 470 | 563 | 764 |
1992 | 536 | 351 | 479 | 555 | 791 |
1993 | 555 | 356 | 487 | 572 | 806 |
1994 | 576 | 342 | 496 | 587 | 826 |
1995 | 588 | 347 | 507 | 596 | 845 |
1996 | 599 | 357 | 516 | 604 | 874 |
1997 | 615 | 365 | 535 | 621 | 896 |
1998 | 639 | 383 | 559 | 643 | 939 |
1999 | 668 | 395 | 580 | 665 | 977 |
2000 | 693 | 406 | 591 | 691 | 1,020 |
2001 | 720 | 419 | 609 | 723 | 1,067 |
2002 | 732 | 421 | 617 | 731 | 1,090 |
2003 | 744 | 429 | 628 | 740 | 1,131 |
2004 | 762 | 446 | 645 | 761 | 1,143 |
2005 | 771 | 455 | 652 | 766 | 1,167 |
2006 | 797 | 469 | 678 | 796 | 1,205 |
2007 | 823 | 481 | 689 | 810 | 1,243 |
2008 | 857 | 497 | 709 | 830 | 1,285 |
2009 | 873 | 500 | 716 | 835 | 1,327 |
2010 | 874 | 486 | 710 | 845 | 1,330 |
2011 | 886 | 488 | 720 | 840 | 1,332 |
2012 | 910 | 508 | 735 | 857 | 1,371 |
2013 | 912 | 500 | 732 | 858 | 1,395 |
2014 | 922 | 517 | 751 | 872 | 1,385 |
2015 | 947 | 520 | 759 | 883 | 1,420 |
2016 | 969 | 551 | 769 | 896 | 1,464 |
2017 | 996 | 584 | 797 | 917 | 1,481 |
2018 | 1,026 | 607 | 819 | 951 | 1,524 |
2019 | 1,070 | 644 | 844 | 991 | 1,573 |
2020 | 1,144 | 674 | 881 | 1,027 | 1,644 |
Note: The comparability of historical labor force data has been affected at various times by methodological and other changes in the Current Population Survey (CPS). Information about historical comparability is online at https://www.bls.gov/cps/documentation.htm#comp. | |||||
Note: The comparability of historical labor force data has been affected at various times by methodological and other changes in the Current Population Survey (CPS). Information about historical comparability is online at https://www.bls.gov/cps/documentation.htm#comp.
Source: U.S. Bureau of Labor Statistics.
| Table 25. Median hourly earnings of wage and salary workers paid hourly rates, by age, 1979-2020 annual averages [In current dollars] | ||||||||||
|---|---|---|---|---|---|---|---|---|---|---|
| Year | Total, 16 years and older | 16 to 24 years | 25 years and older | |||||||
| Total | 16 to 19 years | 20 to 24 years | Total | 25 to 34 years | 35 to 44 years | 45 to 54 years | 55 to 64 years | 65 years and older | ||
Total | ||||||||||
1979 | $4.44 | $3.49 | $3.10 | $4.02 | $5.11 | $5.20 | $5.29 | $5.16 | $4.97 | $3.23 |
1980 | 4.82 | 3.71 | 3.22 | 4.29 | 5.55 | 5.66 | 5.76 | 5.65 | 5.39 | 3.56 |
1981 | 5.15 | 3.97 | 3.58 | 4.61 | 5.99 | 6.09 | 6.20 | 6.01 | 5.81 | 3.92 |
1982 | 5.40 | 4.05 | 3.60 | 4.66 | 6.28 | 6.35 | 6.61 | 6.42 | 6.11 | 4.12 |
1983 | 5.59 | 4.08 | 3.61 | 4.69 | 6.55 | 6.50 | 6.91 | 6.73 | 6.41 | 4.40 |
1984 | 5.83 | 4.18 | 3.65 | 4.82 | 6.84 | 6.77 | 7.17 | 7.08 | 6.62 | 4.63 |
1985 | 6.03 | 4.26 | 3.67 | 4.94 | 7.05 | 6.92 | 7.49 | 7.37 | 6.91 | 4.74 |
1986 | 6.20 | 4.41 | 3.71 | 5.06 | 7.23 | 7.01 | 7.79 | 7.73 | 7.17 | 4.97 |
1987 | 6.47 | 4.59 | 3.81 | 5.21 | 7.46 | 7.19 | 7.94 | 7.86 | 7.42 | 5.08 |
1988 | 6.73 | 4.79 | 4.03 | 5.38 | 7.74 | 7.43 | 8.17 | 8.16 | 7.48 | 5.23 |
1989 | 6.99 | 4.95 | 4.22 | 5.65 | 7.94 | 7.64 | 8.56 | 8.42 | 7.82 | 5.42 |
1990 | 7.23 | 5.16 | 4.49 | 5.91 | 8.16 | 7.90 | 8.82 | 8.79 | 8.02 | 5.75 |
1991 | 7.50 | 5.26 | 4.69 | 6.00 | 8.48 | 8.04 | 9.17 | 9.11 | 8.19 | 5.94 |
1992 | 7.72 | 5.37 | 4.73 | 6.03 | 8.73 | 8.17 | 9.38 | 9.52 | 8.48 | 6.14 |
1993 | 7.87 | 5.51 | 4.80 | 6.15 | 8.95 | 8.27 | 9.61 | 9.86 | 8.90 | 6.39 |
1994 | 8.01 | 5.62 | 4.91 | 6.22 | 9.12 | 8.38 | 9.92 | 10.02 | 9.02 | 6.39 |
1995 | 8.17 | 5.80 | 5.04 | 6.42 | 9.36 | 8.71 | 10.02 | 10.13 | 9.20 | 6.65 |
1996 | 8.40 | 5.94 | 5.17 | 6.69 | 9.62 | 8.82 | 10.14 | 10.24 | 9.39 | 6.77 |
1997 | 8.75 | 6.15 | 5.51 | 6.91 | 9.87 | 9.04 | 10.36 | 10.60 | 9.73 | 6.89 |
1998 | 9.10 | 6.58 | 5.88 | 7.24 | 10.13 | 9.65 | 10.86 | 10.96 | 10.08 | 7.40 |
1999 | 9.53 | 6.87 | 6.08 | 7.74 | 10.47 | 9.98 | 11.02 | 11.33 | 10.38 | 7.70 |
2000 | 9.91 | 7.24 | 6.41 | 8.07 | 10.88 | 10.18 | 11.35 | 11.82 | 10.82 | 8.05 |
2001 | 10.19 | 7.69 | 6.76 | 8.38 | 11.40 | 10.67 | 11.97 | 12.17 | 11.37 | 8.53 |
2002 | 10.47 | 7.81 | 6.91 | 8.47 | 11.83 | 10.98 | 12.18 | 12.46 | 11.85 | 9.07 |
2003 | 10.85 | 7.90 | 6.93 | 8.66 | 12.05 | 11.25 | 12.46 | 12.97 | 12.19 | 9.19 |
2004 | 11.00 | 7.98 | 7.00 | 8.78 | 12.23 | 11.37 | 12.89 | 13.23 | 12.58 | 9.62 |
2005 | 11.19 | 8.07 | 7.05 | 8.91 | 12.48 | 11.76 | 13.11 | 13.48 | 12.95 | 9.93 |
2006 | 11.76 | 8.24 | 7.23 | 9.16 | 12.94 | 11.95 | 13.49 | 14.03 | 13.33 | 10.15 |
2007 | 11.95 | 8.65 | 7.57 | 9.66 | 13.16 | 12.05 | 13.93 | 14.39 | 13.71 | 10.37 |
2008 | 12.23 | 8.87 | 7.84 | 9.76 | 13.81 | 12.50 | 14.38 | 14.87 | 14.20 | 10.89 |
2009 | 12.44 | 8.90 | 7.92 | 9.77 | 13.91 | 12.60 | 14.59 | 14.85 | 14.70 | 11.49 |
2010 | 12.50 | 8.90 | 8.00 | 9.53 | 13.98 | 12.53 | 14.61 | 14.98 | 14.89 | 11.55 |
2011 | 12.71 | 8.97 | 8.06 | 9.61 | 14.12 | 12.71 | 14.83 | 15.00 | 15.07 | 12.19 |
2012 | 12.80 | 9.05 | 8.10 | 9.70 | 14.25 | 12.82 | 14.86 | 15.07 | 15.39 | 12.21 |
2013 | 12.93 | 9.16 | 8.19 | 9.83 | 14.50 | 12.88 | 14.98 | 15.17 | 15.62 | 12.47 |
2014 | 13.14 | 9.55 | 8.43 | 9.98 | 14.80 | 13.13 | 15.11 | 15.39 | 15.36 | 13.02 |
2015 | 13.44 | 9.85 | 8.85 | 10.14 | 14.91 | 13.60 | 15.16 | 15.84 | 15.91 | 13.08 |
2016 | 14.00 | 10.12 | 9.20 | 10.79 | 15.13 | 14.00 | 15.77 | 16.29 | 16.20 | 13.77 |
2017 | 14.63 | 10.68 | 9.79 | 11.35 | 15.65 | 14.83 | 16.10 | 16.72 | 16.82 | 14.32 |
2018 | 14.99 | 11.16 | 10.03 | 11.96 | 16.11 | 15.10 | 16.94 | 17.02 | 17.26 | 14.35 |
2019 | 15.35 | 11.94 | 10.21 | 12.54 | 16.87 | 15.90 | 17.52 | 17.52 | 17.85 | 15.03 |
2020 | 16.36 | 12.69 | 11.07 | 13.50 | 17.86 | 16.85 | 18.52 | 18.90 | 18.60 | 15.84 |
Women | ||||||||||
1979 | $3.62 | $3.19 | $3.03 | $3.52 | $3.90 | $4.04 | $3.97 | $3.84 | $3.75 | $3.12 |
1980 | 3.95 | 3.45 | 3.14 | 3.79 | 4.24 | 4.44 | 4.29 | 4.23 | 4.08 | 3.38 |
1981 | 4.28 | 3.71 | 3.52 | 4.09 | 4.69 | 4.89 | 4.77 | 4.59 | 4.43 | 3.71 |
1982 | 4.61 | 3.78 | 3.55 | 4.19 | 5.02 | 5.19 | 5.08 | 4.95 | 4.80 | 3.93 |
1983 | 4.80 | 3.82 | 3.55 | 4.26 | 5.23 | 5.44 | 5.31 | 5.19 | 5.07 | 4.16 |
1984 | 4.97 | 3.93 | 3.59 | 4.36 | 5.48 | 5.60 | 5.61 | 5.51 | 5.27 | 4.37 |
1985 | 5.13 | 4.01 | 3.61 | 4.56 | 5.73 | 5.79 | 5.91 | 5.76 | 5.46 | 4.43 |
1986 | 5.33 | 4.11 | 3.65 | 4.71 | 5.95 | 5.95 | 6.13 | 5.99 | 5.75 | 4.73 |
1987 | 5.60 | 4.22 | 3.71 | 4.89 | 6.16 | 6.14 | 6.35 | 6.28 | 6.03 | 4.85 |
1988 | 5.84 | 4.48 | 3.91 | 5.05 | 6.44 | 6.36 | 6.76 | 6.59 | 6.08 | 5.12 |
1989 | 6.11 | 4.69 | 4.10 | 5.23 | 6.78 | 6.68 | 7.10 | 6.90 | 6.38 | 5.14 |
1990 | 6.44 | 4.95 | 4.35 | 5.57 | 7.07 | 7.01 | 7.37 | 7.16 | 6.73 | 5.45 |
1991 | 6.75 | 5.08 | 4.64 | 5.71 | 7.34 | 7.19 | 7.73 | 7.61 | 6.95 | 5.76 |
1992 | 6.96 | 5.16 | 4.69 | 5.77 | 7.65 | 7.45 | 7.99 | 7.94 | 7.20 | 5.97 |
1993 | 7.12 | 5.27 | 4.73 | 5.96 | 7.87 | 7.61 | 8.16 | 8.18 | 7.56 | 6.18 |
1994 | 7.25 | 5.32 | 4.83 | 5.98 | 8.05 | 7.78 | 8.44 | 8.46 | 7.82 | 6.24 |
1995 | 7.46 | 5.49 | 4.94 | 6.09 | 8.17 | 7.92 | 8.63 | 8.72 | 7.93 | 6.45 |
1996 | 7.73 | 5.68 | 5.09 | 6.26 | 8.43 | 8.06 | 8.89 | 8.94 | 8.07 | 6.45 |
1997 | 7.94 | 5.95 | 5.42 | 6.55 | 8.75 | 8.20 | 9.14 | 9.26 | 8.31 | 6.83 |
1998 | 8.23 | 6.24 | 5.78 | 6.93 | 9.13 | 8.80 | 9.66 | 9.78 | 8.85 | 7.21 |
1999 | 8.64 | 6.60 | 5.98 | 7.22 | 9.53 | 9.10 | 9.83 | 9.95 | 9.33 | 7.50 |
2000 | 9.06 | 7.00 | 6.23 | 7.80 | 9.89 | 9.69 | 10.03 | 10.18 | 9.84 | 7.87 |
2001 | 9.64 | 7.25 | 6.61 | 8.00 | 10.20 | 9.94 | 10.44 | 10.85 | 10.39 | 8.14 |
2002 | 9.89 | 7.45 | 6.80 | 8.11 | 10.71 | 10.12 | 10.98 | 11.18 | 10.81 | 8.73 |
2003 | 10.08 | 7.59 | 6.85 | 8.19 | 11.01 | 10.51 | 11.17 | 11.79 | 11.05 | 8.84 |
2004 | 10.17 | 7.71 | 6.86 | 8.32 | 11.23 | 10.62 | 11.45 | 11.95 | 11.57 | 9.16 |
2005 | 10.31 | 7.80 | 6.92 | 8.50 | 11.58 | 10.86 | 11.84 | 12.13 | 11.86 | 9.82 |
2006 | 10.65 | 7.99 | 7.11 | 8.82 | 11.87 | 11.07 | 12.05 | 12.26 | 12.12 | 9.97 |
2007 | 10.98 | 8.15 | 7.41 | 9.00 | 12.05 | 11.21 | 12.36 | 12.85 | 12.23 | 10.15 |
2008 | 11.49 | 8.43 | 7.71 | 9.16 | 12.48 | 11.72 | 12.89 | 13.16 | 13.00 | 10.53 |
2009 | 11.76 | 8.58 | 7.82 | 9.19 | 12.76 | 11.96 | 13.00 | 13.09 | 13.59 | 11.11 |
2010 | 11.83 | 8.62 | 7.91 | 9.08 | 12.88 | 12.04 | 13.12 | 13.50 | 13.68 | 11.18 |
2011 | 11.98 | 8.73 | 7.96 | 9.16 | 13.10 | 12.12 | 13.44 | 13.76 | 14.03 | 11.76 |
2012 | 11.99 | 8.78 | 8.02 | 9.17 | 13.17 | 12.15 | 13.46 | 13.80 | 14.36 | 11.84 |
2013 | 12.12 | 8.93 | 8.09 | 9.40 | 13.36 | 12.23 | 13.77 | 13.94 | 14.53 | 12.22 |
2014 | 12.18 | 9.14 | 8.29 | 9.77 | 13.50 | 12.25 | 14.00 | 14.14 | 14.19 | 12.47 |
2015 | 12.56 | 9.54 | 8.75 | 9.95 | 13.92 | 12.89 | 14.13 | 14.80 | 14.77 | 12.66 |
2016 | 13.01 | 10.00 | 9.07 | 10.25 | 14.23 | 13.08 | 14.75 | 14.97 | 15.10 | 13.02 |
2017 | 13.56 | 10.28 | 9.59 | 11.00 | 14.83 | 14.00 | 14.92 | 15.16 | 15.21 | 13.88 |
2018 | 14.06 | 10.93 | 9.91 | 11.68 | 15.04 | 14.64 | 15.22 | 15.20 | 15.62 | 13.77 |
2019 | 14.85 | 11.59 | 10.09 | 12.07 | 15.58 | 15.10 | 15.90 | 15.97 | 16.18 | 14.78 |
2020 | 15.22 | 12.12 | 10.81 | 12.98 | 16.50 | 15.93 | 16.95 | 17.07 | 17.04 | 15.03 |
Men | ||||||||||
1979 | $5.65 | $3.90 | $3.19 | $4.64 | $6.69 | $6.38 | $7.12 | $7.10 | $6.59 | $3.56 |
1980 | 6.10 | 4.10 | 3.37 | 4.92 | 7.22 | 6.93 | 7.81 | 7.78 | 7.24 | 3.79 |
1981 | 6.57 | 4.31 | 3.64 | 5.11 | 7.78 | 7.33 | 8.30 | 8.49 | 7.88 | 4.21 |
1982 | 6.85 | 4.38 | 3.66 | 5.12 | 8.08 | 7.67 | 8.89 | 8.88 | 8.14 | 4.46 |
1983 | 6.92 | 4.38 | 3.67 | 5.05 | 8.31 | 7.74 | 9.22 | 9.16 | 8.74 | 4.75 |
1984 | 7.12 | 4.57 | 3.72 | 5.16 | 8.60 | 7.88 | 9.51 | 9.69 | 8.86 | 4.91 |
1985 | 7.33 | 4.68 | 3.75 | 5.23 | 8.85 | 8.00 | 9.80 | 9.97 | 9.04 | 4.99 |
1986 | 7.59 | 4.79 | 3.82 | 5.43 | 9.02 | 8.03 | 9.99 | 10.15 | 9.54 | 5.18 |
1987 | 7.77 | 4.91 | 3.95 | 5.68 | 9.16 | 8.26 | 10.10 | 10.24 | 9.72 | 5.32 |
1988 | 7.91 | 5.03 | 4.14 | 5.79 | 9.38 | 8.41 | 10.22 | 10.69 | 9.74 | 5.52 |
1989 | 8.10 | 5.17 | 4.39 | 6.02 | 9.71 | 8.56 | 10.59 | 10.88 | 10.00 | 5.90 |
1990 | 8.27 | 5.44 | 4.64 | 6.18 | 9.84 | 8.83 | 10.73 | 11.13 | 10.17 | 6.08 |
1991 | 8.59 | 5.58 | 4.74 | 6.23 | 9.98 | 8.94 | 10.98 | 11.71 | 10.08 | 6.22 |
1992 | 8.67 | 5.65 | 4.80 | 6.24 | 10.06 | 9.02 | 10.93 | 12.02 | 10.39 | 6.45 |
1993 | 8.86 | 5.75 | 4.87 | 6.33 | 10.18 | 9.10 | 11.16 | 12.15 | 10.96 | 6.71 |
1994 | 9.00 | 5.88 | 4.98 | 6.56 | 10.29 | 9.10 | 11.50 | 12.10 | 11.06 | 6.64 |
1995 | 9.23 | 6.04 | 5.14 | 6.82 | 10.73 | 9.46 | 11.89 | 12.32 | 11.11 | 6.85 |
1996 | 9.52 | 6.17 | 5.25 | 6.99 | 10.78 | 9.70 | 11.91 | 12.40 | 11.15 | 7.04 |
1997 | 9.83 | 6.45 | 5.61 | 7.18 | 11.10 | 9.92 | 12.07 | 12.80 | 11.79 | 6.96 |
1998 | 10.06 | 6.91 | 5.98 | 7.78 | 11.72 | 10.22 | 12.48 | 13.04 | 12.22 | 7.74 |
1999 | 10.31 | 7.12 | 6.18 | 8.03 | 12.00 | 10.84 | 12.78 | 13.68 | 12.21 | 7.86 |
2000 | 10.81 | 7.63 | 6.64 | 8.39 | 12.24 | 10.97 | 13.14 | 13.90 | 12.81 | 8.31 |
2001 | 11.32 | 8.01 | 6.90 | 8.92 | 12.88 | 11.58 | 13.92 | 14.25 | 12.95 | 9.00 |
2002 | 11.64 | 8.05 | 7.02 | 8.88 | 13.05 | 11.89 | 13.96 | 14.40 | 13.38 | 9.78 |
2003 | 11.89 | 8.14 | 7.02 | 9.00 | 13.25 | 12.01 | 14.13 | 14.93 | 14.09 | 9.79 |
2004 | 12.02 | 8.21 | 7.15 | 9.07 | 13.74 | 12.03 | 14.60 | 15.11 | 14.54 | 9.90 |
2005 | 12.16 | 8.42 | 7.21 | 9.20 | 13.91 | 12.17 | 14.88 | 15.13 | 14.79 | 10.04 |
2006 | 12.68 | 8.79 | 7.43 | 9.75 | 14.27 | 12.63 | 15.06 | 16.04 | 15.04 | 10.72 |
2007 | 12.95 | 9.13 | 7.77 | 9.96 | 14.75 | 12.83 | 15.17 | 16.15 | 15.45 | 11.01 |
2008 | 13.46 | 9.24 | 7.98 | 10.00 | 15.03 | 13.47 | 16.02 | 16.82 | 15.90 | 11.50 |
2009 | 13.76 | 9.22 | 8.05 | 9.99 | 15.07 | 13.20 | 16.10 | 16.99 | 16.09 | 12.00 |
2010 | 13.76 | 9.21 | 8.09 | 9.90 | 15.04 | 13.10 | 15.83 | 16.89 | 16.45 | 11.92 |
2011 | 13.80 | 9.23 | 8.16 | 9.90 | 15.11 | 13.18 | 16.03 | 16.88 | 17.07 | 12.85 |
2012 | 13.88 | 9.44 | 8.19 | 9.97 | 15.17 | 13.28 | 16.05 | 16.99 | 17.28 | 13.03 |
2013 | 14.00 | 9.67 | 8.37 | 10.00 | 15.27 | 13.42 | 16.21 | 17.17 | 17.28 | 12.88 |
2014 | 14.39 | 9.89 | 8.63 | 10.15 | 15.76 | 14.08 | 16.55 | 17.41 | 17.46 | 13.98 |
2015 | 14.67 | 10.03 | 8.97 | 10.64 | 15.86 | 14.17 | 16.48 | 17.55 | 17.99 | 14.15 |
2016 | 14.96 | 10.24 | 9.48 | 11.15 | 16.25 | 14.83 | 17.20 | 18.03 | 18.05 | 14.78 |
2017 | 15.20 | 10.99 | 9.88 | 11.88 | 17.00 | 15.15 | 17.89 | 18.74 | 18.60 | 14.93 |
2018 | 16.01 | 11.74 | 10.15 | 12.18 | 17.76 | 15.87 | 18.44 | 18.99 | 19.56 | 14.90 |
2019 | 16.76 | 12.20 | 10.56 | 13.12 | 18.05 | 16.63 | 19.16 | 19.24 | 19.80 | 15.81 |
2020 | 17.75 | 13.08 | 11.60 | 14.08 | 19.18 | 17.56 | 20.10 | 21.05 | 20.15 | 16.75 |
Note: The comparability of historical labor force data has been affected at various times by methodological and other changes in the Current Population Survey (CPS). Information about historical comparability is online at https://www.bls.gov/cps/documentation.htm#comp. | ||||||||||
Note: The comparability of historical labor force data has been affected at various times by methodological and other changes in the Current Population Survey (CPS). Information about historical comparability is online at https://www.bls.gov/cps/documentation.htm#comp.
Source: U.S. Bureau of Labor Statistics.
| Table 26. Median hourly earnings of wage and salary workers paid hourly rates, by race and Hispanic or Latino ethnicity, 1979-2020 annual averages [In current dollars] | |||||
|---|---|---|---|---|---|
| Year | Total, 16 years and older | White | Black or African American | Asian | Hispanic or Latino ethnicity |
Total | |||||
1979 | $4.44 | $4.51 | $4.11 | - | $4.08 |
1980 | 4.82 | 4.88 | 4.44 | - | 4.44 |
1981 | 5.15 | 5.18 | 4.90 | - | 4.81 |
1982 | 5.40 | 5.47 | 5.06 | - | 5.01 |
1983 | 5.59 | 5.66 | 5.15 | - | 5.09 |
1984 | 5.83 | 5.90 | 5.36 | - | 5.27 |
1985 | 6.03 | 6.10 | 5.50 | - | 5.47 |
1986 | 6.20 | 6.28 | 5.80 | - | 5.65 |
1987 | 6.47 | 6.56 | 5.99 | - | 5.82 |
1988 | 6.73 | 6.81 | 6.15 | - | 5.95 |
1989 | 6.99 | 7.08 | 6.43 | - | 6.07 |
1990 | 7.23 | 7.33 | 6.81 | - | 6.28 |
1991 | 7.50 | 7.61 | 7.00 | - | 6.46 |
1992 | 7.72 | 7.82 | 7.06 | - | 6.65 |
1993 | 7.87 | 7.97 | 7.18 | - | 6.83 |
1994 | 8.01 | 8.11 | 7.29 | - | 6.93 |
1995 | 8.17 | 8.32 | 7.66 | - | 7.00 |
1996 | 8.40 | 8.57 | 7.76 | - | 7.17 |
1997 | 8.75 | 8.88 | 8.01 | - | 7.39 |
1998 | 9.10 | 9.22 | 8.39 | - | 7.92 |
1999 | 9.53 | 9.74 | 8.85 | - | 8.07 |
2000 | 9.91 | 9.96 | 9.34 | $10.07 | 8.54 |
2001 | 10.19 | 10.26 | 9.78 | 10.75 | 9.06 |
2002 | 10.47 | 10.71 | 9.93 | 10.36 | 9.22 |
2003 | 10.85 | 10.97 | 10.15 | 11.12 | 9.76 |
2004 | 11.00 | 11.13 | 10.19 | 11.10 | 9.81 |
2005 | 11.19 | 11.48 | 10.17 | 12.01 | 9.95 |
2006 | 11.76 | 11.86 | 10.66 | 12.53 | 10.12 |
2007 | 11.95 | 12.08 | 10.89 | 12.22 | 10.24 |
2008 | 12.23 | 12.54 | 11.20 | 13.01 | 10.97 |
2009 | 12.44 | 12.66 | 11.64 | 13.16 | 11.04 |
2010 | 12.50 | 12.74 | 11.77 | 13.22 | 10.88 |
2011 | 12.71 | 12.91 | 11.79 | 13.35 | 11.05 |
2012 | 12.80 | 13.04 | 11.84 | 13.23 | 11.12 |
2013 | 12.93 | 13.15 | 11.90 | 13.62 | 11.25 |
2014 | 13.14 | 13.57 | 11.88 | 14.00 | 11.83 |
2015 | 13.44 | 13.87 | 12.06 | 14.19 | 12.04 |
2016 | 14.00 | 14.24 | 12.49 | 14.79 | 12.69 |
2017 | 14.63 | 14.89 | 12.90 | 15.06 | 13.16 |
2018 | 14.99 | 15.16 | 13.64 | 15.24 | 13.99 |
2019 | 15.35 | 15.85 | 14.66 | 16.13 | 14.86 |
2020 | 16.36 | 16.78 | 15.17 | 17.25 | 15.20 |
Women | |||||
1979 | $3.62 | $3.62 | $3.55 | - | $3.44 |
1980 | 3.95 | 3.96 | 3.88 | - | 3.78 |
1981 | 4.28 | 4.28 | 4.19 | - | 4.10 |
1982 | 4.61 | 4.61 | 4.49 | - | 4.33 |
1983 | 4.80 | 4.81 | 4.72 | - | 4.42 |
1984 | 4.97 | 4.98 | 4.87 | - | 4.65 |
1985 | 5.13 | 5.14 | 5.04 | - | 4.82 |
1986 | 5.33 | 5.35 | 5.17 | - | 5.00 |
1987 | 5.60 | 5.62 | 5.40 | - | 5.11 |
1988 | 5.84 | 5.86 | 5.61 | - | 5.28 |
1989 | 6.11 | 6.13 | 5.88 | - | 5.53 |
1990 | 6.44 | 6.46 | 6.23 | - | 5.80 |
1991 | 6.75 | 6.76 | 6.55 | - | 5.98 |
1992 | 6.96 | 6.99 | 6.64 | - | 6.17 |
1993 | 7.12 | 7.16 | 6.87 | - | 6.31 |
1994 | 7.25 | 7.34 | 6.93 | - | 6.40 |
1995 | 7.46 | 7.54 | 7.12 | - | 6.60 |
1996 | 7.73 | 7.79 | 7.20 | - | 6.77 |
1997 | 7.94 | 8.00 | 7.59 | - | 6.82 |
1998 | 8.23 | 8.33 | 7.90 | - | 7.22 |
1999 | 8.64 | 8.73 | 8.13 | - | 7.46 |
2000 | 9.06 | 9.09 | 8.86 | $9.77 | 7.89 |
2001 | 9.64 | 9.73 | 9.15 | 10.07 | 8.28 |
2002 | 9.89 | 9.94 | 9.45 | 10.10 | 8.54 |
2003 | 10.08 | 10.11 | 9.91 | 10.68 | 8.88 |
2004 | 10.17 | 10.21 | 9.93 | 10.57 | 9.04 |
2005 | 10.31 | 10.50 | 9.93 | 11.64 | 9.18 |
2006 | 10.65 | 10.77 | 10.11 | 11.95 | 9.50 |
2007 | 10.98 | 11.06 | 10.45 | 11.83 | 9.80 |
2008 | 11.49 | 11.70 | 10.78 | 12.25 | 10.07 |
2009 | 11.76 | 11.83 | 11.01 | 12.67 | 10.09 |
2010 | 11.83 | 11.88 | 11.20 | 12.41 | 10.11 |
2011 | 11.98 | 12.05 | 11.28 | 12.80 | 10.25 |
2012 | 11.99 | 12.08 | 11.23 | 12.75 | 10.21 |
2013 | 12.12 | 12.21 | 11.54 | 13.04 | 10.49 |
2014 | 12.18 | 12.38 | 11.57 | 13.23 | 10.72 |
2015 | 12.56 | 12.82 | 11.70 | 13.80 | 11.08 |
2016 | 13.01 | 13.20 | 12.09 | 14.07 | 11.79 |
2017 | 13.56 | 13.87 | 12.55 | 14.23 | 12.09 |
2018 | 14.06 | 14.27 | 13.02 | 14.95 | 12.80 |
2019 | 14.85 | 14.93 | 14.00 | 15.29 | 13.74 |
2020 | 15.22 | 15.31 | 14.95 | 16.56 | 14.68 |
Men | |||||
1979 | $5.65 | $5.79 | $4.89 | - | $4.79 |
1980 | 6.10 | 6.23 | 5.18 | - | 5.03 |
1981 | 6.57 | 6.71 | 5.81 | - | 5.37 |
1982 | 6.85 | 6.98 | 5.97 | - | 5.73 |
1983 | 6.92 | 7.07 | 5.96 | - | 5.81 |
1984 | 7.12 | 7.26 | 6.16 | - | 6.04 |
1985 | 7.33 | 7.58 | 6.15 | - | 6.07 |
1986 | 7.59 | 7.78 | 6.57 | - | 6.19 |
1987 | 7.77 | 7.93 | 6.74 | - | 6.37 |
1988 | 7.91 | 8.06 | 6.94 | - | 6.51 |
1989 | 8.10 | 8.28 | 7.07 | - | 6.66 |
1990 | 8.27 | 8.55 | 7.37 | - | 6.74 |
1991 | 8.59 | 8.82 | 7.57 | - | 6.88 |
1992 | 8.67 | 8.89 | 7.62 | - | 6.99 |
1993 | 8.86 | 9.07 | 7.67 | - | 7.12 |
1994 | 9.00 | 9.21 | 7.92 | - | 7.17 |
1995 | 9.23 | 9.62 | 8.16 | - | 7.26 |
1996 | 9.52 | 9.79 | 8.18 | - | 7.62 |
1997 | 9.83 | 9.96 | 8.67 | - | 7.90 |
1998 | 10.06 | 10.18 | 9.09 | - | 8.24 |
1999 | 10.31 | 10.61 | 9.77 | - | 8.61 |
2000 | 10.81 | 10.95 | 9.98 | $10.79 | 9.04 |
2001 | 11.32 | 11.61 | 10.18 | 11.84 | 9.67 |
2002 | 11.64 | 11.86 | 10.24 | 11.02 | 9.92 |
2003 | 11.89 | 12.03 | 10.81 | 11.89 | 10.03 |
2004 | 12.02 | 12.16 | 10.88 | 11.90 | 10.02 |
2005 | 12.16 | 12.47 | 10.90 | 12.75 | 10.19 |
2006 | 12.68 | 12.88 | 11.42 | 13.18 | 10.84 |
2007 | 12.95 | 13.22 | 11.57 | 13.22 | 11.07 |
2008 | 13.46 | 13.85 | 11.99 | 14.03 | 11.83 |
2009 | 13.76 | 13.95 | 12.27 | 14.01 | 11.92 |
2010 | 13.76 | 13.97 | 12.16 | 14.11 | 11.73 |
2011 | 13.80 | 14.02 | 12.06 | 14.25 | 11.81 |
2012 | 13.88 | 14.17 | 12.20 | 14.15 | 11.96 |
2013 | 14.00 | 14.24 | 12.16 | 14.24 | 11.99 |
2014 | 14.39 | 14.86 | 12.21 | 14.66 | 12.38 |
2015 | 14.67 | 14.93 | 12.66 | 14.87 | 12.92 |
2016 | 14.96 | 15.13 | 13.06 | 15.04 | 13.83 |
2017 | 15.20 | 15.79 | 13.34 | 16.65 | 14.37 |
2018 | 16.01 | 16.53 | 14.22 | 16.69 | 15.01 |
2019 | 16.76 | 17.10 | 14.98 | 17.22 | 15.25 |
2020 | 17.75 | 17.98 | 15.88 | 18.04 | 16.24 |
Note: The comparability of historical labor force data has been affected at various times by methodological and other changes in the Current Population Survey (CPS). Information about historical comparability is online at https://www.bls.gov/cps/documentation.htm#comp. As of 2003, estimates for the race groups shown (White, Black or African American, and Asian) include people who selected that race group only; people who selected more than one race group are not included. Prior to 2003, people who reported more than one race were included in the group they identified as the main race. Asian data for 2000-2002 are for Asians and Pacific Islanders. As of 2003, Asians constitute a separate category. Data for Asians were not tabulated prior to 2000. People of Hispanic or Latino ethnicity may be of any race; estimates for the race groups include Hispanics. Dash indicates data not available. | |||||
Note: The comparability of historical labor force data has been affected at various times by methodological and other changes in the Current Population Survey (CPS). Information about historical comparability is online at https://www.bls.gov/cps/documentation.htm#comp. As of 2003, estimates for the race groups shown (White, Black or African American, and Asian) include people who selected that race group only; people who selected more than one race group are not included. Prior to 2003, people who reported more than one race were included in the group they identified as the main race. Asian data for 2000-2002 are for Asians and Pacific Islanders. As of 2003, Asians constitute a separate category. Data for Asians were not tabulated prior to 2000. People of Hispanic or Latino ethnicity may be of any race; estimates for the race groups include Hispanics. Dash indicates data not available.
Source: U.S. Bureau of Labor Statistics.
Technical Notes
The estimates in this report were obtained from the Current Population Survey (CPS), which provide information on the labor force, employment, and unemployment. The survey is conducted monthly for the U.S. Bureau of Labor Statistics (BLS) by the U.S. Census Bureau using a scientifically selected national sample of about 60,000 eligible households representing all 50 states and the District of Columbia. The survey data on earnings are based on one-fourth of the CPS monthly sample and are limited to wage and salary workers. All self-employed workers, both incorporated and unincorporated, are excluded from the data presented in this report.
The earnings comparisons in this report are on a broad level and do not control for many factors that can help explain earnings differences. This includes the direct comparisons of earnings levels among demographic groups and the women’s-to-men’s earnings ratios (that is, women’s earnings as a percentage of men’s) shown in the tables. For example, the overall ratio of women’s-to-men’s earnings for full-time workers presented here is not controlled for differences in important determinants of earnings such as age, occupation, and educational attainment. The earnings comparisons in this report are not restricted to workers with otherwise comparable characteristics and comparable jobs. Even controlling for one of the factors may not fully explain earnings differences. Comparisons of women’s and men’s earnings by detailed occupation, for example, are not simultaneously controlled for differences in key factors such as age, job skills and responsibilities, work experience, and specialization.
Material in this report is in the public domain and may be used without permission. Information in this report will be made available upon request to individuals with sensory impairments. Voice telephone: (202) 691-5200; Federal Relay Service: 1 (800) 877-8339.
Concepts and definitions
The principal concepts and definitions used in this report are described briefly below.
Wage and salary workers are people age 16 and older who receive wages, salaries, commissions, tips, payments in kind, or piece rates on their sole or principal job. This group includes employees in both the public and private sectors. All self-employed workers are excluded whether or not their businesses are incorporated.
Full-time workers are defined for the purpose of these estimates as those who usually work 35 hours or more per week at their sole or principal job. The federal Fair Labor Standards Act (FLSA) does not define full- or part-time employment.
Part-time workers are defined for the purpose of these estimates as those who usually work fewer than 35 hours per week at their sole or principal job. The federal Fair Labor Standards Act (FLSA) does not define full- or part-time employment.
Usual weekly earnings reflect earnings before taxes and other deductions and include any overtime pay, commissions, or tips usually received (at the main job in the case of multiple jobholders). Before 1994, survey respondents were asked how much they usually earned per week. Since January 1994, respondents have been asked to identify the easiest way for them to report earnings (hourly, weekly, biweekly, twice monthly, monthly, annually, or other) and how much they usually earn in the reported time period. Earnings reported on a basis other than weekly are converted to a weekly equivalent. The term “usual” is determined by each respondent’s own understanding of the term. If the respondent asks for a definition of “usual,” interviewers are instructed to define the term as more than half the weeks worked during the past 4 or 5 months.
Median earnings reflect the midpoint in a given earnings distribution, with half of the workers having earnings above the median and the other half having earnings below the median. This applies to both usual weekly and hourly earnings estimates.
The BLS procedure for estimating the median of a weekly earnings distribution places each reported or calculated weekly earnings value into a $50-wide interval that is centered around a multiple of $50. Similarly, for hourly earnings, medians are calculated based on earnings distributions using $0.50-wide intervals that are centered around multiples of $0.50. In both cases, the median is calculated through the linear interpolation of the interval in which the median lies.
Changes over time in the medians for specific groups may not necessarily be consistent with the movements estimated for the overall median boundary. The most common reasons for this possible anomaly are as follows:
There could be a change in the relative weights of the subgroups. For example, the median earnings of 16- to 24-year-olds, and 25 years and older may rise. However, if the lower earning 16-to-24 age group accounts for a greatly increased share of the total, the overall median could actually fall.
There could be a large change in the shape of the distribution of reported earnings, particularly near a median boundary. This change could be caused by survey observations that are clustered at rounded values, such as $700 or $800. An estimate lying in a $50-wide centered interval containing such a cluster tends to change more slowly than one in other intervals. Consider, for example, the calculation of the median for a multipeaked earnings distribution that shifts over time. As this distribution shifts, the median does not necessarily move at the same rate. Specifically, the median takes relatively more time to move through a frequently reported earnings interval, but once above the upper limit of such an interval, it can move relatively quickly to the next frequently reported interval. BLS procedures for estimating medians mitigate such irregular movements; however, users should be cautious of these effects when evaluating short-term changes in the medians and in ratios of the medians.
Workers paid hourly rates are employed wage and salary workers who report that they are paid by the hour on their job. Typically, workers who are paid an hourly wage have made up approximately 60 percent of all wage and salary workers. Estimates of workers paid by the hour include both full- and part-time workers unless otherwise specified.
Hourly earnings data are for wage and salary workers who are paid by the hour and pertain to earnings from a person’s sole or principal job. Hourly earnings for hourly paid workers do not include overtime pay, commissions, or tips received.
Workers paid at or below the federal minimum wage include only workers who are paid hourly rates. Salaried workers and other nonhourly paid workers are excluded, even though some have earnings that, if converted to hourly rates, would be at or below the federal minimum wage.
The estimates of workers paid at or below the federal minimum wage in this report are based solely on whether the hourly wage they report (which does not include overtime pay, tips, or commissions) is at or below the federal minimum wage. Some respondents might round hourly earnings when answering survey questions. As a result, some workers might report having hourly earnings above or below the federal minimum wage when, in fact, they earn the minimum wage.
Some workers who reported earnings below the prevailing federal minimum wage may not be covered by federal or state minimum wage laws because of exclusions and exemptions in the statutes. Thus, the presence of workers with hourly earnings below the federal minimum wage does not necessarily indicate violations of the federal Fair Labor Standards Act (FLSA) or state statutes in cases where such standards apply. The CPS does not include questions on whether workers are covered by the minimum wage provisions of the FLSA or by individual state or local minimum wage laws.
The estimates presented in this report likely understate the actual number of workers with hourly earnings at or below the minimum wage. BLS does not routinely estimate the hourly earnings of workers not paid by the hour because there are data quality concerns associated with constructing such an estimate.
Regular collection of earnings data in the basic CPS began in 1979. The prevailing federal minimum wage from 1979 to the present is as follows, with the last change occurring in 2009.
|
Federal minimum wage |
Effective date |
|
$2.90 |
January 1, 1979 |
|
$3.10 |
January 1, 1980 |
|
$3.35 |
January 1, 1981 |
|
$3.80 |
April 1, 1990 |
|
$4.25 |
April 1, 1991 |
|
$4.75 |
October 1, 1996 |
|
$5.15 |
September 1, 1997 |
|
$5.85 |
July 24, 2007 |
|
$6.55 |
July 24, 2008 |
|
$7.25 |
July 24, 2009 |
When the minimum wage has increased during a given year, the annual average estimates of the number of minimum wage workers reflect both minimum wage levels in effect during the year. For example, data for 2007 reflect the number of workers who earned the federal minimum wage of $5.15 for January to July and the number of workers who earned the minimum wage of $5.85 for August to December.
Race is reported by the household survey respondent. In accordance with the Office of Management and Budget standards, White, Black or African American, and Asian are terms used to describe a person’s race. Beginning in 2003, people in these categories are those who selected that race group only. People who identify more than one race are tabulated separately in the category Two or More Races. Before 2003, people identified one group as their main race. For more information on the 2003 changes to questions on race, see “Revisions to the Current Population Survey Effective in January 2003.” Data for other race groups—American Indians and Alaska Natives, Native Hawaiians and Other Pacific Islanders—and for people of Two or More Races are included in totals but not separately identified in this report because the number of survey respondents is too small to develop estimates of acceptable reliability.
Hispanic or Latino ethnicity refers to people who identified themselves in the survey process as being of Hispanic, Latino, or Spanish origin. People who identify themselves as Hispanic or Latino ethnicity may be of any race and are included in estimates for the race groups (White, Black or African American, and Asian) in addition to being shown separately.
Married, spouse present refers to people in either opposite-sex or same-sex marriages living together in the same household, even though one spouse may be temporarily absent on business, on vacation, on a visit, in a hospital, or for other reasons.
Other marital status refers to people who never married; and those who are widowed; divorced; separated; and married, spouse absent. Separated includes people with legal separations, those living apart with intentions of obtaining a divorce, and other people permanently or temporarily separated because of marital discord. Married, spouse absent, includes married people living apart because either the husband or wife was employed and living at a considerable distance from home, was serving away from home in the Armed Forces, had moved to another area, or had a different place of residence for any other reason except those listed in the separated definition above.
Inflation-adjusted earnings shown in this report use the Consumer Price Index research series using current methods (CPI-U-RS) to convert current dollars to constant, or inflation-adjusted, dollars. BLS has made numerous improvements to the Consumer Price Index (CPI) over the years. Although these improvements make the CPI more accurate, the histories of official CPI series are not adjusted to reflect the improvements. Because many researchers need a historical series that measures price change consistently over time, BLS developed the CPI-U-RS to provide an estimate of the CPI that incorporates most of the methodological improvements made since 1978 into the entire series. For further information, see the CPI research series webpage.
This report uses the most recent version of the CPI-U-RS available at the time of production. Users should note that the CPI-U-RS is subject to periodic revision. As a result, the rate of inflation incorporated into the inflation-adjusted median earnings estimates in this report may differ from the rate used in previous reports in this series or in other publications.
Reliability
Statistics based on the CPS are subject to both sampling and nonsampling error. When a sample, rather than the entire population, is surveyed, there is a chance that the sample estimates may differ from the true population values they represent. The component of this difference that occurs because samples differ by chance is known as sampling error, and its variability is measured by the standard error of the estimate. There is about a 90-percent chance, or level of confidence, that an estimate based on a sample will differ by no more than 1.645 standard errors from the true population value because of sampling error. BLS analyses are generally conducted at the 90-percent level of confidence.
Readers should be aware that because of sampling error, apparent differences between estimates for two or more groups or categories may not be statistically significant, and therefore not meaningfully different from one another. Standard errors are shown with many of the median earnings estimates in this report to help readers evaluate differences in earnings estimates.
The CPS data also are affected by nonsampling error. Nonsampling error can occur for many reasons, including the failure to sample a segment of the population, inability to obtain information on all respondents in the sample, inability or unwillingness of respondents to provide correct information, and errors made in the collection or processing of the data. Further information about the reliability of data from the CPS is available on the CPS Technical Documentation page of the BLS website.