
An official website of the United States government
An official website of the United States government
The .gov means it's official.
Federal government websites often end in .gov or .mil. Before sharing sensitive information,
make sure you're on a federal government site.
The site is secure.
The
https:// ensures that you are connecting to the official website and that any
information you provide is encrypted and transmitted securely.
From January 2013 to January 2014, nonfarm payroll employment increased in 316 metropolitan areas, decreased in 48 areas, and was unchanged in 8 areas (not seasonally adjusted). The largest over-the-year employment increases occurred in New York-Northern New Jersey-Long Island, New York-New Jersey-Pennsylvania (+135,600), Los Angeles-Long Beach-Santa Ana, California (+129,800), and Dallas-Fort Worth-Arlington, Texas (+95,900).
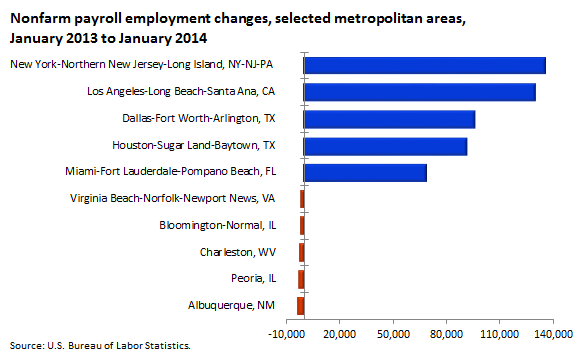
| Metropolitan area | Employment change |
|---|---|
New York-Northern New Jersey-Long Island, NY-NJ-PA | 135,600 |
Los Angeles-Long Beach-Santa Ana, CA | 129,800 |
Dallas-Fort Worth-Arlington, TX | 95,900 |
Houston-Sugar Land-Baytown, TX | 91,300 |
Miami-Fort Lauderdale-Pompano Beach, FL | 68,700 |
Virginia Beach-Norfolk-Newport News, VA | -2,200 |
Bloomington-Normal, IL | -2,400 |
Charleston, WV | -2,900 |
Peoria, IL | -3,400 |
Albuquerque, NM | -4,100 |
The largest over-the-year decrease in employment occurred in Albuquerque, New Mexico (–4,100), followed by Peoria, Illinois (–3,400), and Charleston, West Virginia (–2,900). The largest over-the-year percentage decreases in employment occurred in Anniston-Oxford, Alabama. (–3.7 percent), Danville, Virginia (–3.2 percent), and Bloomington-Normal, Illinois. (–2.7 percent).
Over the year, nonfarm employment rose in 36 of the 38 metropolitan areas with annual average employment levels above 750,000 in 2013.
These data are from the Current Employment Statistics (State and Metro Area) program. Data for the most recent month (January 2014) are preliminary and subject to revision. The data are not seasonally adjusted. To learn more, see "Metropolitan Area Employment and Unemployment — January 2014" (HTML) (PDF), news release USDL‑14‑0435.
Bureau of Labor Statistics, U.S. Department of Labor, The Economics Daily, Metro area employment, January 2014 at https://www.bls.gov/opub/ted/2014/ted_20140326.htm (visited April 16, 2024).

