
For Release: Thursday, March 24, 2022
22-520-SAN
| Technical information: | (415) 625-2270 | BLSinfoSF@bls.gov | www.bls.gov/regions/west |
| Media contact: | (415) 625-2270 |
Fatal Work Injuries in Hawaii – 2020
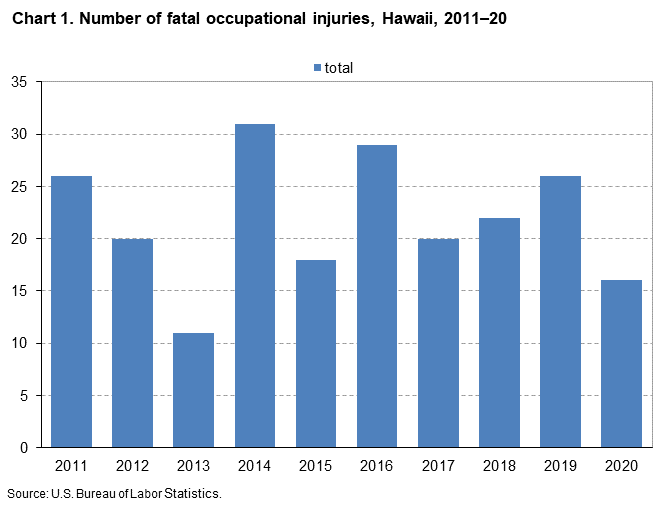
Fatal work injuries totaled 16 in 2020 for Hawaii, the U.S. Bureau of Labor Statistics reported today. Regional Commissioner Chris Rosenlund noted that the number of work-related fatalities in Hawaii was down from 26 the previous year. (See chart 1.) Fatal occupational injuries in the state have ranged from a high of 41 in 2001 to a low of 11 in 2013.
Nationwide, a total of 4,764 fatal work injuries were recorded in 2020, an 11-percent decrease from the 5,333 in 2019, according to the results from the Census of Fatal Occupational Injuries (CFOI) program. The 4,764 fatal occupational injuries in 2020 represents the lowest annual number since 2013.
Fatal event or exposure
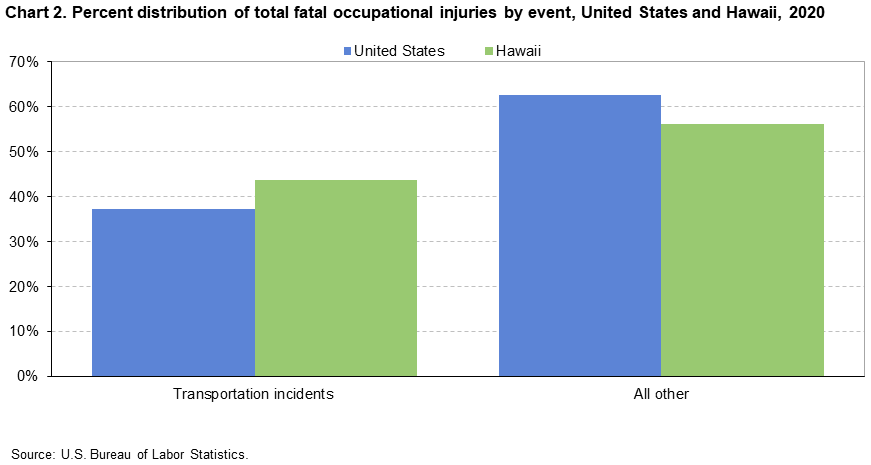
In Hawaii, transportation incidents resulted in seven fatal work injuries. This major category accounted for 44 percent of all fatal workplace injuries in the state. (See chart 2 and table 1.) Worker deaths from transportation incidents were down from 12 over the year.
Violence and other injuries by persons or animals was the second-most frequent fatal work event with five fatalities, unchanged from the prior year. Exposure to harmful substances or environments resulted in four work-related death, the same as in 2018.
Nationally, transportation incidents were the most frequent fatal workplace event in 2020, accounting for 37 percent of fatal work injuries. Falls, slips, and trips was the second-most common fatal event (17 percent).
Industry
The private transportation and warehousing industry sector and the administrative and support and waste management and remediation industry sector had the highest number of fatalities in Hawaii with three each. (See table 2.) Four of the six fatal events in these sectors were transportation incidents.
Occupation
The transportation and material moving occupational group had the highest number of fatal workplace injuries with six. (See table 3.) Motor vehicle operators accounted for 3 of the 6 fatalities among transportation and material moving workers. Of the motor vehicle operators, two were heavy and tractor-trailer truck drivers.
Additional highlights:
- White non-Hispanics accounted for 25 percent of those who died from a workplace injury. (See table 4.) Nationwide, this group accounted for 61 percent of work-related deaths.
- Workers 35-44 years old accounted for 38 percent of the state’s work-related fatalities in 2020, compared to 19 percent of on-the-job fatalities nationally.
- Of the 16 fatal work injuries in Hawaii, all were wage and salary workers.
Coronavirus (COVID-19) Pandemic and the Census of Fatal Occupational Injuries
CFOI reports fatal workplace injuries only. These may include fatal workplace injuries complicated by an illness such as COVID-19. Fatal workplace illnesses not precipitated by an injury are not in scope for CFOI. CFOI does not report any illness related information, including COVID-19. Additional information is available at www.bls.gov/covid19/effects-of-covid-19-on-workplace-injuries-and-illnesses-compensation-and-occupational-requirements.htm.
Technical Note
Background of the program. The Census of Fatal Occupational Injuries (CFOI), part of the Bureau of Labor Statistics (BLS) Occupational Safety and Health Statistics (OSHS) program, is a count of all fatal work injuries occurring in the U.S. during the calendar year. The CFOI uses a variety of state, federal, and independent data sources to identify, verify, and describe fatal work injuries. This ensures counts are as complete and accurate as possible. For the 2020 national data, over 21,600 unique source documents were reviewed as part of the data collection process. For technical information and definitions for the CFOI, see the BLS Handbook of Methods on the BLS website at www.bls.gov/opub/hom/cfoi/home.htm and the CFOI definitions at www.bls.gov/iif/oshcfdef.htm.
Federal/State agency coverage. The CFOI includes data for all fatal work injuries, some of which may be outside the scope of other agencies or regulatory coverage. Comparisons between CFOI counts and those released by other agencies should account for the different coverage requirements and definitions used by each agency. For more information on the scope of CFOI, see www.bls.gov/iif/cfoiscope.htm and www.bls.gov/opub/hom/cfoi/concepts.htm.
Acknowledgments. BLS thanks the Hawaii Department of Labor and Industrial Relations for their efforts in collecting accurate, comprehensive, and useful data on fatal work injuries. BLS also appreciates the efforts of all federal, state, local, and private sector entities that provided source documents used to identify fatal work injuries. Among these agencies are the Occupational Safety and Health Administration; the National Transportation Safety Board; the U.S. Coast Guard; the Mine Safety and Health Administration; the Office of Workers’ Compensation Programs (Federal Employees' Compensation and Longshore and Harbor Workers' Compensation divisions); the Federal Railroad Administration; the National Highway Traffic Safety Administration; state vital statistics registrars, coroners, and medical examiners; state departments of health, labor, and industrial relations and workers' compensation agencies; state and local police departments; and state farm bureaus.
Information in this release will be made available to individuals with sensory impairments upon request. Voice phone: (202) 691-5200; Telecommunications Relay Service: 7-1-1.
| Table 1. Fatal occupational injuries by event or exposure, Hawaii, 2019–20 | |||
|---|---|---|---|
| Event or exposure (1) | 2019 | 2020 | |
| Number | Number | Percent | |
| - Continued | |||
Total | 26 | 16 | 100 |
Transportation incidents | 12 | 7 | 44 |
Pedestrian vehicular incident | -- | 1 | 6 |
Pedestrian struck by vehicle in roadway | -- | 1 | 6 |
Pedestrian struck by forward-moving vehicle in roadway | -- | 1 | 6 |
Roadway incidents involving motorized land vehicle | 1 | 3 | 19 |
Roadway collision with other vehicle | 1 | -- | -- |
Roadway collision--moving in same direction | -- | 1 | 6 |
Roadway collision with object other than vehicle | -- | 1 | 6 |
Vehicle struck object or animal on side of roadway | -- | 1 | 6 |
Nonroadway incident involving motorized land vehicles | -- | 1 | 6 |
Nonroadway collision with other vehicle | -- | 1 | 6 |
Collision between a moving and standing vehicle, nonroadway | -- | 1 | 6 |
Footnotes: | |||
NOTE: Data for all years are final. Totals for major categories may include subcategories not shown separately. For complete information on how the data are coded and presented see our definitions page at https://www.bls.gov/iif/oshcfdef.htm. Dashes indicate no data reported or data that do not meet publication criteria. CFOI fatal injury counts exclude illness-related deaths unless precipitated by an injury event. | |||
Footnotes:
(1) Based on the BLS Occupational Injury and Illness Classification System (OIICS) 2.01 implemented for 2011 data forward.
NOTE: Data for all years are final. Totals for major categories may include subcategories not shown separately. For complete information on how the data are coded and presented see our definitions page at https://www.bls.gov/iif/oshcfdef.htm. Dashes indicate no data reported or data that do not meet publication criteria. CFOI fatal injury counts exclude illness-related deaths unless precipitated by an injury event.
| Table 2. Fatal occupational injuries by industry, Hawaii, 2020 | |||
|---|---|---|---|
| Industry (1) | 2019 | 2020 | |
| Number | Number | Percent | |
| - Continued | |||
Total | 26 | 16 | 100 |
Private industry (2) | 20 | 12 | 75 |
Goods producing | -- | -- | -- |
Construction | 3 | 1 | 6 |
Construction | 3 | 1 | 6 |
Heavy and civil engineering construction | -- | 1 | 6 |
Highway, street, and bridge construction | -- | 1 | 6 |
Highway, street, and bridge construction | -- | 1 | 6 |
Service providing (3) | -- | -- | -- |
Trade, transportation, and utilities | -- | 3 | 19 |
Transportation and warehousing | 4 | 3 | 19 |
Professional and business services | -- | 3 | 19 |
Administrative and support and waste management and remediation services | -- | 3 | 19 |
Administrative and support services | -- | 3 | 19 |
Educational and health services | 7 | 1 | 6 |
Educational services | 7 | 1 | 6 |
Educational services | 7 | 1 | 6 |
Technical and trade schools | -- | 1 | 6 |
Technical and trade schools | -- | 1 | 6 |
Flight training | -- | 1 | 6 |
Federal government | -- | 1 | 6 |
Footnotes: | |||
NOTE: Data for all years are final. Totals for major categories may include subcategories not shown separately. For complete information on how the data are coded and presented see our definitions page at https://www.bls.gov/iif/oshcfdef.htm. Dashes indicate no data reported or data that do not meet publication criteria. CFOI fatal injury counts exclude illness-related deaths unless precipitated by an injury event. | |||
Footnotes:
(1) CFOI has used several versions of the North American Industry Classification System (NAICS) since 2003 to define industry. For complete information on the version of NAICS used in this year, see our definitions page at https://www.bls.gov/iif/oshcfdef.htm.
(2) Cases where ownership is unknown are included in private industry counts.
(3) Cases where industry is unknown are included in the service sector counts.
NOTE: Data for all years are final. Totals for major categories may include subcategories not shown separately. For complete information on how the data are coded and presented see our definitions page at https://www.bls.gov/iif/oshcfdef.htm. Dashes indicate no data reported or data that do not meet publication criteria. CFOI fatal injury counts exclude illness-related deaths unless precipitated by an injury event.
| Table 3. Fatal occupational injuries by occupation, Hawaii, 2020 | |||
|---|---|---|---|
| Occupation (1) | 2019 | 2020 | |
| Number | Number | Percent | |
| - Continued | |||
Total | 26 | 16 | 100 |
Transportation and material moving occupations | 5 | 6 | 38 |
Air transportation workers | 3 | 1 | 6 |
Aircraft pilots and flight engineers | 3 | 1 | 6 |
Commercial pilots | 3 | 1 | 6 |
Motor vehicle operators | -- | 3 | 19 |
Driver/sales workers and truck drivers | -- | 3 | 19 |
Heavy and tractor-trailer truck drivers | -- | 2 | 13 |
Light truck drivers | -- | 1 | 6 |
Footnotes: | |||
NOTE: Data for all years are final. Totals for major categories may include subcategories not shown separately. For complete information on how the data are coded and presented see our definitions page at https://www.bls.gov/iif/oshcfdef.htm. Dashes indicate no data reported or data that do not meet publication criteria. CFOI fatal injury counts exclude illness-related deaths unless precipitated by an injury event. | |||
Footnotes:
(1) CFOI has used several versions of the Standard Occupation Classification (SOC) system since 2003 to define occupation. For complete information on the version of SOC used in this year, see our definitions page at https://www.bls.gov/iif/oshcfdef.htm. Cases where occupation is unknown are included in the total.
NOTE: Data for all years are final. Totals for major categories may include subcategories not shown separately. For complete information on how the data are coded and presented see our definitions page at https://www.bls.gov/iif/oshcfdef.htm. Dashes indicate no data reported or data that do not meet publication criteria. CFOI fatal injury counts exclude illness-related deaths unless precipitated by an injury event.
| Table 4. Fatal occupational injuries by selected demographic characteristics, Hawaii, 2019–20 | |||
|---|---|---|---|
| Worker characteristics | 2019 | 2020 | |
| Number | Number | Percent | |
| - Continued | |||
Total | 26 | 16 | 100 |
Employee status | |||
Wage and salary workers (1) | -- | 16 | 100 |
Self-employed (2) | -- | -- | -- |
Gender | |||
Men | 25 | -- | -- |
Women | 1 | -- | -- |
Age (3) | |||
35 to 44 years | 5 | 6 | 38 |
55 to 64 years | 6 | 3 | 19 |
Race or ethnic origin (4) | |||
White, non-Hispanic | 6 | 4 | 25 |
Black or African-American, non-Hispanic | -- | -- | -- |
Hispanic or Latino | -- | -- | -- |
Footnotes: | |||
NOTE: Data for all years are final. Totals for major categories may include subcategories not shown separately. For complete information on how the data are coded and presented see our definitions page at https://www.bls.gov/iif/oshcfdef.htm. Dashes indicate no data reported or data that do not meet publication criteria. CFOI fatal injury counts exclude illness-related deaths unless precipitated by an injury event. | |||
Footnotes:
(1) May include volunteers and workers receiving other types of compensation. Cases where employment status is unknown are included in the counts of wage and salary workers.
(2) Includes self-employed workers, owners of unincorporated businesses and farms, paid and unpaid family workers, and may include some owners of incorporated businesses or members of partnerships.
(3) Information may not be available for all age groups.
(4) Persons identified as Hispanic or Latino may be of any race. The race categories shown exclude data for Hispanics and Latinos. Cases where ethnicity is unknown are included in counts of non-Hispanic workers.
NOTE: Data for all years are final. Totals for major categories may include subcategories not shown separately. For complete information on how the data are coded and presented see our definitions page at https://www.bls.gov/iif/oshcfdef.htm. Dashes indicate no data reported or data that do not meet publication criteria. CFOI fatal injury counts exclude illness-related deaths unless precipitated by an injury event.