An official website of the United States government
An official website of the United States government
The .gov means it's official.
Federal government websites often end in .gov or .mil. Before sharing sensitive information,
make sure you're on a federal government site.
The site is secure.
The
https:// ensures that you are connecting to the official website and that any
information you provide is encrypted and transmitted securely.
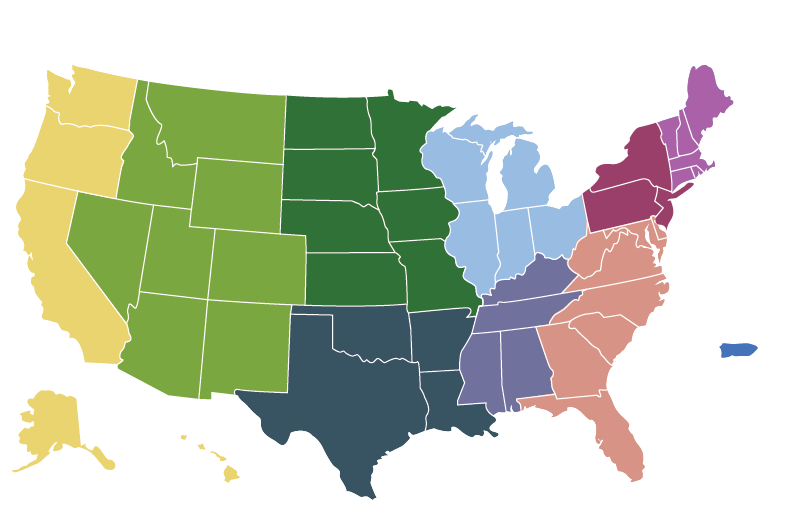
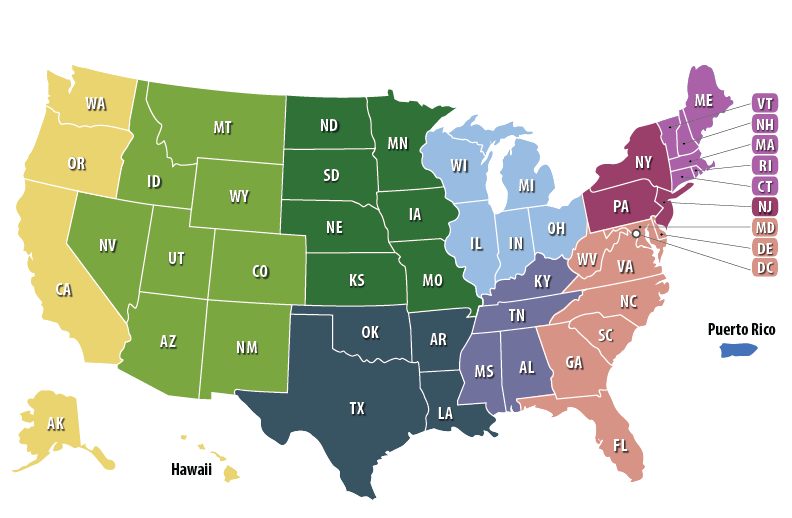
The Current Employment Statistics (CES) program produces detailed industry estimates of employment, hours, and earnings of workers on nonfarm payrolls. CES State and Metro Area produces data for all 50 States, the District of Columbia, Puerto Rico, the Virgin Islands, and about 450 metropolitan areas and divisions. CES National Estimates produces estimates for the nation.
Each month, CES surveys approximately 119,000 businesses and government agencies, representing 629,000 individual worksites.
Hover over an area to see data.
Hover over legend items to see areas in a category.
Source: U.S. Bureau of Labor Statistics.
Change in nonfarm employment by metropolitan area, February 2023 to February 2024, not seasonally adjusted
Metropolitan area
Percent change
Anniston-Oxford-Jacksonville, AL
1.1
Auburn-Opelika, AL
4.3
Birmingham-Hoover, AL
1.2
Daphne-Fairhope-Foley, AL
2.9
Decatur, AL
1.0
Dothan, AL
1.4
Florence-Muscle Shoals, AL
1.4
Gadsden, AL
0.6
Huntsville, AL
2.9
Mobile, AL
0.0
Montgomery, AL
1.5
Tuscaloosa, AL
1.8
Anchorage, AK
2.8
Fairbanks, AK
3.3
Flagstaff, AZ
2.5
Lake Havasu City-Kingman, AZ
0.5
Phoenix-Mesa-Scottsdale, AZ
2.2
Prescott, AZ
1.3
Sierra Vista-Douglas, AZ
1.2
Tucson, AZ
0.7
Yuma, AZ
-1.6
Fayetteville-Springdale-Rogers, AR-MO
2.0
Fort Smith, AR-OK
2.0
Hot Springs, AR
0.0
Jonesboro, AR
0.0
Little Rock-North Little Rock-Conway, AR
1.7
Pine Bluff, AR
-1.3
Bakersfield, CA
1.8
Chico, CA
1.3
El Centro, CA
2.6
Fresno, CA
2.3
Hanford-Corcoran, CA
2.9
Los Angeles-Long Beach-Anaheim, CA
0.5
Madera, CA
6.3
Merced, CA
4.9
Modesto, CA
2.8
Napa, CA
2.9
Oxnard-Thousand Oaks-Ventura, CA
1.5
Redding, CA
2.9
Riverside-San Bernardino-Ontario, CA
1.3
Sacramento--Roseville--Arden-Arcade, CA
2.8
Salinas, CA
1.3
San Diego-Carlsbad, CA
0.9
San Francisco-Oakland-Hayward, CA
-0.2
San Jose-Sunnyvale-Santa Clara, CA
-0.5
San Luis Obispo-Paso Robles-Arroyo Grande, CA
0.6
Santa Cruz-Watsonville, CA
1.7
Santa Maria-Santa Barbara, CA
0.7
Santa Rosa, CA
2.2
Stockton-Lodi, CA
2.8
Vallejo-Fairfield, CA
2.7
Visalia-Porterville, CA
2.4
Yuba City, CA
4.0
Boulder, CO
2.2
Colorado Springs, CO
2.7
Denver-Aurora-Lakewood, CO
0.8
Fort Collins, CO
4.1
Grand Junction, CO
1.8
Greeley, CO
3.4
Pueblo, CO
0.2
Bridgeport-Stamford-Norwalk, CT NECTA
0.8
Danbury, CT NECTA
0.8
Hartford-West Hartford-East Hartford, CT NECTA
0.8
New Haven, CT NECTA
1.7
Norwich-New London-Westerly, CT-RI NECTA
2.1
Waterbury, CT NECTA
0.9
Dover, DE
0.6
Salisbury, MD-DE
1.5
Washington-Arlington-Alexandria, DC-VA-MD-WV
0.6
Cape Coral-Fort Myers, FL
2.0
Crestview-Fort Walton Beach-Destin, FL
3.9
Deltona-Daytona Beach-Ormond Beach, FL
1.8
Gainesville, FL
1.3
Homosassa Springs, FL
-0.8
Jacksonville, FL
2.0
Lakeland-Winter Haven, FL
2.0
Miami-Fort Lauderdale-West Palm Beach, FL
2.1
Naples-Immokalee-Marco Island, FL
2.3
North Port-Sarasota-Bradenton, FL
1.7
Ocala, FL
1.0
Orlando-Kissimmee-Sanford, FL
1.8
Palm Bay-Melbourne-Titusville, FL
2.1
Panama City, FL
2.5
Pensacola-Ferry Pass-Brent, FL
2.2
Port St. Lucie, FL
1.6
Punta Gorda, FL
0.9
Sebastian-Vero Beach, FL
0.3
Sebring, FL
0.4
Tallahassee, FL
2.9
Tampa-St. Petersburg-Clearwater, FL
1.9
The Villages, FL
2.5
Albany, GA
-2.2
Athens-Clarke County, GA
4.0
Atlanta-Sandy Springs-Roswell, GA
0.9
Augusta-Richmond County, GA-SC
-0.3
Brunswick, GA
2.4
Columbus, GA-AL
1.6
Dalton, GA
1.8
Gainesville, GA
5.0
Hinesville, GA
-0.9
Macon-Bibb County, GA
-0.6
Rome, GA
3.7
Savannah, GA
1.5
Valdosta, GA
0.4
Warner Robins, GA
0.1
Kahului-Wailuku-Lahaina, HI
-7.4
Urban Honolulu, HI
1.0
Boise City, ID
2.5
Coeur d'Alene, ID
5.9
Idaho Falls, ID
2.6
Lewiston, ID-WA
3.1
Pocatello, ID
2.6
Twin Falls, ID
0.6
Bloomington, IL
1.4
Carbondale-Marion, IL
1.2
Champaign-Urbana, IL
3.2
Chicago-Naperville-Elgin, IL-IN-WI
0.2
Danville, IL
0.8
Davenport-Moline-Rock Island, IA-IL
-0.9
Decatur, IL
-3.3
Kankakee, IL
0.9
Peoria, IL
0.7
Rockford, IL
0.5
Springfield, IL
-3.0
Bloomington, IN
-0.8
Columbus, IN
-0.8
Elkhart-Goshen, IN
-4.6
Evansville, IN-KY
0.4
Fort Wayne, IN
1.0
Indianapolis-Carmel-Anderson, IN
2.4
Kokomo, IN
0.3
Lafayette-West Lafayette, IN
0.7
Michigan City-La Porte, IN
1.2
Muncie, IN
2.1
South Bend-Mishawaka, IN-MI
1.1
Terre Haute, IN
0.6
Ames, IA
0.4
Cedar Rapids, IA
0.2
Des Moines-West Des Moines, IA
0.8
Dubuque, IA
0.3
Iowa City, IA
2.8
Sioux City, IA-NE-SD
-0.5
Waterloo-Cedar Falls, IA
-0.1
Lawrence, KS
1.8
Manhattan, KS
1.4
Topeka, KS
1.9
Wichita, KS
1.1
Bowling Green, KY
3.0
Elizabethtown-Fort Knox, KY
2.0
Lexington-Fayette, KY
1.3
Louisville/Jefferson County, KY-IN
0.5
Owensboro, KY
0.6
Alexandria, LA
0.5
Baton Rouge, LA
0.8
Hammond, LA
1.2
Houma-Thibodaux, LA
1.9
Lafayette, LA
0.6
Lake Charles, LA
-0.1
Monroe, LA
-1.3
New Orleans-Metairie, LA
-1.2
Shreveport-Bossier City, LA
-1.4
Bangor, ME NECTA
1.7
Lewiston-Auburn, ME NECTA
1.0
Portland-South Portland, ME NECTA
1.1
Baltimore-Columbia-Towson, MD
0.0
California-Lexington Park, MD
1.0
Cumberland, MD-WV
1.3
Hagerstown-Martinsburg, MD-WV
-1.2
Barnstable Town, MA NECTA
5.7
Boston-Cambridge-Nashua, MA-NH NECTA
0.3
Leominster-Gardner, MA NECTA
1.2
New Bedford, MA NECTA
0.3
Pittsfield, MA NECTA
2.3
Springfield, MA-CT NECTA
0.7
Worcester, MA-CT NECTA
1.3
Ann Arbor, MI
2.0
Battle Creek, MI
0.0
Bay City, MI
2.1
Detroit-Warren-Dearborn, MI
0.1
Flint, MI
0.9
Grand Rapids-Wyoming, MI
0.3
Jackson, MI
0.2
Kalamazoo-Portage, MI
-0.1
Lansing-East Lansing, MI
1.9
Midland, MI
0.5
Monroe, MI
5.1
Muskegon, MI
3.0
Niles-Benton Harbor, MI
2.5
Saginaw, MI
1.5
Duluth, MN-WI
-0.3
Mankato-North Mankato, MN
0.2
Minneapolis-St. Paul-Bloomington, MN-WI
1.0
Rochester, MN
3.4
St. Cloud, MN
1.0
Gulfport-Biloxi-Pascagoula, MS
1.0
Hattiesburg, MS
0.3
Jackson, MS
0.7
Cape Girardeau, MO-IL
1.1
Columbia, MO
0.7
Jefferson City, MO
2.1
Joplin, MO
0.5
Kansas City, MO-KS
0.9
St. Joseph, MO-KS
0.5
St. Louis, MO-IL
1.1
Springfield, MO
1.3
Billings, MT
1.9
Great Falls, MT
1.9
Missoula, MT
0.6
Grand Island, NE
2.8
Lincoln, NE
1.9
Omaha-Council Bluffs, NE-IA
2.0
Carson City, NV
1.9
Las Vegas-Henderson-Paradise, NV
3.4
Reno, NV
2.4
Dover-Durham, NH-ME NECTA
-0.9
Manchester, NH NECTA
0.9
Portsmouth, NH-ME NECTA
2.8
Atlantic City-Hammonton, NJ
2.4
Ocean City, NJ
20.2
Trenton, NJ
1.1
Vineland-Bridgeton, NJ
0.2
Albuquerque, NM
1.7
Farmington, NM
-0.2
Las Cruces, NM
2.3
Santa Fe, NM
2.6
Albany-Schenectady-Troy, NY
1.5
Binghamton, NY
2.1
Buffalo-Cheektowaga-Niagara Falls, NY
2.1
Elmira, NY
3.5
Glens Falls, NY
1.0
Ithaca, NY
-1.4
Kingston, NY
2.6
New York-Newark-Jersey City, NY-NJ-PA
0.9
Rochester, NY
1.9
Syracuse, NY
1.8
Utica-Rome, NY
1.1
Watertown-Fort Drum, NY
2.5
Asheville, NC
0.5
Burlington, NC
2.1
Charlotte-Concord-Gastonia, NC-SC
1.5
Durham-Chapel Hill, NC
2.1
Fayetteville, NC
1.4
Goldsboro, NC
1.2
Greensboro-High Point, NC
1.3
Greenville, NC
1.8
Hickory-Lenoir-Morganton, NC
-0.3
Jacksonville, NC
2.2
New Bern, NC
1.1
Raleigh, NC
2.8
Rocky Mount, NC
0.5
Wilmington, NC
2.7
Winston-Salem, NC
0.0
Bismarck, ND
-0.5
Fargo, ND-MN
0.9
Grand Forks, ND-MN
1.7
Akron, OH
-0.5
Canton-Massillon, OH
0.6
Cincinnati, OH-KY-IN
0.2
Cleveland-Elyria, OH
0.8
Columbus, OH
0.3
Dayton, OH
0.2
Lima, OH
-0.4
Mansfield, OH
0.8
Springfield, OH
0.4
Toledo, OH
0.4
Weirton-Steubenville, WV-OH
-0.5
Youngstown-Warren-Boardman, OH-PA
0.7
Enid, OK
0.0
Lawton, OK
0.2
Oklahoma City, OK
2.4
Tulsa, OK
1.8
Albany, OR
-0.8
Bend-Redmond, OR
2.7
Corvallis, OR
3.1
Eugene, OR
-0.4
Grants Pass, OR
0.0
Medford, OR
-0.2
Portland-Vancouver-Hillsboro, OR-WA
-1.5
Salem, OR
1.6
Allentown-Bethlehem-Easton, PA-NJ
1.1
Altoona, PA
2.0
Bloomsburg-Berwick, PA
1.4
Chambersburg-Waynesboro, PA
-1.3
East Stroudsburg, PA
0.9
Erie, PA
1.6
Gettysburg, PA
-1.2
Harrisburg-Carlisle, PA
1.3
Johnstown, PA
0.6
Lancaster, PA
0.8
Lebanon, PA
3.5
Philadelphia-Camden-Wilmington, PA-NJ-DE-MD
1.1
Pittsburgh, PA
0.7
Reading, PA
0.7
Scranton--Wilkes-Barre--Hazleton, PA
2.5
State College, PA
2.2
Williamsport, PA
1.0
York-Hanover, PA
1.4
Providence-Warwick, RI-MA NECTA
0.8
Charleston-North Charleston, SC
4.3
Columbia, SC
2.5
Florence, SC
2.1
Greenville-Anderson-Mauldin, SC
1.3
Hilton Head Island-Bluffton-Beaufort, SC
4.3
Myrtle Beach-Conway-North Myrtle Beach, SC-NC
4.8
Spartanburg, SC
2.5
Sumter, SC
1.6
Rapid City, SD
2.7
Sioux Falls, SD
1.3
Chattanooga, TN-GA
0.2
Clarksville, TN-KY
1.2
Cleveland, TN
0.8
Jackson, TN
0.4
Johnson City, TN
0.2
Kingsport-Bristol-Bristol, TN-VA
0.4
Knoxville, TN
-0.6
Memphis, TN-MS-AR
-1.3
Morristown, TN
-1.8
Nashville-Davidson--Murfreesboro--Franklin, TN
0.5
Abilene, TX
1.2
Amarillo, TX
1.7
Austin-Round Rock, TX
2.8
Beaumont-Port Arthur, TX
2.2
Brownsville-Harlingen, TX
2.1
College Station-Bryan, TX
3.1
Corpus Christi, TX
2.9
Dallas-Fort Worth-Arlington, TX
1.8
El Paso, TX
2.3
Houston-The Woodlands-Sugar Land, TX
2.4
Killeen-Temple, TX
2.6
Laredo, TX
3.3
Longview, TX
0.6
Lubbock, TX
2.2
McAllen-Edinburg-Mission, TX
1.4
Midland, TX
2.3
Odessa, TX
0.9
San Angelo, TX
1.5
San Antonio-New Braunfels, TX
2.6
Sherman-Denison, TX
4.1
Texarkana, TX-AR
0.8
Tyler, TX
0.8
Victoria, TX
0.0
Waco, TX
2.9
Wichita Falls, TX
0.8
Logan, UT-ID
1.5
Ogden-Clearfield, UT
2.5
Provo-Orem, UT
1.4
St. George, UT
2.9
Salt Lake City, UT
1.8
Burlington-South Burlington, VT NECTA
1.6
Blacksburg-Christiansburg-Radford, VA
3.5
Charlottesville, VA
2.9
Harrisonburg, VA
1.5
Lynchburg, VA
1.3
Richmond, VA
1.2
Roanoke, VA
2.5
Staunton-Waynesboro, VA
0.2
Virginia Beach-Norfolk-Newport News, VA-NC
2.0
Winchester, VA-WV
2.3
Bellingham, WA
0.3
Bremerton-Silverdale, WA
1.9
Kennewick-Richland, WA
3.2
Longview, WA
0.7
Mount Vernon-Anacortes, WA
3.6
Olympia-Tumwater, WA
3.1
Seattle-Tacoma-Bellevue, WA
1.2
Spokane-Spokane Valley, WA
3.0
Walla Walla, WA
0.7
Wenatchee, WA
4.9
Yakima, WA
3.5
Beckley, WV
2.6
Charleston, WV
1.1
Huntington-Ashland, WV-KY-OH
1.8
Morgantown, WV
0.4
Parkersburg-Vienna, WV
2.4
Wheeling, WV-OH
1.8
Appleton, WI
0.2
Eau Claire, WI
1.1
Fond du Lac, WI
0.6
Green Bay, WI
0.1
Janesville-Beloit, WI
1.1
La Crosse-Onalaska, WI-MN
2.3
Madison, WI
1.5
Milwaukee-Waukesha-West Allis, WI
-0.8
Oshkosh-Neenah, WI
0.4
Racine, WI
0.4
Sheboygan, WI
2.6
Wausau, WI
-0.1
Casper, WY
1.3
Cheyenne, WY
1.3
Aguadilla-Isabela, PR
3.8
Arecibo, PR
6.7
Guayama, PR
5.7
Mayaguez, PR
1.7
Ponce, PR
3.5
San German, PR
6.3
San Juan-Carolina-Caguas, PR
2.4
All States Diffusion Index, 1-month, total nonfarm
86.3(p) in Feb 2024
![]()
All MSAs Diffusion Index, 1-month, total nonfarm
63.4(p) in Feb 2024
![]()
03/22/2024
In February, unemployment rates were higher in 3 states, lower in 3 states, and stable in 44
states and the District of Columbia. Nonfarm payroll employment increased in 4 states and was
essentially unchanged in 46 states and the District.
HTML
|
PDF
|
RSS
|
Charts
04/03/2024
Jobless rates were higher in February than a year earlier in 247 of the 389
metropolitan areas, lower in 109, and unchanged in 33. Nonfarm payroll
employment increased over the year in 42 metropolitan areas, decreased in 3,
and was essentially unchanged in 344.
HTML
|
PDF
|
RSS
|
Charts

Current Employment Statistics data are reclassified after changes to the North American Industry Classification System in 2022. read more »
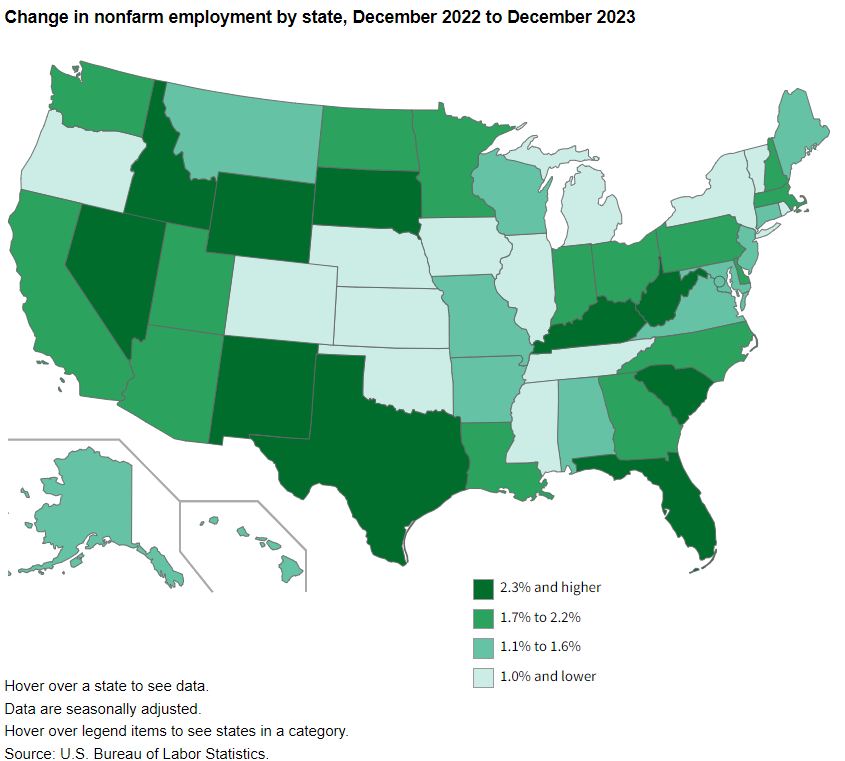
From December 2022 to December 2023, nonfarm payroll employment increased in 30 states and was essentially unchanged in 20 states and the District of Columbia. The largest percentage increases occurred in Nevada, at 3.8 percent, followed by Idaho and South Dakota (+3.0 percent each). read more »
Click a state on the map for economic summaries produced by BLS Regional Information Offices.