An official website of the United States government
An official website of the United States government
The .gov means it's official.
Federal government websites often end in .gov or .mil. Before sharing sensitive information,
make sure you're on a federal government site.
The site is secure.
The
https:// ensures that you are connecting to the official website and that any
information you provide is encrypted and transmitted securely.
24-867-ATL
Tuesday, May 07, 2024
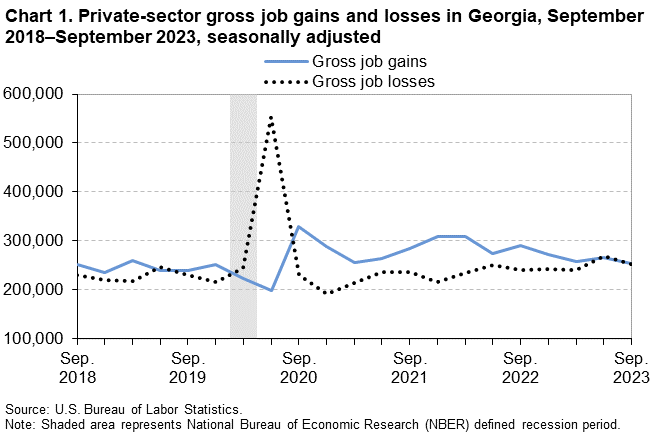
From June 2023 to September 2023, gross job gains from opening and expanding private-sector establishments were 254,774, while gross job losses from closing and contracting private-sector establishments in Georgia were 252,692, the U.S. Bureau of Labor Statistics reported today. Regional Commissioner Victoria G. Lee noted that the difference between the number of gross job gains and the number of gross job losses yielded a net employment gain of 2,082 jobs in the private sector during the third quarter of 2023. During the previous quarter, gross job losses exceeded gross job gains by 3,510. (See chart 1.)
The change in the number of jobs over time is the net result of increases and decreases in employment that occur at all private businesses in the economy. Business Employment Dynamics (BED) statistics track these changes in employment at private-sector establishments from the third month of one quarter to the third month of the next. The difference between the number of gross job gains and the number of gross job losses is the net change in employment. (See the Business Employment Dynamics Technical Note.)
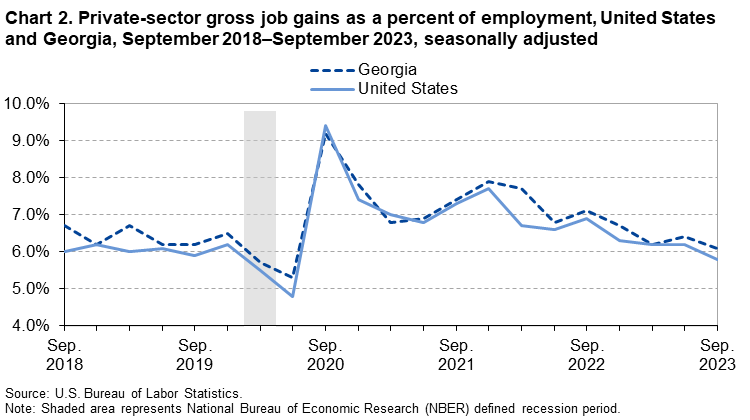
Gross job gainsIn the third quarter of 2023, gross job gains represented 6.1 percent of private-sector employment in Georgia; nationally, gross job gains accounted for 5.8 percent of private-sector employment. (See chart 2.) Gross job gains are the sum of increases in employment due to expansions at existing establishments and the addition of new jobs at opening establishments. In Georgia, gross job gains at expanding establishments totaled 198,977 in the third quarter of 2023, a decrease of 7,312 jobs compared to the previous quarter. (See table 1.) Opening establishments accounted for 55,797 jobs gained in the third quarter of 2023, a decrease of 3,645 jobs from the previous quarter.
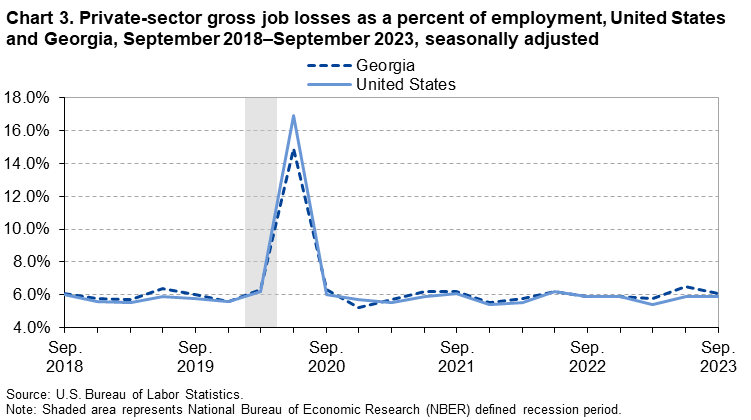
In the third quarter of 2023, gross job losses represented 6.1 percent of private-sector employment in Georgia; nationally, gross job losses accounted for 5.9 percent of private-sector employment. (See chart 3.) Gross job losses are the result of contractions in employment at existing establishments and the loss of jobs at closing establishments. In Georgia, contracting establishments lost 193,840 jobs in the third quarter of 2023, a decrease of 21,246 jobs from the prior quarter. Closing establishments lost 58,852 jobs, an increase of 4,697 jobs from the previous quarter.
Gross job gains exceeded gross job losses in 3 of the 11 industry sectors in Georgia in the third quarter of 2023. Education and health services had the largest over-the-quarter net job increase, with a gain of 7,772 jobs. This was the result of 33,130 gross job gains and 25,358 gross job losses. The information sector showed a net loss of 6,428 jobs, the largest loss of any sector in the state.
For more informationThe BED data series include gross job gains and gross job losses by industry subsector, for the 50 states, the District of Columbia, Puerto Rico, and the Virgin Islands, as well as gross job gains and gross job losses at the firm level by employer size class. BED data for the states have been included in table 2 of this release. Additional information is available online at the Business Employment Dynamics Home.
The Business Employment Dynamics for Fourth Quarter 2023 are scheduled to be released on Wednesday, July 24, 2024.
The Business Employment Dynamics (BED) data are a product of a federal-state cooperative program known as Quarterly Census of Employment and Wages (QCEW). The BED data are compiled by the U.S. Bureau of Labor Statistics (BLS) from existing QCEW records.
More information on formal definitions of the data used in this release, along with coverage, concepts, and methodology, can be found in the Business Employment Dynamics Technical Note.
Information in this release will be made available to individuals with sensory impairments upon request. Voice phone: (202) 691-5200; Telecommunications Relay Service: 7-1-1.
| Category | Gross job gains and losses (3 months ended) |
Gross job gains and losses as a percent of employment (3 months ended) |
||||||||
|---|---|---|---|---|---|---|---|---|---|---|
| Sept. 2022 |
Dec. 2022 |
Mar. 2023 |
June 2023 |
Sept. 2023 |
Sept. 2022 |
Dec. 2022 |
Mar. 2023 |
June 2023 |
Sept. 2023 |
|
|
Total private (1) |
||||||||||
|
Gross job gains |
291,045 | 272,908 | 257,840 | 265,731 | 254,774 | 7.1 | 6.7 | 6.2 | 6.4 | 6.1 |
|
At expanding establishments |
232,170 | 213,004 | 202,339 | 206,289 | 198,977 | 5.7 | 5.2 | 4.9 | 5.0 | 4.8 |
|
At opening establishments |
58,875 | 59,904 | 55,501 | 59,442 | 55,797 | 1.4 | 1.5 | 1.3 | 1.4 | 1.3 |
|
Gross job losses |
241,090 | 243,103 | 240,875 | 269,241 | 252,692 | 5.9 | 5.9 | 5.8 | 6.5 | 6.1 |
|
At contracting establishments |
184,555 | 188,452 | 186,740 | 215,086 | 193,840 | 4.5 | 4.6 | 4.5 | 5.2 | 4.7 |
|
At closing establishments |
56,535 | 54,651 | 54,135 | 54,155 | 58,852 | 1.4 | 1.3 | 1.3 | 1.3 | 1.4 |
|
Net employment change (2) |
49,955 | 29,805 | 16,965 | -3,510 | 2,082 | 1.2 | 0.8 | 0.4 | -0.1 | 0.0 |
|
Construction |
||||||||||
|
Gross job gains |
16,003 | 16,094 | 16,971 | 16,699 | 16,159 | 7.5 | 7.5 | 7.8 | 7.6 | 7.4 |
|
At expanding establishments |
12,095 | 12,622 | 13,839 | 13,006 | 12,437 | 5.7 | 5.9 | 6.4 | 5.9 | 5.7 |
|
At opening establishments |
3,908 | 3,472 | 3,132 | 3,693 | 3,722 | 1.8 | 1.6 | 1.4 | 1.7 | 1.7 |
|
Gross job losses |
15,373 | 15,228 | 14,309 | 16,116 | 16,802 | 7.2 | 7.2 | 6.6 | 7.4 | 7.6 |
|
At contracting establishments |
11,563 | 11,477 | 10,892 | 12,841 | 12,372 | 5.4 | 5.4 | 5.0 | 5.9 | 5.6 |
|
At closing establishments |
3,810 | 3,751 | 3,417 | 3,275 | 4,430 | 1.8 | 1.8 | 1.6 | 1.5 | 2.0 |
|
Net employment change (2) |
630 | 866 | 2,662 | 583 | -643 | 0.3 | 0.3 | 1.2 | 0.2 | -0.2 |
|
Manufacturing |
||||||||||
|
Gross job gains |
18,016 | 15,389 | 14,942 | 16,109 | 15,795 | 4.4 | 3.7 | 3.6 | 3.8 | 3.7 |
|
At expanding establishments |
16,462 | 13,580 | 13,402 | 13,576 | 14,025 | 4.0 | 3.3 | 3.2 | 3.2 | 3.3 |
|
At opening establishments |
1,554 | 1,809 | 1,540 | 2,533 | 1,770 | 0.4 | 0.4 | 0.4 | 0.6 | 0.4 |
|
Gross job losses |
13,947 | 14,399 | 13,261 | 14,255 | 14,275 | 3.4 | 3.4 | 3.1 | 3.3 | 3.3 |
|
At contracting establishments |
11,875 | 12,580 | 11,018 | 12,427 | 12,104 | 2.9 | 3.0 | 2.6 | 2.9 | 2.8 |
|
At closing establishments |
2,072 | 1,819 | 2,243 | 1,828 | 2,171 | 0.5 | 0.4 | 0.5 | 0.4 | 0.5 |
|
Net employment change (2) |
4,069 | 990 | 1,681 | 1,854 | 1,520 | 1.0 | 0.3 | 0.5 | 0.5 | 0.4 |
|
Wholesale trade |
||||||||||
|
Gross job gains |
13,317 | 10,832 | 10,030 | 10,876 | 10,262 | 6.0 | 4.8 | 4.4 | 4.8 | 4.5 |
|
At expanding establishments |
11,613 | 9,437 | 8,665 | 9,331 | 8,699 | 5.2 | 4.2 | 3.8 | 4.1 | 3.8 |
|
At opening establishments |
1,704 | 1,395 | 1,365 | 1,545 | 1,563 | 0.8 | 0.6 | 0.6 | 0.7 | 0.7 |
|
Gross job losses |
9,186 | 8,793 | 9,882 | 9,782 | 10,411 | 4.1 | 3.9 | 4.4 | 4.4 | 4.6 |
|
At contracting establishments |
7,082 | 6,811 | 7,736 | 8,253 | 7,854 | 3.2 | 3.0 | 3.4 | 3.7 | 3.5 |
|
At closing establishments |
2,104 | 1,982 | 2,146 | 1,529 | 2,557 | 0.9 | 0.9 | 1.0 | 0.7 | 1.1 |
|
Net employment change (2) |
4,131 | 2,039 | 148 | 1,094 | -149 | 1.9 | 0.9 | 0.0 | 0.4 | -0.1 |
|
Retail trade |
||||||||||
|
Gross job gains |
32,073 | 27,673 | 29,535 | 27,109 | 27,502 | 6.2 | 5.4 | 5.7 | 5.2 | 5.4 |
|
At expanding establishments |
27,726 | 23,209 | 25,705 | 22,977 | 23,999 | 5.4 | 4.5 | 5.0 | 4.4 | 4.7 |
|
At opening establishments |
4,347 | 4,464 | 3,830 | 4,132 | 3,503 | 0.8 | 0.9 | 0.7 | 0.8 | 0.7 |
|
Gross job losses |
30,707 | 30,437 | 24,741 | 30,883 | 30,773 | 6.0 | 6.0 | 4.8 | 6.0 | 6.0 |
|
At contracting establishments |
26,687 | 26,379 | 20,569 | 27,408 | 25,592 | 5.2 | 5.2 | 4.0 | 5.3 | 5.0 |
|
At closing establishments |
4,020 | 4,058 | 4,172 | 3,475 | 5,181 | 0.8 | 0.8 | 0.8 | 0.7 | 1.0 |
|
Net employment change (2) |
1,366 | -2,764 | 4,794 | -3,774 | -3,271 | 0.2 | -0.6 | 0.9 | -0.8 | -0.6 |
|
Transportation and warehousing |
||||||||||
|
Gross job gains |
14,450 | 17,919 | 11,470 | 13,356 | 11,741 | 5.4 | 6.6 | 4.3 | 5.0 | 4.4 |
|
At expanding establishments |
13,061 | 14,219 | 9,653 | 11,505 | 9,845 | 4.9 | 5.2 | 3.6 | 4.3 | 3.7 |
|
At opening establishments |
1,389 | 3,700 | 1,817 | 1,851 | 1,896 | 0.5 | 1.4 | 0.7 | 0.7 | 0.7 |
|
Gross job losses |
12,872 | 11,703 | 17,537 | 14,008 | 12,424 | 4.8 | 4.2 | 6.4 | 5.2 | 4.6 |
|
At contracting establishments |
10,192 | 9,408 | 15,591 | 12,321 | 10,512 | 3.8 | 3.4 | 5.7 | 4.6 | 3.9 |
|
At closing establishments |
2,680 | 2,295 | 1,946 | 1,687 | 1,912 | 1.0 | 0.8 | 0.7 | 0.6 | 0.7 |
|
Net employment change (2) |
1,578 | 6,216 | -6,067 | -652 | -683 | 0.6 | 2.4 | -2.1 | -0.2 | -0.2 |
|
Information |
||||||||||
|
Gross job gains |
9,065 | 7,941 | 9,164 | 5,913 | 5,488 | 7.1 | 6.3 | 7.3 | 4.8 | 4.9 |
|
At expanding establishments |
7,867 | 6,694 | 8,084 | 4,900 | 4,168 | 6.2 | 5.3 | 6.4 | 4.0 | 3.7 |
|
At opening establishments |
1,198 | 1,247 | 1,080 | 1,013 | 1,320 | 0.9 | 1.0 | 0.9 | 0.8 | 1.2 |
|
Gross job losses |
10,139 | 9,122 | 8,553 | 14,648 | 11,916 | 8.0 | 7.3 | 6.8 | 11.9 | 10.5 |
|
At contracting establishments |
8,349 | 7,827 | 6,721 | 12,166 | 9,861 | 6.6 | 6.3 | 5.3 | 9.9 | 8.7 |
|
At closing establishments |
1,790 | 1,295 | 1,832 | 2,482 | 2,055 | 1.4 | 1.0 | 1.5 | 2.0 | 1.8 |
|
Net employment change (2) |
-1,074 | -1,181 | 611 | -8,735 | -6,428 | -0.9 | -1.0 | 0.5 | -7.1 | -5.6 |
|
Financial activities |
||||||||||
|
Gross job gains |
17,661 | 15,011 | 14,141 | 19,477 | 14,597 | 6.7 | 5.7 | 5.4 | 7.4 | 5.5 |
|
At expanding establishments |
15,038 | 11,569 | 11,219 | 15,875 | 11,449 | 5.7 | 4.4 | 4.3 | 6.0 | 4.3 |
|
At opening establishments |
2,623 | 3,442 | 2,922 | 3,602 | 3,148 | 1.0 | 1.3 | 1.1 | 1.4 | 1.2 |
|
Gross job losses |
14,279 | 14,599 | 13,001 | 17,826 | 15,020 | 5.5 | 5.5 | 5.0 | 6.7 | 5.6 |
|
At contracting establishments |
10,397 | 10,955 | 9,098 | 10,660 | 11,013 | 4.0 | 4.1 | 3.5 | 4.0 | 4.1 |
|
At closing establishments |
3,882 | 3,644 | 3,903 | 7,166 | 4,007 | 1.5 | 1.4 | 1.5 | 2.7 | 1.5 |
|
Net employment change (2) |
3,382 | 412 | 1,140 | 1,651 | -423 | 1.2 | 0.2 | 0.4 | 0.7 | -0.1 |
|
Professional and business services |
||||||||||
|
Gross job gains |
66,934 | 58,863 | 47,767 | 53,413 | 53,225 | 8.7 | 7.5 | 6.1 | 7.0 | 7.0 |
|
At expanding establishments |
51,814 | 48,462 | 39,886 | 43,085 | 42,919 | 6.7 | 6.2 | 5.1 | 5.6 | 5.6 |
|
At opening establishments |
15,120 | 10,401 | 7,881 | 10,328 | 10,306 | 2.0 | 1.3 | 1.0 | 1.4 | 1.4 |
|
Gross job losses |
54,347 | 56,258 | 59,856 | 63,912 | 55,380 | 7.0 | 7.2 | 7.7 | 8.4 | 7.3 |
|
At contracting establishments |
41,625 | 43,429 | 48,389 | 53,441 | 42,803 | 5.4 | 5.6 | 6.2 | 7.0 | 5.6 |
|
At closing establishments |
12,722 | 12,829 | 11,467 | 10,471 | 12,577 | 1.6 | 1.6 | 1.5 | 1.4 | 1.7 |
|
Net employment change (2) |
12,587 | 2,605 | -12,089 | -10,499 | -2,155 | 1.7 | 0.3 | -1.6 | -1.4 | -0.3 |
|
Education and health services |
||||||||||
|
Gross job gains |
34,443 | 32,337 | 31,908 | 37,872 | 33,130 | 5.7 | 5.3 | 5.1 | 6.1 | 5.2 |
|
At expanding establishments |
28,514 | 26,379 | 26,705 | 30,523 | 27,676 | 4.7 | 4.3 | 4.3 | 4.9 | 4.3 |
|
At opening establishments |
5,929 | 5,958 | 5,203 | 7,349 | 5,454 | 1.0 | 1.0 | 0.8 | 1.2 | 0.9 |
|
Gross job losses |
24,299 | 29,845 | 25,224 | 27,087 | 25,358 | 4.0 | 4.9 | 4.1 | 4.3 | 4.0 |
|
At contracting establishments |
17,587 | 22,808 | 19,112 | 21,317 | 19,069 | 2.9 | 3.7 | 3.1 | 3.4 | 3.0 |
|
At closing establishments |
6,712 | 7,037 | 6,112 | 5,770 | 6,289 | 1.1 | 1.2 | 1.0 | 0.9 | 1.0 |
|
Net employment change (2) |
10,144 | 2,492 | 6,684 | 10,785 | 7,772 | 1.7 | 0.4 | 1.0 | 1.8 | 1.2 |
|
Leisure and hospitality |
||||||||||
|
Gross job gains |
44,893 | 44,983 | 41,184 | 40,257 | 44,419 | 9.3 | 9.1 | 8.2 | 8.0 | 8.8 |
|
At expanding establishments |
34,865 | 34,226 | 32,312 | 29,824 | 33,039 | 7.2 | 6.9 | 6.4 | 5.9 | 6.5 |
|
At opening establishments |
10,028 | 10,757 | 8,872 | 10,433 | 11,380 | 2.1 | 2.2 | 1.8 | 2.1 | 2.3 |
|
Gross job losses |
39,123 | 34,919 | 34,802 | 42,273 | 43,124 | 8.1 | 7.1 | 7.0 | 8.4 | 8.6 |
|
At contracting establishments |
30,570 | 26,719 | 26,493 | 33,182 | 33,177 | 6.3 | 5.4 | 5.3 | 6.6 | 6.6 |
|
At closing establishments |
8,553 | 8,200 | 8,309 | 9,091 | 9,947 | 1.8 | 1.7 | 1.7 | 1.8 | 2.0 |
|
Net employment change (2) |
5,770 | 10,064 | 6,382 | -2,016 | 1,295 | 1.2 | 2.0 | 1.2 | -0.4 | 0.2 |
|
Other services (3) |
||||||||||
|
Gross job gains |
10,250 | 9,436 | 8,625 | 10,052 | 8,249 | 9.4 | 8.5 | 7.8 | 9.0 | 7.3 |
|
At expanding establishments |
7,780 | 7,332 | 6,531 | 6,849 | 6,136 | 7.1 | 6.6 | 5.9 | 6.1 | 5.4 |
|
At opening establishments |
2,470 | 2,104 | 2,094 | 3,203 | 2,113 | 2.3 | 1.9 | 1.9 | 2.9 | 1.9 |
|
Gross job losses |
8,288 | 8,655 | 9,094 | 7,661 | 8,768 | 7.5 | 7.8 | 8.2 | 6.9 | 7.7 |
|
At contracting establishments |
5,496 | 6,132 | 6,424 | 5,678 | 6,154 | 5.0 | 5.5 | 5.8 | 5.1 | 5.4 |
|
At closing establishments |
2,792 | 2,523 | 2,670 | 1,983 | 2,614 | 2.5 | 2.3 | 2.4 | 1.8 | 2.3 |
|
Net employment change (2) |
1,962 | 781 | -469 | 2,391 | -519 | 1.9 | 0.7 | -0.4 | 2.1 | -0.4 |
|
Footnotes: |
||||||||||
| Category | Gross job gains as a percent of employment (3 months ended) |
Gross job losses as a percent of employment (3 months ended) |
||||||||
|---|---|---|---|---|---|---|---|---|---|---|
| Sept. 2022 |
Dec. 2022 |
Mar. 2023 |
June 2023 |
Sept. 2023 |
Sept. 2022 |
Dec. 2022 |
Mar. 2023 |
June 2023 |
Sept. 2023 |
|
|
United States(1) |
6.9 | 6.3 | 6.2 | 6.2 | 5.8 | 5.9 | 5.9 | 5.4 | 5.9 | 5.9 |
|
Alabama |
6.9 | 6.6 | 6.4 | 5.9 | 5.9 | 5.9 | 6.1 | 5.5 | 5.7 | 6.0 |
|
Alaska |
8.5 | 10.9 | 10.4 | 11.0 | 8.5 | 10.4 | 9.2 | 8.0 | 8.9 | 10.5 |
|
Arizona |
7.1 | 6.6 | 5.9 | 7.0 | 6.7 | 5.5 | 6.0 | 5.4 | 6.5 | 5.9 |
|
Arkansas |
6.5 | 6.2 | 5.8 | 5.8 | 5.6 | 5.2 | 5.2 | 5.0 | 6.0 | 5.7 |
|
California |
6.8 | 6.6 | 6.1 | 6.7 | 6.2 | 6.2 | 6.6 | 6.4 | 6.4 | 6.5 |
|
Colorado |
7.0 | 7.6 | 7.2 | 7.3 | 5.5 | 7.1 | 6.9 | 6.5 | 6.6 | 6.2 |
|
Connecticut |
6.3 | 5.9 | 6.1 | 6.4 | 5.8 | 6.2 | 5.9 | 5.3 | 5.7 | 6.2 |
|
Delaware |
8.6 | 7.0 | 6.7 | 6.0 | 6.0 | 6.2 | 7.5 | 5.2 | 5.7 | 6.5 |
|
District of Columbia |
7.2 | 5.6 | 5.9 | 5.4 | 5.5 | 5.0 | 5.5 | 4.8 | 5.3 | 5.4 |
|
Florida |
7.8 | 6.2 | 6.3 | 6.8 | 6.5 | 5.6 | 6.0 | 5.6 | 5.8 | 5.8 |
|
Georgia |
7.1 | 6.7 | 6.2 | 6.4 | 6.1 | 5.9 | 5.9 | 5.8 | 6.5 | 6.1 |
|
Hawaii |
6.4 | 6.0 | 5.5 | 5.7 | 5.3 | 4.9 | 4.9 | 5.0 | 5.2 | 6.9 |
|
Idaho |
7.8 | 8.4 | 7.9 | 7.9 | 7.3 | 7.5 | 6.9 | 7.5 | 7.5 | 8.2 |
|
Illinois |
5.8 | 5.4 | 5.8 | 5.4 | 4.8 | 5.3 | 5.1 | 4.8 | 5.3 | 5.5 |
|
Indiana |
6.4 | 5.7 | 5.5 | 5.5 | 5.8 | 5.5 | 5.2 | 5.0 | 6.1 | 5.8 |
|
Iowa |
5.9 | 6.4 | 6.0 | 6.0 | 5.5 | 5.9 | 6.2 | 5.4 | 5.9 | 5.8 |
|
Kansas |
7.4 | 6.3 | 6.1 | 6.1 | 5.7 | 5.5 | 5.6 | 5.4 | 6.0 | 6.0 |
|
Kentucky |
6.6 | 6.0 | 6.1 | 5.6 | 5.7 | 5.4 | 5.3 | 4.9 | 5.9 | 5.5 |
|
Louisiana |
6.9 | 6.1 | 6.3 | 6.1 | 6.2 | 5.7 | 6.2 | 5.6 | 6.4 | 6.0 |
|
Maine |
7.6 | 7.4 | 7.7 | 7.6 | 6.8 | 7.3 | 6.8 | 6.2 | 7.6 | 7.8 |
|
Maryland |
7.4 | 6.6 | 6.8 | 6.7 | 6.4 | 6.0 | 6.9 | 5.6 | 6.3 | 6.5 |
|
Massachusetts |
6.2 | 5.5 | 5.8 | 5.9 | 5.4 | 6.1 | 5.8 | 4.7 | 5.7 | 6.1 |
|
Michigan |
5.7 | 5.9 | 5.7 | 5.9 | 5.2 | 5.8 | 5.2 | 4.9 | 5.3 | 5.9 |
|
Minnesota |
6.5 | 5.9 | 5.7 | 6.0 | 3.1 | 5.9 | 5.8 | 4.9 | 5.6 | 4.2 |
|
Mississippi |
7.2 | 6.8 | 6.1 | 6.3 | 6.2 | 6.3 | 6.2 | 5.7 | 6.6 | 6.2 |
|
Missouri |
6.8 | 6.1 | 6.5 | 5.9 | 5.6 | 6.3 | 5.8 | 5.1 | 5.9 | 5.8 |
|
Montana |
8.7 | 9.2 | 8.7 | 7.8 | 7.7 | 7.8 | 7.8 | 7.1 | 8.4 | 8.5 |
|
Nebraska |
7.1 | 6.0 | 6.3 | 6.0 | 6.0 | 6.1 | 5.7 | 5.1 | 5.6 | 5.9 |
|
Nevada |
7.4 | 6.4 | 6.2 | 6.6 | 6.5 | 5.8 | 6.1 | 5.7 | 6.0 | 5.5 |
|
New Hampshire |
6.9 | 6.7 | 7.0 | 6.7 | 5.9 | 6.7 | 6.0 | 5.9 | 6.3 | 6.7 |
|
New Jersey |
6.8 | 6.8 | 6.1 | 6.8 | 5.9 | 6.4 | 5.9 | 5.7 | 5.9 | 5.9 |
|
New Mexico |
8.0 | 6.7 | 6.8 | 6.4 | 6.1 | 5.9 | 6.2 | 5.9 | 6.2 | 6.7 |
|
New York |
6.6 | 5.9 | 6.5 | 6.3 | 5.8 | 5.9 | 6.0 | 5.1 | 5.7 | 6.1 |
|
North Carolina |
6.7 | 6.6 | 6.4 | 6.1 | 5.6 | 5.8 | 5.7 | 5.3 | 5.7 | 6.2 |
|
North Dakota |
7.6 | 6.4 | 7.6 | 6.9 | 6.6 | 6.3 | 6.7 | 5.6 | 6.7 | 6.6 |
|
Ohio |
5.8 | 5.9 | 5.8 | 5.6 | 5.2 | 5.5 | 5.7 | 4.9 | 5.7 | 5.7 |
|
Oklahoma |
7.4 | 6.6 | 6.3 | 6.2 | 6.2 | 5.6 | 5.9 | 5.3 | 6.0 | 6.0 |
|
Oregon |
6.7 | 6.5 | 7.3 | 6.4 | 6.1 | 6.0 | 6.2 | 6.1 | 6.9 | 6.9 |
|
Pennsylvania |
6.1 | 5.5 | 5.5 | 5.2 | 5.2 | 5.1 | 5.2 | 4.6 | 5.5 | 5.2 |
|
Rhode Island |
6.7 | 6.9 | 7.5 | 6.7 | 6.5 | 7.3 | 6.4 | 5.9 | 7.0 | 6.8 |
|
South Carolina |
7.3 | 6.9 | 6.8 | 6.4 | 6.8 | 5.6 | 6.2 | 5.8 | 6.8 | 5.7 |
|
South Dakota |
7.3 | 6.5 | 7.2 | 6.8 | 6.3 | 6.4 | 6.5 | 5.9 | 6.2 | 6.3 |
|
Tennessee |
7.0 | 5.8 | 5.9 | 5.9 | 2.7 | 5.5 | 5.6 | 5.0 | 5.5 | 4.2 |
|
Texas |
7.2 | 6.2 | 5.9 | 5.8 | 5.7 | 5.3 | 5.3 | 5.0 | 5.4 | 5.5 |
|
Utah |
7.5 | 6.9 | 7.0 | 6.8 | 6.8 | 6.8 | 6.6 | 6.2 | 6.2 | 6.5 |
|
Vermont |
7.2 | 7.8 | 8.2 | 7.4 | 6.3 | 7.8 | 7.0 | 6.0 | 7.5 | 8.0 |
|
Virginia |
7.5 | 6.2 | 6.2 | 6.0 | 5.8 | 6.1 | 5.8 | 5.2 | 5.8 | 6.0 |
|
Washington |
7.2 | 5.9 | 6.4 | 6.0 | 5.4 | 6.3 | 5.3 | 5.5 | 5.6 | 6.0 |
|
West Virginia |
8.1 | 6.6 | 7.1 | 6.1 | 6.5 | 6.9 | 6.4 | 5.3 | 6.1 | 6.5 |
|
Wisconsin |
6.0 | 6.0 | 6.0 | 5.6 | 5.2 | 5.8 | 5.5 | 4.9 | 5.9 | 5.9 |
|
Wyoming |
9.2 | 9.2 | 8.9 | 8.4 | 8.2 | 8.4 | 7.9 | 7.8 | 8.7 | 8.2 |
|
Puerto Rico |
6.2 | 6.6 | 5.1 | 5.8 | 5.7 | 5.3 | 6.1 | 5.7 | 4.9 | 5.4 |
|
Virgin Islands |
8.5 | 5.9 | 7.5 | 7.4 | 8.2 | 5.5 | 4.7 | 6.5 | 6.8 | 7.1 |
|
Footnotes |
||||||||||
Last Modified Date: Tuesday, May 07, 2024